- Demographics of Latvia
-
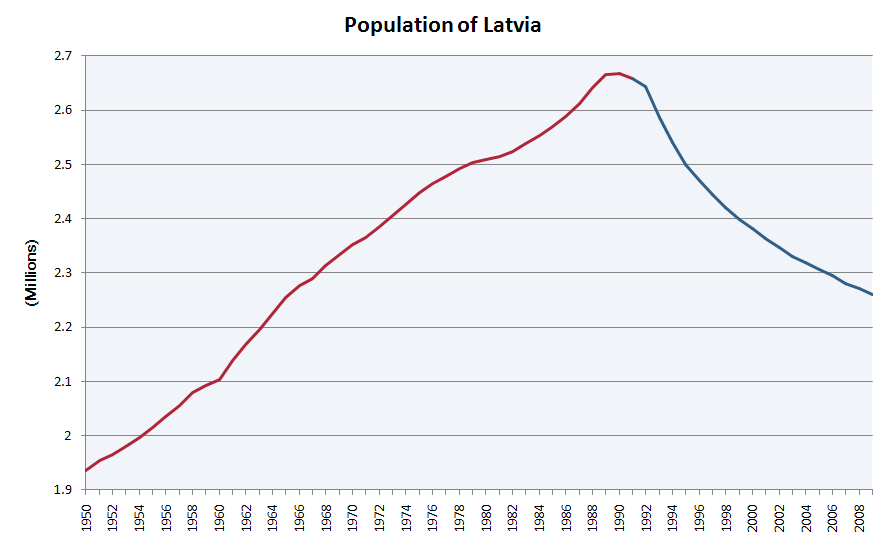
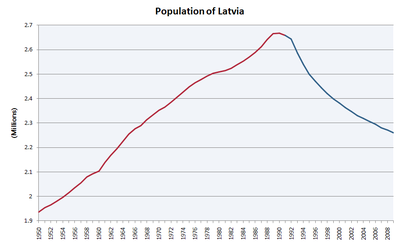 Population of Latvia (in millions) from 1950-2010.
This article is about the demographic features of the population of the historical territory of Latvia, including population density, ethnic background, education level, health of the populace, economic status, religious affiliations and other aspects of the population.
Contents
Background
Latvia was settled by the Baltic tribes some three millennia ago. The territories along the eastern Baltic first came under foreign domination at the beginning of the 13th century, with the formal establishment of Riga in 1201 under the German Teutonic Knights.
Latvia, in whole or in parts, remained under foreign rule for the next eight centuries, finding itself at the cross-roads of all the regional superpowers of their day, including Denmark (the Danes held on lands around the Gulf of Riga), Sweden, and Russia, with southern (Courland) Latvia being at one time a vassal to Poland-Lithuania as well as Latgale falling directly under Poland-Lithuania rule. Through all this time, Latvia remained largely under Baltic German hegemony, with Baltic Germans comprising the largest land-owners, a situation which did not change until Latvia's independence.
Historically, Latvia has had significant German, Russian, Jewish and Polish minorities. The majority (roughly two thirds) of Latvians, under Swedish influences, adopted Lutheranism, while the minority (the remaining third) of Latvians under Poland-Lithuania, Latgale in particular, retained their Catholicism. Aglona, in Latgale, has been the site of annual Catholic pilgrimage for centuries, even through to today.
Historical shifts
In 1897, the first official census in this area indicated that Latvians formed 68.3 % of the total population of 1.93 million; Russians accounted for 12%, Jews for 7.4 %, Germans for 6.2 %, and Poles for 3.4 %. The remainder were Lithuanians, Estonians, Gypsies, and various other nationalities.
The demographics shifted greatly in the 20th century due to the world wars, the repatriation of the Baltic Germans, the Holocaust, and occupation by the Soviet Union. Today, only the Russian minority, which has tripled in numbers since 1935, remains important. The share of ethnic Latvians grew from 77% (1,467,035) in 1935 to 80% (1,508,800), after human loss in WWII and human deportation and other repressive measures, fell strongly to 52% (1,387,757) in 1989.
In 2005, there were even fewer Latvians than in 1989, though their share of the population was larger - 1,357,099 (58.8% of the inhabitants). People who arrived in Latvia during the Soviet era, and their descendants born before 21 August 1991, have to pass a naturalisation process to receive Latvian citizenship. Children born to residents after the restoration of independence in 1991 automatically receive citizenship. However, if both parents are "stateless," then the parents must take the extra step of choosing Latvian citizenship for their child—who is automatically entitled, but for whom citizenship is not automatic (neither granted nor imposed).
Over 130,000 persons have been naturalized as Latvian citizens since 1995, but 351,435 persons (231,711 of them ethnic Russians), as of July 2009, live in Latvia with aliens' passports. Large numbers of Russians, as well as some Ukrainians and Belarussians remained in Latvia after the fall of the Soviet Union.
Latvians and Livonians, the indigenous peoples of Latvia, are now[when?] 60% of the population. Livonians are the other indigenous ethnic group, with about 100 of them remaining. Some Latgalians consider themselves as a group separate from Latvians, but the predominant view is that Latgalians are a distinctive subgroup of Latvians.
According to rankings provided by the United states Census Bureau - International Data Base (IDB) - Country Rankings, Latvia is estimated to have a population of 1,544,000 in the year 2050.
Ethnic groups
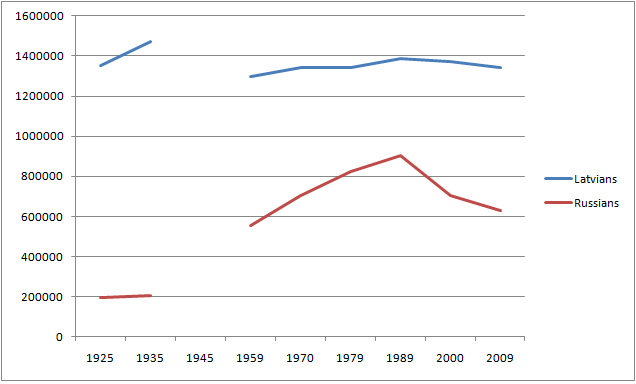
Population of Latvia according to ethnic group 1925-2011 Ethnic
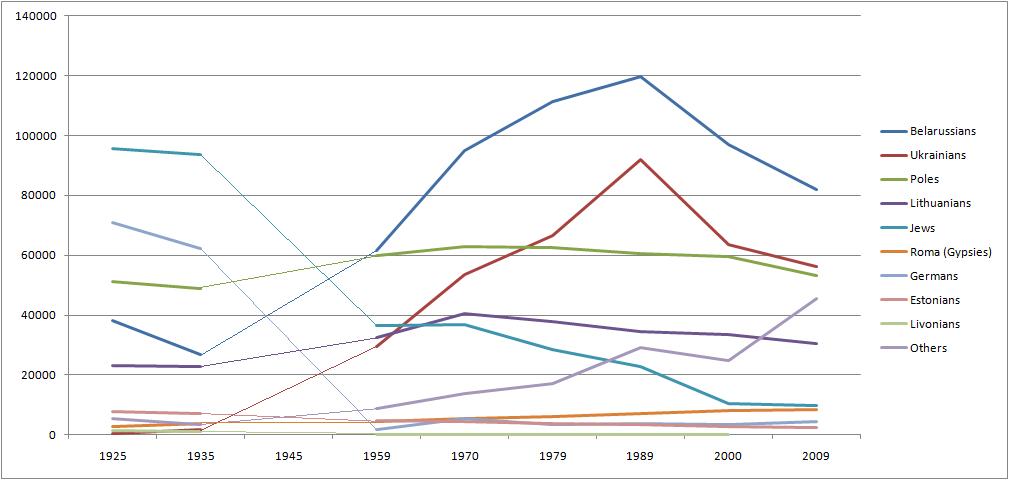
groupcensus 1925 [1] census 1935 [1] census 1959 [2] census 1970 [3] census 1979 [4] census 1989 [5] census 2000 [6] 2011 [6][2]</ref> Number % Number % Number % Number % Number % Number % Number % Number % Latvians 1,354,126 73.4 1,472,612 75.5 1,297,881 62.0 1,341,805 56.8 1,344,105 53.7 1,387,757 52.0 1,370,703 57.7 1,327,129 59.5 Russians 193,648 10.5 206,499 10.6 556,448 26.6 704,599 29.8 821,464 32.8 905,515 34.0 703,243 29.6 610,297 27.4 Belarusians 38,010 2.1 26,867 1.4 61,587 2.9 94,898 4.0 111,505 4.5 119,702 4.5 97,150 4.1 78,556 3.5 Ukrainians 512 0.0 1,844 0.1 29,440 1.4 53,461 2.3 66,703 2.7 92,101 3.5 63,644 2.7 54,425 2.4 Poles 51,143 2.8 48,949 2.5 59,774 2.9 63,045 2.7 62,690 2.5 60,416 2.3 59,505 2.5 51,397 2.3 Lithuanians 23,192 1.3 22,913 1.2 32,383 1.6 40,589 1.7 37,818 1.5 34,630 1.3 33,430 1.4 29,376 1.3 Jews 95,675 5.2 93,479 4.8 36,592 1.8 36,680 1.6 28,331 1.1 22,897 0.9 10,385 0.4 9,529 0.4 Roma 2,870 0.2 3,839 0.2 4,301 0.2 5,427 0.2 6,134 0.3 7,044 0.3 8,205 0.3 8,536 0.4 Germans 70,964 3.8 62,144 3.2 1,609 0.1 5,413 0.2 3,299 0.1 3,783 0.1 3,465 0.1 4,548 0.2 Estonians 7,893 0.4 7,014 0.4 4,610 0.2 4,334 0.2 3,681 0.2 3,312 0.1 2,652 0.1 2,359 0.1 Livonians 1,268 0.1 944 0.0 185 0.0 48 0.0 107 0.0 135 0.0 180 0.0 — Others 5,504 0.3 3,398 0.2 8,648 0.4 13,828 0.6 16,979 0.7 29,275 1.1 24,824 1.1 53,489 2.5 Total 1,844,805 1,950,502 2,093,458 2,364,127 2,502,816 2,666,567 2,377,383 2,236,910  Ethnic Latvians and Russians
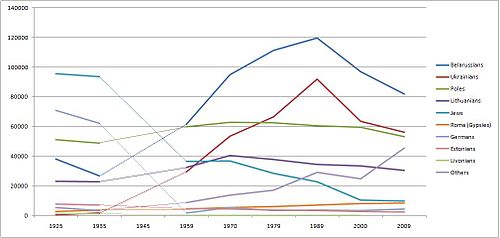 Smaller ethnic minorities
CIA World Factbook demographic statistics
The following data are estimates as of September 2009, obtained from the CIA World Factbook.
Age structure
0–14 years: 13.5% (male 152,706/female 145,756)
15–64 years: 69.5% (male 747,044/female 785,521)
65 years and over: 16,9% (male 121,570/female 252,111) (2011 est.)Net migration rate
-2.33 migrant(s)/1,000 population (2011 est.)
Sex ratio
at birth: 1.054 male(s)/female
under 15 years: 1.05 male(s)/female
15–64 years: 0.95 male(s)/female
65 years and over: 0.48 male(s)/female
total population: 0.86 male(s)/female (2011 est.)Infant mortality rate
Total 8.42 deaths/1,000 live births
Male 10.2 deaths/1,000 live births
Female 6.53 deaths/1,000 live births (2011 est.)Life expectancy at birth
total population: 72.68 years
male: 67.56 years
female: 78.07 years (2011 est.)Total fertility rate
1.32 children born/woman (2011 est.)
Nationality
noun: Latvian(s) (archaic: Lett(s))
adjective: Latvian (archaic: Lettish)Religions
NB. In a 2005 survey, 24.1 % described themselves as Russian Orthodox, 20.7% Catholics, 20.0% Lutherans, 4.4% Old Believers, 10.6% non-denominational believers and 15.8% non-believers.[7]
Literacy
definition: age 15 and over can read and write
total population: 99.7%
male: 99.8%
female: 99.7% (2000 census)Languages
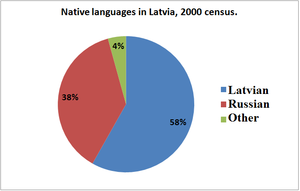 Proportional distribution of native languages in Latvia, according to 2000 official census.See also: Language policy in Latvia
- official: Latvian
- considered indigenous in some legislation: Livonian, Latgalian
- other languages registered as mother tongue by at least 500 speakers in 2000 census[8] (in declining order): Russian, Belarusian, Ukrainian, Lithuanian, Polish, Romani, Tatar, Yiddish and Hebrew, Estonian, German
- other languages widely spoken: English
In the 2000 census, 1,311,093 persons in Latvia reported Latvian as their mother tongue; 891,451 respondents listed Russian as their mother tongue,[8] representing 37.5% of the total population, whereas Latvian was recorded as the mother tongue for 58.2%.[9] Latvian was spoken as a second language by 20.8% of the population, and 43.7% spoke Russian as a second language.[10] In total, 71% of ethnic Latvians said they could speak Russian, and 52% of Russians could speak Latvian.[11]
Table of vital statistics
- Source: Latvijas Statistika and UN Demographic Yearbooks
Average population (x 1000) Live births Deaths Natural change Crude birth rate (per 1000) Crude death rate (per 1000) Natural change (per 1000) 1946 1 636 30 544 32 266 -1 722 18.7 19.7 -1.1 1947 1 787 34 832 32 435 2 397 19.5 18.2 1.3 1948 1 872 35 402 26 500 8 902 18.9 14.2 4.8 1949 1 886 35 671 25 640 10 031 18.9 13.6 5.3 1950 1 887 33 137 24 250 8 887 17.6 12.9 4.7 1951 1 895 32 764 23 898 8 866 17.3 12.6 4.7 1952 1 906 32 278 22 680 9 598 16.9 11.9 5.0 1953 1 926 30 986 22 761 8 225 16.1 11.8 4.3 1954 1 953 33 202 22 500 10 702 17.0 11.5 5.5 1955 1 981 32 968 21 330 11 638 16.6 10.8 5.9 1956 2 018 32 590 20 339 12 251 16.1 10.1 6.1 1957 2 054 33 714 21 087 12 627 16.4 10.3 6.1 1958 2 073 35 068 20 910 14 158 16.9 10.1 6.8 1959 2 092 35 028 22 601 12 427 16.7 10.8 5.9 1960 2 121 35 468 21 314 14 154 16.7 10.0 6.7 1961 2 153 35 993 21 759 14 234 16.7 10.1 6.6 1962 2 182 35 061 23 592 11 469 16.1 10.8 5.3 1963 2 211 33 843 22 703 11 140 15.3 10.3 5.0 1964 2 241 33 053 21 165 11 888 14.7 9.4 5.3 1965 2 266 31 212 22 780 8 432 13.8 10.1 3.7 1966 2 283 31 974 23 350 8 624 14.0 10.2 3.8 1967 2 301 32 232 24 362 7 870 14.0 10.6 3.4 1968 2 324 32 693 25 104 7 589 14.1 10.8 3.3 1969 2 343 32 915 26 229 6 686 14.0 11.2 2.9 1970 2 359 34 333 26 546 7 787 14.6 11.3 3.3 1971 2 376 35 239 26 275 8 964 14.8 11.1 3.8 1972 2 396 35 007 27 296 7 711 14.6 11.4 3.2 1973 2 416 34 008 28 139 5 869 14.1 11.6 2.4 1974 2 437 34 920 28 143 6 777 14.3 11.5 2.8 1975 2 456 34 810 30 042 4 768 14.2 12.2 1.9 1976 2 470 34 644 30 373 4 271 14.0 12.3 1.7 1977 2 485 34 240 30 869 3 371 13.8 12.4 1.4 1978 2 498 34 258 31 261 2 997 13.7 12.5 1.2 1979 2 506 34 683 32 162 2 521 13.8 12.8 1.0 1980 2 512 35 534 32 100 3 434 14.1 12.8 1.4 1981 2 519 35 732 32 090 3 642 14.2 12.7 1.4 1982 2 531 37 477 31 234 6 243 14.8 12.3 2.5 1983 2 546 40 572 32 330 8 242 15.9 12.7 3.2 1984 2 562 40 847 33 406 7 441 15.9 13.0 2.9 1985 2 579 39 571 34 166 5 405 15.3 13.2 2.1 1986 2 600 41 960 31 328 10 632 16.1 12.0 4.1 1987 2 627 42 135 32 150 9 985 16.0 12.2 3.8 1988 2 653 41 275 32 421 8 854 15.6 12.2 3.3 1989 2 667 38 922 32 584 6 338 14.6 12.2 2.4 1990 2 663 37 918 34 812 3 106 14.2 13.1 1.2 1991 2 651 34 633 34 749 - 116 13.1 13.1 -0.0 1992 2 614 31 569 35 420 -3 851 12.1 13.6 -1.5 1993 2 563 26 759 39 197 -12 438 10.4 15.3 -4.9 1994 2 521 24 256 41 757 -17 501 9.6 16.6 -6.9 1995 2 485 21 595 38 931 -17 336 8.7 15.7 -7.0 1996 2 457 19 782 34 320 -14 538 8.1 14.0 -5.9 1997 2 433 18 830 33 533 -14 703 7.7 13.8 -6.0 1998 2 410 18 410 34 200 -15 790 7.6 14.2 -6.6 1999 2 390 19 396 32 844 -13 448 8.1 13.7 -5.6 2000 2 373 20 248 32 205 -11 957 8.5 13.6 -5.0 2001 2 355 19 664 32 991 -13 327 8.3 14.0 -5.7 2002 2 339 20 044 32 498 -12 454 8.6 13.9 -5.3 2003 2 325 21 006 32 437 -11 431 9.0 14.0 -4.9 2004 2 313 20 334 32 024 -11 690 8.8 13.8 -5.1 2005 2 301 21 497 32 777 -11 280 9.3 14.2 -4.9 2006 2 288 22 264 33 098 -10 834 9.7 14.5 -4.7 2007 2 276 23 273 33 042 -9 769 10.2 14.5 -4.3 2008 2 266 23 948 31 006 -7 058 10.6 13.7 -3.1 2009 2 255 21 677 29 897 -8 220 9.6 13.3 -3.6 2010 (p) 2 239 19 220 29 970 -10 750 8.6 13.4 -4.8 p=preliminary
See also
- Aging of Europe
- List of cities in the Baltic states by population
References
- ^ a b "Ethnicities in region of Latvia. Statistics". roots-saknes.lv. http://www.roots-saknes.lv/Ethnicities/ethnicities_statistics.htm. Retrieved 2010-01-02.
- ^ "Всесоюзная перепись населения 1959 года. Национальный состав населения по республикам СССР" (in Russian). demoscope.ru. http://demoscope.ru/weekly/ssp/sng_nac_59.php. Retrieved 2010-01-02.
- ^ "Всесоюзная перепись населения 1970 года. Национальный состав населения по республикам СССР" (in Russian). demoscope.ru. http://demoscope.ru/weekly/ssp/sng_nac_70.php. Retrieved 2010-01-02.
- ^ "Всесоюзная перепись населения 1979 года. Национальный состав населения по республикам СССР" (in Russian). demoscope.ru. http://demoscope.ru/weekly/ssp/sng_nac_79.php. Retrieved 2010-01-02.
- ^ "Всесоюзная перепись населения 1989 года. Национальный состав населения по республикам СССР" (in Russian). demoscope.ru. http://demoscope.ru/weekly/ssp/sng_nac_89.php. Retrieved 2010-01-02.
- ^ a b [1]
- ^ Samazinās to Latvijas iedzīvotāju īpatsvars, kuri sevi uzskata par luterāņiem(Latvian)
- ^ a b Central Statistical Bureau Database for 2000 Census, table on mother tongues (Latvian)
- ^ 2000 census results — choose "Results of Population Census Year 2000, in short" and "Iedzīvotāju dzimtā valoda un citu valodu prasme"(Latvian)
- ^ LR CSP preses izlaidums: 2000. Gada Tautas Skaitīšana Latvijā; 07.11.2000.(Latvian)
- ^ Dažādu tautu valodu prasme(Latvian)
External links
- Naturalization Board of the Republic of Latvia: Figures and facts
- Office of Citizenship and Migration Affairs: Statistics
Demographics of Europe Sovereign
states- Albania
- Andorra
- Armenia
- Austria
- Azerbaijan
- Belarus
- Belgium
- Bosnia and Herzegovina
- Bulgaria
- Croatia
- Cyprus
- Czech Republic
- Denmark
- Estonia
- Finland
- France
- Georgia
- Germany
- Greece
- Hungary
- Iceland
- Ireland
- Italy
- Kazakhstan
- Latvia
- Liechtenstein
- Lithuania
- Luxembourg
- Macedonia
- Malta
- Moldova
- Monaco
- Montenegro
- Netherlands
- Norway
- Poland
- Portugal
- Romania
- Russia
- San Marino
- Serbia
- Slovakia
- Slovenia
- Spain
- Sweden
- Switzerland
- Turkey
- Ukraine
- United Kingdom
- (England
- Northern Ireland
- Scotland
- Wales)
- Vatican City
States with limited
recognition- Abkhazia
- Kosovo
- Nagorno-Karabakh
- Northern Cyprus
- South Ossetia
- Transnistria
Dependencies
and other territories- Åland
- Faroe Islands
- Gibraltar
- Guernsey
- Jan Mayen
- Jersey
- Isle of Man
- Svalbard
Other entities - European Union
Categories:- Demographics by country
- Latvian society

Wikimedia Foundation. 2010.