- Demographics of Luxembourg
-
This article is about the demographic features of the population of Luxembourg, including population density, ethnicity, education level, health of the populace, economic status, religious affiliations and other aspects of the population.
The following is an overview of the demographics of Luxembourg. Demographic topics include basic statistics, most populous cites, and religious affiliation.
The population of Luxembourg as of October 2009 was estimated at 493,500 [1]
The people of Luxembourg are called Luxembourgers.[2]
Contents
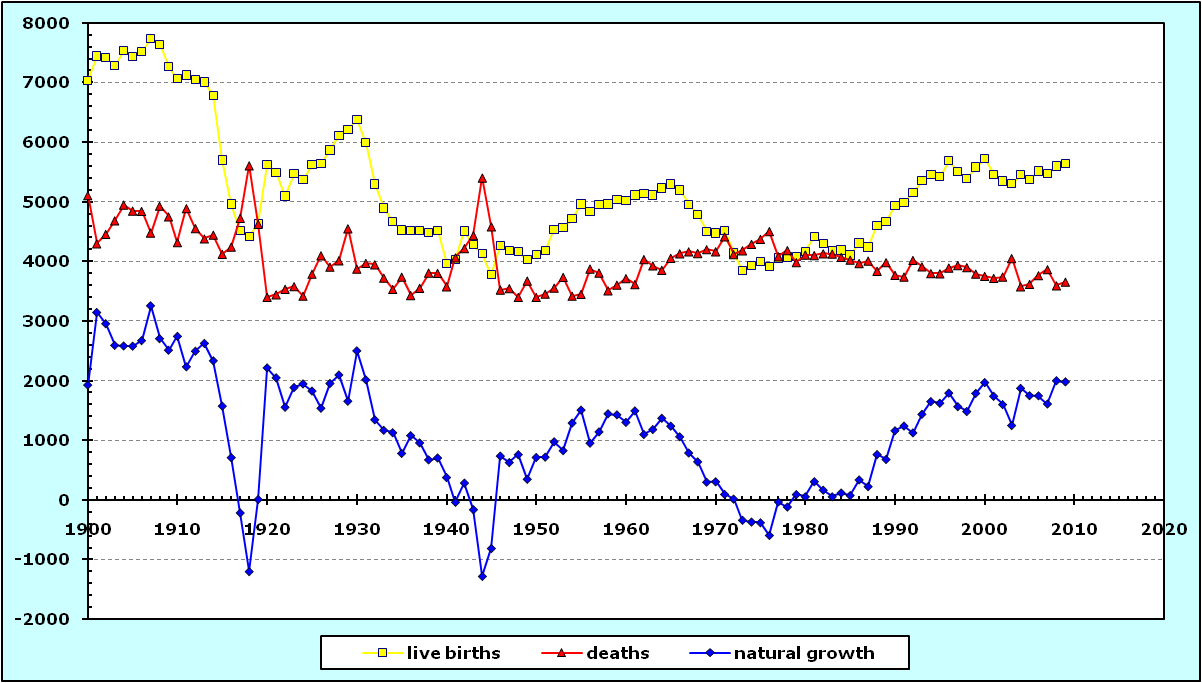
Vital statistics since 1900 [3]
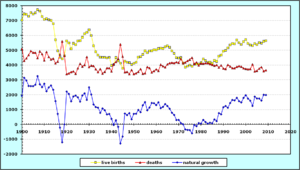 Vital statistics of Luxemburg 1900 till present.
Average population (x 1000) Live births Deaths Natural change Crude birth rate (per 1000) Crude death rate (per 1000) Natural change (per 1000) 1900 234 7 037 5 109 1 928 30.1 21.9 8.2 1901 236 7 444 4 300 3 144 31.5 18.2 13.3 1902 238 7 416 4 460 2 956 31.1 18.7 12.4 1903 241 7 279 4 686 2 593 30.3 19.5 10.8 1904 243 7 535 4 952 2 583 31.0 20.4 10.6 1905 245 7 431 4 851 2 580 30.3 19.8 10.5 1906 248 7 516 4 844 2 672 30.3 19.6 10.8 1907 250 7 738 4 482 3 256 30.9 17.9 13.0 1908 253 7 639 4 933 2 706 30.2 19.5 10.7 1909 256 7 264 4 752 2 512 28.4 18.6 9.8 1910 258 7 065 4 321 2 744 27.4 16.7 10.6 1911 260 7 126 4 892 2 234 27.4 18.8 8.6 1912 262 7 051 4 556 2 495 26.9 17.4 9.5 1913 264 7 009 4 383 2 626 26.5 16.6 9.9 1914 266 6 781 4 446 2 335 25.5 16.7 8.8 1915 265 5 701 4 126 1 575 21.5 15.6 5.9 1916 264 4 958 4 246 712 18.8 16.1 2.7 1917 263 4 516 4 730 - 214 17.1 18.0 -0.8 1918 263 4 413 5 611 -1 198 16.8 21.4 -4.6 1919 262 4 638 4 627 11 17.7 17.7 0.0 1920 261 5 621 3 404 2 217 21.6 13.1 8.5 1921 261 5 494 3 444 2 050 21.1 13.2 7.9 1922 262 5 094 3 538 1 556 19.5 13.5 5.9 1923 263 5 468 3 581 1 887 20.8 13.6 7.2 1924 266 5 369 3 421 1 948 20.2 12.9 7.3 1925 268 5 619 3 791 1 828 21.0 14.1 6.8 1926 270 5 639 4 100 1 539 20.9 15.2 5.7 1927 278 5 864 3 909 1 955 21.1 14.1 7.0 1928 287 6 114 4 017 2 097 21.3 14.0 7.3 1929 292 6 210 4 553 1 657 21.3 15.6 5.7 1930 297 6 377 3 876 2 501 21.4 13.0 8.4 1931 300 5 988 3 971 2 017 20.0 13.3 6.7 1932 299 5 295 3 949 1 346 17.7 13.2 4.5 1933 298 4 895 3 725 1 170 16.4 12.5 3.9 1934 298 4 665 3 535 1 130 15.7 11.9 3.8 1935 297 4 523 3 740 783 15.2 12.6 2.6 1936 298 4 514 3 433 1 081 15.2 11.5 3.6 1937 299 4 514 3 555 959 15.1 11.9 3.2 1938 301 4 486 3 811 675 14.9 12.7 2.2 1939 300 4 511 3 804 707 15.0 12.7 2.4 1940 296 3 959 3 580 379 13.4 12.1 1.3 1941 292 4 029 4 065 - 36 13.8 13.9 -0.1 1942 290 4 506 4 220 286 15.6 14.6 1.0 1943 289 4 277 4 437 - 160 14.8 15.4 -0.6 1944 285 4 128 5 406 -1 278 14.5 18.9 -4.5 1945 284 3 775 4 585 - 810 13.3 16.2 -2.9 1946 286 4 263 3 525 738 14.9 12.3 2.6 1947 289 4 178 3 548 630 14.5 12.3 2.2 1948 292 4 162 3 400 762 14.3 11.6 2.6 1949 294 4 026 3 676 350 13.7 12.5 1.2 1950 296 4 116 3 401 715 13.9 11.5 2.4 1951 297 4 176 3 456 720 14.0 11.6 2.4 1952 299 4 535 3 557 978 15.2 11.9 3.3 1953 301 4 565 3 737 828 15.2 12.4 2.7 1954 303 4 713 3 421 1 292 15.6 11.3 4.3 1955 305 4 962 3 453 1 509 16.3 11.3 5.0 1956 307 4 833 3 878 955 15.8 12.6 3.1 1957 309 4 954 3 811 1 143 16.1 12.4 3.7 1958 310 4 959 3 512 1 447 16.0 11.3 4.7 1959 312 5 037 3 607 1 430 16.1 11.6 4.6 1960 314 5 019 3 716 1 303 16.0 11.8 4.1 1961 317 5 112 3 616 1 496 16.1 11.4 4.7 1962 321 5 137 4 037 1 100 16.0 12.6 3.4 1963 324 5 112 3 929 1 183 15.8 12.1 3.7 1964 328 5 229 3 857 1 372 16.0 11.8 4.2 1965 332 5 297 4 057 1 240 16.0 12.2 3.7 1966 334 5 194 4 133 1 061 15.6 12.4 3.2 1967 335 4 957 4 166 791 14.8 12.4 2.4 1968 336 4 780 4 138 642 14.2 12.3 1.9 1969 338 4 503 4 202 301 13.3 12.5 0.9 1970 339 4 476 4 168 308 13.2 12.3 0.9 1971 342 4 512 4 416 96 13.2 12.9 0.3 1972 347 4 138 4 120 18 11.9 11.9 0.1 1973 351 3 847 4 184 - 337 11.0 11.9 -1.0 1974 355 3 925 4 291 - 366 11.1 12.1 -1.0 1975 359 3 997 4 376 - 379 11.1 12.2 -1.1 1976 361 3 915 4 507 - 592 10.8 12.5 -1.6 1977 362 4 053 4 083 - 30 11.2 11.3 -0.1 1978 362 4 072 4 187 - 115 11.2 11.6 -0.3 1979 363 4 078 3 985 93 11.2 11.0 0.3 1980 364 4 169 4 113 56 11.4 11.3 0.2 1981 365 4 414 4 105 309 12.1 11.2 0.8 1982 366 4 300 4 133 167 11.8 11.3 0.5 1983 366 4 185 4 129 56 11.4 11.3 0.2 1984 366 4 192 4 072 120 11.5 11.1 0.3 1985 367 4 104 4 027 77 11.2 11.0 0.2 1986 368 4 309 3 970 339 11.7 10.8 0.9 1987 371 4 238 4 012 226 11.4 10.8 0.6 1988 374 4 603 3 840 763 12.3 10.3 2.0 1989 378 4 665 3 984 681 12.4 10.6 1.8 1990 382 4 936 3 773 1 163 12.9 9.9 3.0 1991 387 4 986 3 744 1 242 12.9 9.7 3.2 1992 392 5 149 4 022 1 127 13.1 10.3 2.9 1993 397 5 353 3 915 1 438 13.5 9.8 3.6 1994 403 5 451 3 800 1 651 13.5 9.4 4.1 1995 409 5 421 3 797 1 624 13.3 9.3 4.0 1996 414 5 689 3 895 1 794 13.7 9.4 4.3 1997 419 5 503 3 937 1 566 13.1 9.4 3.7 1998 425 5 386 3 901 1 485 12.7 9.2 3.5 1999 430 5 582 3 793 1 789 13.0 8.8 4.2 2000 436 5 723 3 754 1 969 13.1 8.6 4.5 2001 442 5 459 3 719 1 740 12.4 8.4 3.9 2002 446 5 345 3 744 1 601 12.0 8.4 3.6 2003 452 5 303 4 053 1 250 11.7 9.0 2.8 2004 458 5 452 3 578 1 874 11.9 7.8 4.1 2005 465 5 371 3 621 1 750 11.5 7.8 3.8 2006 473 5 514 3 766 1 748 11.7 8.0 3.7 2007 480 5 477 3 866 1 611 11.4 8.1 3.4 2008 489 5 596 3 595 2 001 11.5 7.4 4.1 2009 498 5 639 3 657 1 982 11.3 7.3 4.0 Foreign population in Luxembourg
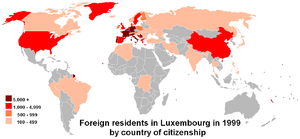
The foreign population resident in Luxembourg currently numbers over 170.700, corresponding to 38% of the total population (compared to 17% in the 1960s). These immigrants are overwhelmingly nationals of EU countries (accounting for over 90%), by far the greater part of whom originally come from Portugal, Italy and the two neighbouring countries, France and Belgium. For some years, there has also been a big increase in the number of immigrants and asylum seekers from the countries of Eastern Europe, and especially the new republics to have emerged from the former Yugoslavia (Bosnia and Herzegovina, Serbia, Montenegro, and Kosovo). These immigrants include a considerable proportion of young people. Immigrants (especially asylum seekers) have a strong impact on the birth rate, accounting for nearly 50% of births in Luxembourg.
A more detailed breakdown by nationality shows that the Portuguese community is still the largest group, accounting for more than a third of the foreign population. The Italian population has been stable for the past ten years at approximatively 20 000. Some 47.000 foreigners come from bordering countries (France, Belgium and Germany).
Religious affiliation
The predominant religion of the Luxembourg population is Roman Catholic, with Protestant, Anglican, Jewish and Muslim minorities. According to a 1979 law, the government forbids collection of data on religious practices, but over 90% is estimated to be baptized Catholic (the Virgin Mary is the Patroness of the city of Luxembourg).
The Lutheran and Calvinist Churches are the largest Protestant denominations. Muslims are estimated to number approximately 6.000 persons, including 1.500 refugees from Montenegro; Orthodox (Greek, Serbian, Russian, and Roman) adherents are estimated to number approximately 5.000 persons: and there are approximately 1.000 Jews. Freedom of religion is provided by the Luxembourg Constitution.
CIA World Factbook demographic statistics
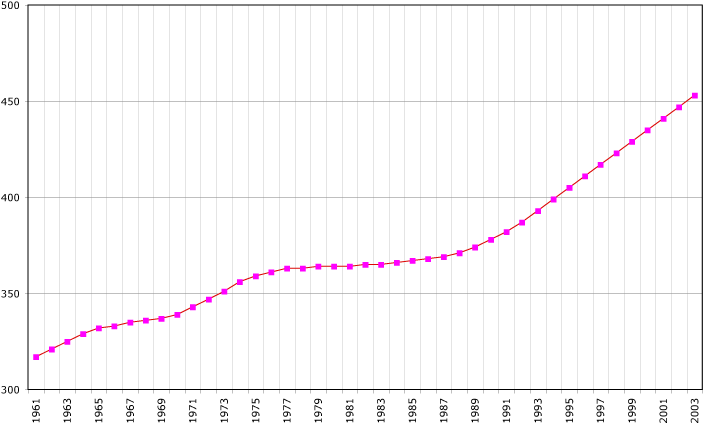
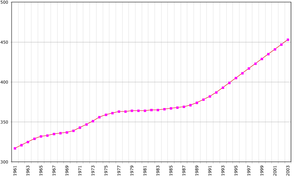 Demographics of Luxembourg, Data of FAO, year 2005 ; Number of inhabitants in thousands.
The following demographic statistics are from the CIA World Factbook, unless otherwise indicated.
Age structure
(2002 est.)
- 0–14 years: 18.9% (male 43,634; female 41,164)
- 15–64 years: 67% (male 151,364; female 149,156)
- 65 years and over: 14.1% (male 25,486; female 37,765)
Immigration|Net migration rate
8.64 migrant(s)/1,000 population (2007 est.)
Sex ratio
(2002 est.)
- at birth: 1.07 male(s)/female
- under 15 years: 1.06 male(s)/female
- 15–64 years: 1.01 male(s)/female
- 65 years and over: 0.67 male(s)/female
- total population: 0.97 male(s)/female
Infant mortality rate
4.68 deaths/1,000 live births (2007 est.)
Life expectancy at birth
(2007 est.)
- total population: 79.03 years
- male: 75.76 years
- female: 82.52 years
Total fertility rate
1.7 children born/woman (2002 est.)
HIV/AIDS
- HIV/AIDS adult prevalence rate: 0.16% (1999 est.)
- HIV/AIDS deaths: fewer than 100 (1999 est.)
Languages
Luxembourgish (national and administrative language), German (administrative language), French (administrative language)
Literacy
(2000 est.) Definition: age 15 and over can read and write.
- total population: 100%
- male: 100%
- female: 100%
- See also : Luxembourg
Note
Demographics of Europe Sovereign
states- Albania
- Andorra
- Armenia
- Austria
- Azerbaijan
- Belarus
- Belgium
- Bosnia and Herzegovina
- Bulgaria
- Croatia
- Cyprus
- Czech Republic
- Denmark
- Estonia
- Finland
- France
- Georgia
- Germany
- Greece
- Hungary
- Iceland
- Ireland
- Italy
- Kazakhstan
- Latvia
- Liechtenstein
- Lithuania
- Luxembourg
- Macedonia
- Malta
- Moldova
- Monaco
- Montenegro
- Netherlands
- Norway
- Poland
- Portugal
- Romania
- Russia
- San Marino
- Serbia
- Slovakia
- Slovenia
- Spain
- Sweden
- Switzerland
- Turkey
- Ukraine
- United Kingdom
- (England
- Northern Ireland
- Scotland
- Wales)
- Vatican City
States with limited
recognition- Abkhazia
- Kosovo
- Nagorno-Karabakh
- Northern Cyprus
- South Ossetia
- Transnistria
Dependencies
and other territories- Åland
- Faroe Islands
- Gibraltar
- Guernsey
- Jan Mayen
- Jersey
- Isle of Man
- Svalbard
Other entities - European Union
Categories:- Health in Luxembourg
- Luxembourgian society
- Demographics by country

Wikimedia Foundation. 2010.