- Asian people
-
"Asians" redirects here. For a nomadic Central Asian people of antiquity, see Asii.For the individual peoples of Asia, see ethnic groups in Asia. For demographic data, see demography of Asia.
Race Classification Genetics Group differences Cross-race effect
History race and intelligence
Race and crime (US, UK)
Race and health
Race and intelligence
Race and sportsSocial Related Ethnic group
Category: Race
Genetics
Human evolution
Racism topicsAsian people[1] or Asiatic people[2] is a term with multiple meanings that refers to people who descend from a portion of Asia's population.
Definitions by country
Central Asia
- for historical background see Mawarannahr
Native ethnic groups of Kazakhstan, Kyrgyzstan, Uzbekistan, Tajikistan and Turkmenistan self-identify themselves as Asian. They are also recognized as Asian by Russians and Chinese.[citation needed]
This self-identification is based phenotypically, and on cultural differences from Russians, as these countries used to be parts of the Russian Empire and the Soviet Union, and therefore have significant Russian populations. Another reason for such self-identification is patriotic: "the native people of the Center of Asia - are undoubtedly Asians".[citation needed]
Anglophone Africa and Caribbean
Further information: Asians in South Africa, Indo-Caribbean, Indo-African (disambiguation), and Afro-AsianIn parts of anglophone Africa, especially East Africa and South Africa, and in parts of the Anglophone Caribbean, the term "Asian" is more commonly associated with people of South Asian origin, particularly Indians, Pakistanis, Bangladeshis and Sri Lankans.[3]
Australia
Main article: Asian AustralianNotably, the Australian Census includes Central Asia, a region that is often considered to be part of the Greater Middle East.[4] The Australian Census includes four regions of Asia in its official definition. Defined by the 2006–2011 Australian Census, three broad groups have the word Asian included in their name: Central and Southern Asian, South-East Asian and North-East Asian. Russians are classified as Southern and Eastern Europeans while Middle Easterners are classified as North African and Middle Easterners.[5]
Canada
Main article: Asian CanadianThe Canadian Census' list of Visible Minorities includes "West Asian", "South Asian" and "Southeast Asian".[6] The Canadian government uses "West Asian" in its statistics; however people from the Arab countries are counted in a separate "Arab" category.[7][8]
New Zealand
New Zealand's census undertaken by Statistics New Zealand defines the Asian to include people of Chinese, Indian, Korean, Filipino, Japanese, Vietnamese, Sri Lankan, Cambodian and Thai ancestries.[9] In less formal contexts, the term Asian often does not include South Asian people.[10]
Norway
Statistics Norway considers people of Asian background to be people from all Asian countries.[11][12]
United Kingdom
Main article: British AsianIn the United Kingdom, the term "Asian" is more commonly associated with people of South Asian origin, particularly Indians, Pakistanis, Bangladeshis and Sri Lankans.[3][13] The UK usage of the term "Asian" is reflected in the "ethnic group" section of UK census forms, which treat "Asian" and "Chinese" as separate (see British Asian).[14] Most respondents to the UK 2001 Census of non-Chinese East Asian and Southeast Asian descent chose to write-in their ethnicity in the "Other Ethnic Group" category rather than the "Other Asian" category, reflecting the association of the word Asian in the UK with South Asian.[15] Despite there being a strong presence of East Asians in the United Kingdom there are considerably more South Asians, for example the 2001 Census recorded 1.05 million people of Indian origin and 247,000 of Chinese origin in the UK.[16] Peter J. Aspinall of the Centre for Health Services Studies, University of Kent, recommends privileging the term "South Asian" over the term "Asian", since the term "Asian" is a "contested term".[13]
United States
Main articles: Asian American and Racial classification of Indian AmericansIn 1968, an Asian activist conference decided on favoring the name "Asian American" over the competing terms: "yellow", "Mongolian", "Asiatic" and "Oriental", since the Filipinos at the meeting thought they were "brown" rather than "yellow" and the conference thought the term "Oriental" was Eurocentric, since they originate from lands "east" only from Europe's standpoint and, since the term "Oriental" suggested to them "passivity".[17]
Earlier Census forms from 1980 and prior listed particular Asian ancestries as separate groups along with White and Black or Negro.[18] Previously, Asian Americans were classified as "other".[19] But the 1980 Census marked the first general analyses of Asians as a group, combining several individual ancestry groups into "Asian or Pacific Islander." By the 1990 Census, Asian or Pacific Islander (API) was included as an explicit category, although respondents had to select one particular ancestry.[20][21][22]
 Asian ancestries as defined by the 2000 U.S. Census.
The 2000 and 2010 U.S. Census Bureau definition of the Asian "race" includes those who originate from the original peoples of the "Far East", "Southeast Asia" and the "Indian subcontinent".[23]
In 1930 and 1940, Indian Americans were identified as a separate race, Hindu, and in 1950 and 1960 they were racially classified as Other Race, and then in 1970 they were classified as White. Since 1980, Indians and all other South Asians have been classified as part of the Asian race.[24] Sociologist Madhulika Khandelwal described how "....as a result of activism, South Asians came to be included as 'Asians' in the census only in the 80's. Prior to that many South Asians had been checking 'Caucasian' or 'Other'."[25]
Respondents can also report their specific ancestry, e.g.: Okinawan, etc. Someone reporting these ancestries but no race would be classified as "Asian". Unlike South Asians, Middle Eastern Americans and Central Asian Americans have not lobbied to be included as Asians by the U.S. Census Board.[26]
In normal American usage Asian does not refer to the people from the Pacific Islands who are usually called Pacific Islanders.[27] The term "Asians and Pacific Islanders" or "Asia/Pacific" was used on the 1990 US Census.[28] However, in the 2000 US Census, the Asian or Pacific Islander category was separated into two categories, "Asian" and "Native Hawaiian or Other Pacific Islander".[29]
Definition by non-government sources
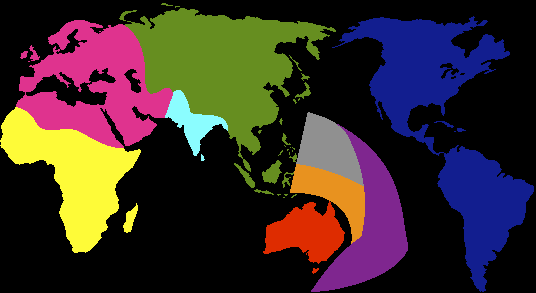
 This is a genetic distance map of human populations made by geneticist Luigi Luca Cavalli-Sforza of Stanford University.[30] Cavalli-Sforza referred to both "Asian Caucasoids" and "Mongoloids" in Asia which he also called "other Asians" as encompassing "Asian populations".[30] Cavalli-Sforza also referred to "Amerinds" as being the "aboriginal Asian group" of the Americas.[30]
Keith Lowe
Dr. Keith Lowe, race-relations expert for the Canadian government,[31] claims that Asian people refer to Central, South, Southeast and East Asians.[32]
Luigi Luca Cavalli-Sforza
In 1994, geneticist Luigi Luca Cavalli-Sforza of Stanford University divided a principal coordinant map of 42 Asian populations into three groupings: Asian Caucasoids, Northeast and East Asian and Southeast Asian.[page needed][30] The ethnic groups Cavalli-Sforza said were in the "Asian Caucasoids" cluster were the Armenian, Arabian, Assyrian, Lebanese, Bedouin, Jordanian, E. Iranian, W. Iranian, Uzbek, N. Turkic, Turkish Caucasoid, Turkmen, Brahman, Central Indian, E. Indian, S. Indian, N. Dravidian, Central Dravidian, S. Dravidian and Sri Lankan.[page needed][30] The ethnic groups Cavalli-Sforza said were in the Northeast and East Asian cluster were the Koryak, Chukchi, Reindeer Chukchi, Nganasan Samoyed, N. Tungus, Nentsy, N. Chinese, Tibetan, Bhutanese, Ainu, Mongol, Japanese and Korean.[page needed][30] The ethnic groups Cavalli-Sforza said were in the Southeast Asian cluster were Indonesian, Malaysian, Taiwan aborigines, Viet Muong, Thai, Philippine, S. Chinese, Balinese and Gurkha.[page needed][30]
Moreover, Cavalli-Sforza said there is an approximate boundary between Caucasoids and Mongoloids from the Urals to the eastern part of India.[page needed][30] Along this boundary there has been hybridization, causing a "Caucasoid-Mongoloid gradient".[page needed][30] Likewise, Cavalli-Sforza said there is a "separation between northern and southern Mongoloids starting from Southeast Asia".[page needed][30]
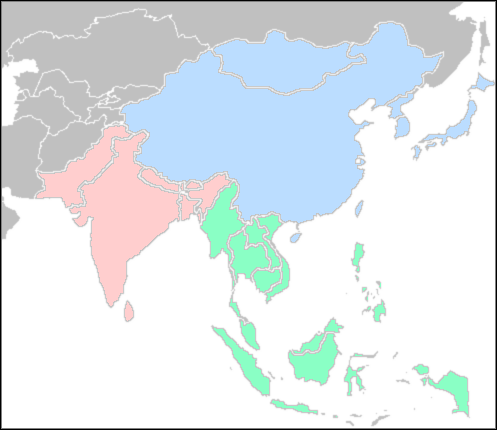
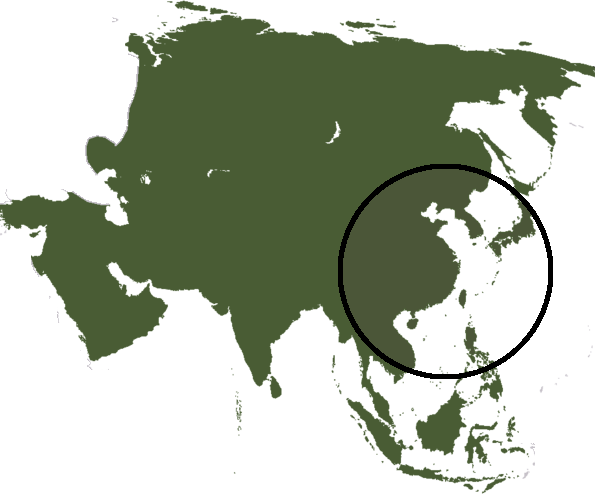
 Leonard Lieberman Professor of Anthropology at Central Michigan University said that the perception of there being a discrete Asian race in the mindset of America is due to immigration from the region circled in the picture, but Lieberman said the reality is that "not all Asians can be designated 'Mongoloid'".[33]
Marta Mirazon Lahr
Dr. Marta Mirazon Lahr of the Department of Biological Anthropology at Cambridge University said "all" "Asian populations" are "grouped under the name Mongoloid".[34]
Michael Bamshad
Michael Bamshad et al. of the Department of Human Genetics, University of Utah, found that "107 sub-Saharan African, 67 East Asian and 81 Western European" individuals genetically clustered with "ancestry from a single population" at levels of "almost 100%", but among "263 individuals from South India" the "proportion of ancestry shared with Europeans and Asians varies widely".[35]
Karen T. Taylor
Karen T. Taylor forensic art professor at the FBI Academy, Quantico, Virginia, said that the term "Asian-derived" is a modern-day euphemism for the "Mongoloid race" and it includes "Native Americans" and "various Asian groups".[36]
Eugénia Maria Guedes Pinto Antunes da Cunha
Eugénia Maria Guedes Pinto Antunes da Cunha of the Department of Anthropology, University of Coimbra, Portugal, said there has been a modern trend in "most of the forensic anthropology literature" to "rename" the term "Mongoloid", a term in which she includes the "North American Indian", with the term "Asian" or "Asiatic".[37] Antunes da Cunha said that, even though the "terminology" has changed, the "underlying assumptions are the same".[37]
Sandra Soo-Jin Lee
Sandra Soo-Jin Lee (Korean:이수진) of the Department of Cultural and Social Anthropology at Stanford University, United States of America, said that the reasoning behind "Asian" being a "race" as defined by the US Census is "difficult to determine" because it includes "South Asians".[38]
Konstantinos Moraitis
Konstantinos Moraitis (Greek:Κωνσταντίνος Μωραΐτης) of the Department of Forensic Medicine and Toxicology School of Medicine, University of Athens, Greece, said that the "Asian" group which he also refers to as the "Mongoloid" group includes both "Far East" and "Native American" people.[39]
Matt Cartmill

Race according to the World Book Encyclopedia (2011).[40] AfricanAsianAustralianEuropeanIndianMelanesianMatt Cartmill of the Department of Biological Anthropology and Anatomy, Duke University, United States, said "geography has little to do with the race concept in its actual application", since "Asian individuals [can be] born in the same geographical region" as other races.[41]
Masniari Novita
Masniari Novita of the Biomedical Department of Jember University, Jember, Indonesia, said "Asiatics" are part of the "Mongoloid" race while "Asians from the Indian Subcontinent" are part of the "Caucasian" race.[42]
Willett Enos Rotzell
Willett Enos Rotzell professor of Botany and Zoology at the Hahnemann Medical College used the term "Asian" "race" to refer to the race he alternatively called the "Yellow or Mongolian race".[43]
Eduardas Valaitas
Dr. Eduardas Valaitas of DNA Tribes said the "genetic differences" between peoples "traditionally identified" as "Asian" and other "racial group[s]" is "great enough" to provide a "rough estimate" of "percentage membership" in the "Asian" "racial group".[44] However, Valaitas said this does not apply to the "Subcontinental Indian" and "Samoan" who have "some percentage" of "American Indian, European, East Asian and Sub-Saharan Africa".[44]
Kyung-Ran Jung
In 2007, Kyung-Ran Jung et al. (Korean:전경란) of the Department of Laboratory Medicine, University of Ulsan, Seoul, South Korea used the term "Asian populations" for the group he also referred to as the "Asian-Mongoloid" in which he included Japanese, Korean, Chinese and Thai for a meta-analysis of alleles in relation to rheumatoid arthritis.[45]
Physical features
- See also: Mongoloid features
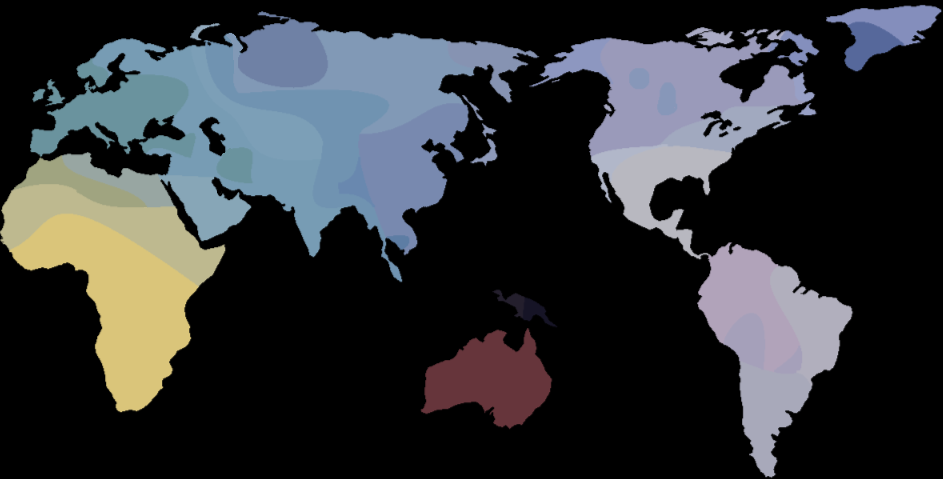
 William White Howells, professor of anthropology at Harvard University, made this map entitled "Distribution of Asian peoples" where "A" represents Australoids, "N" represents Negrito people and the colored yellow and red regions represent Sinodont and Sundadont Mongoloids respectively.[46]
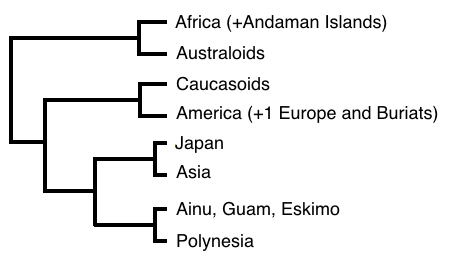
 This is a recreation of the craniometric dendogram entitled "Cranial Cluster 28 Groups" in a book by anthropologist William White Howells, professor of anthropology at Harvard University who said "Indians" or "American populations" share many characteristics with "Asians", but only "Eskimos" are "strongly Mongoloid in form".[46] Howells said "Indians" or "American populations" have a "broad and flat" "face" like Asians, but unlike Asians have a "quite prominent upper nose".[46]
Ethnologist Daniel Garrison Brinton said the Asian race has yellow or olive skin, broad face, Mongolian eye form, abundance of head hair, scant beard, small stature, coarse straight hair, a round face, small black eyes and a medium-size, flat nose. [47]
Sandy Sangrigoli et al. of the Laboratoire Cognition et Développement, Boulogne-Billancourt, France, used adults of Korean origin adopted by white families to test whether they were able to distinguish Caucasian faces at the level of a control group of French people who were shown to be better at distinguishing Caucasian faces than Asiatic faces.[48] Sangrigoli found the Korean adoptees mirrored the control group by showing greater recognition of Caucasian than Asian faces, indicating the "other-race effect" of face recognition remains plastic in childhood.[48]
Willett Enos Rotzell professor of Botany and Zoology at the Hahnemann Medical College said the Asian race has skin color ranging from a yellowish tint to an olive shade, with black and coarse hair with a circular cross section, an absent or scanty beard, a brachycephalic skull, prominent cheek bones and a broad face.[43] Rotzell said the Asian race has its original home in Asia.[43]
Konstantinos Moraitis (Greek:Κωνσταντίνος Μωραΐτης) of the Department of Forensic Medicine and Toxicology School of Medicine, University of Athens, Greece, said the Asian is distinguished by a flat face, rounded orbits, pronounced zygomatics and an intermediate nasal aperture and spine.[39]
Asian fat distribution
Qing He et al. of the of the Obesity Research Center at Columbia University did a study on "fat distribution" of 358 prepubertal children and found that Asians had less gynoid fat than African Americans and more relative trunk fat than Caucasians, but less relative extremity fat than Caucasians.[49]
Victor H.H. Goh (Chinese:吴) et al. of the Department of Obstetrics and Gynecology, National University of Singapore, did a study that found that the World Health Organization's obesity cut off based on body mass index misclassified the true obese in an Asian population by labeling 3.76 times more men and 1.64 times more women as obese than would actually be obese.[50]
Asian noses
Jeffrey Min Ahn (Korean:안민) professor at the College of Physicians & Surgeons of Columbia University, said that the "typical Asian nose" has "a broad low dorsum, decreased tip projection, thick, lobular skin, wide lobule, abundant subcutaneous fatty tissue, alar flaring, a retracted columella, and a small osteocartilaginous framework."[51]
Eun-Sang Dhong (Korean:동은상) of the Department of Plastic and Reconstructive Surgery, Korea University Medical Center, Seoul, Korea, measured 52 alar cartiliges of 26 Koreans and concluded that the alar cartiliges" in Asians is not much smaller than whites.[52]
Kyung-Wook Chun (Korean:전경욱) et al. of the Department of Plastic Surgery, Korea University College of Medicine, Korea, found using 20 cadavers that in "Asian noses" the size of the alar lobule is mainly due to the size of the dilator naris anterior muscle, the dilator naris posterior muscle and the "thickness of the external skin" rather than due to vestibular skin.[53]
Asian eyes
See also: Epicanthic foldSang-Ki Jeong (Korean:정상기) et al. of Chonnam University, Kwangju, Korea, using both Asian and Caucasian cadavers as well as four healthy young Korean men found "Asian eyelids" whether "Asian single eyelids" or "Asian double eyelids" had more fat in them than in Caucasians.[54] Jeong et al. found that the cause of the "Asian single eyelid" was that "the orbital septum fuses to the levator aponeurosis at variable distances below the superior tarsal border; (2) preaponeurotic fat pad protusion and a thick subcutaneous fat layer prevent levator fibers from extending toward the skin near the superior tarsal border; and (3) the primary insertion of the levator aponeurosis into the orbicularis muscle and into the upper eyelid skin occurs closer to the eyelid margin in Asians."[54]
Dae-Hwan Park (Korean:박대환) et al. of the Catholic University of Daegu, Gyeongsan, South Korea, used 498 "Asians" to study Asian eyes wherein he determined that in Asians the greatest growth of the "vertical dimension of the palpebral fissure", intercanthal distance and "the horizontal dimension of the palpebral fissure" were between 10 to 13 years old, 14 to 16 years old and 17 to 19 years old respectively.[55]
Wee-Kiak Lim (Chinese:林伟杰) of the Singapore National Eye Centre found that the "Asian lower eyelid differs from its non-Asian counterpart" by having "no consistent fusion between the capsulopalpebral fascia and the orbital septum inferior to the inferior tarsal border" and "no extension of the capsulopalpebral fascia".[56]
Asian teeth
See also: Sinodonty and SundadontyGeorge Richard Scott, physical anthropologist at the University of Nevada, said some East Asians (in particular, Han Chinese and some Japanese), as well as Native Americans, have a distinctive dental pattern known as Sinodonty, where, among other features, the upper first two incisors are not aligned with the other teeth, but are rotated a few degrees inward and are shovel-shaped.[57]
Asian DNA
See also: Mongoloid race#Genetic research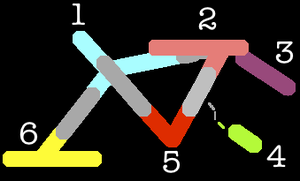
Human Genetic Map (2007) by
Peter A. Underhill, Department of Genetics, Stanford University and Toomas Kivisild Leverhulme Center of Human Evolutionary Studies, University of Cambridge[58]1. Europe2. East Asia3. Americas4. Australia and Oceania5. South Asia6. East AfricatransitionRebecca Oakley and Chris Tyler-Smith of the Department of Biochemistry at Oxford University said that 90% of the Y chromosomes of "Asian" (including "Orientals") and European men in their sample (38/42) descend from one of two males.[59] The Y chromosome type of Group 1 was only found in Caucasian or part Caucasian men, and the Y chromosome type of Group 2 was found in Caucasian and completely non-Caucasian men.[59] The Y chromosome type of Group 2 was characterized by a large alphoid block containing the additional sites for A&I, EcoO1091, and HindIII, linked to a small poxY1 BgZII fragment.[59]
Scott W. Ballinger et al. of the Department of Biochemistry at Emory University said "Asian mtDNA lineages" originated in Southern China with the "Southern Mongoloid".[60]
Hiroki Oota et al. (Japanese:太田博樹) of the Max Planck Institute for Evolutionary Anthropology, Germany, said "Asian populations" have high mtDNA variation with Vietnamese having the highest mtDNA diversity, but, overall, the genetic distance between "Asian populations" is small.[61]
Melissa L. Cann et al. of the Department of Biochemistry at the University of California, Berkley, said that early Asians did not mix with "Asian Homo and that the features of "ancient Asian forms" indicate that "Asian erectus" was not ancestral to "Homo sapiens".[62] Since modern-day "Asians" do not show the amount of mtDNA divergence expected had they mixed with Homo erectus, Cann believes the expanding Homo sapiens from Africa replaced the Asian Homo erectus.[62]
Douglas C. Wallace of the Department of Biochemistry at Emory University said the mtDNA of the indigenous peoples of the Americas is "clearly Asian in character", but the few founding females carried "rare Asian mtDNAs", causing a different frequency of mtDNA and a "dramatic founder effect".[63]
Shama Barnabas, B. Joshi and C.G. Suresh of the Division of Biochemical Sciences, National Chemical Laboratory, Pune, India, said evidence for the original people of India who they refer to as the "proto-Asiatic element" spreading into Southeast Asia to become Southeast Asians is shown by the mtDNA affinities between Indians and East Asians and Southeast Asians in DdeI 10394 site along with the associated Asian-specific AluI 10397 site.[64]
Nucleotide Diversities of Five Asian Populations and Genetic Distances among The Five Populations by Shinji Harihara et al. (Japanese: 針原伸二) of the Department of Biological Sciences at the University of Tokyo[65] Japanese Korean Ainu Aeta Vedda Japanese 0.00086
± 0.00019Korean 0.000000
± 0.0001270.00065
± 0.00017Ainu 0.000006
± 0.0001220.000004
± 0.0001140.00041
± 0.00015Aeta 0.000029
± 0.0001570.000151
± 0.0001000.000145
± 0.0000960.00050
± 0.00022Vedda 0.000091
± 0.0002140.000100
± 0.0002130.000096
± 0.0002100.000111
± 0.0002320.00110
± 0.00031Harihara et al. said that the Aeta's close genetic distance to "Mongoloid populations" (Japanese, Korean and Ainu) is consistent with previous studies.[65] Harihara et al. said the Vedda's large genetic distance from the other four populations may be due to genetic isolation, however Harihara et al. said their present-day mixture Tamils and Sinhalese makes their true phylogeny unclear.[65] Genetic diversity within/between continental populations by Hiroki Oota et al. (Japanese:太田博樹) of the Max Planck Institute for Evolutionary Anthropology, Germany[61] Number of Populations Within Populations average mean pairwise differences Between population average Fst Africa 15 7.99 ± 2.72 0.201 Europe 12 4.63 ± 0.94 0.066 Asia 12 7.12 ± 0.91 0.033 Eurasia 27 5.95 ± 1.51 0.086 mtDNA divergence within and between 5 human populations by Melissa L. Cann et al. of the Department of Biochemistry at the University of California, Berkley[62] % sequence divergence Population 1 2 3 4 5 1. African 0.47 0.04 0.04 0.05 0.06 2. Asian 0.45 0.35 0.01 0.02 0.04 3. Australian 0.40 0.31 0.25 0.03 0.04 4. Caucasian 0.40 0.31 0.27 0.23 0.05 5. New Guinean 0.42 0.34 0.29 0.29 0.25 The divergence is calculated by a way developed by Masatoshi Nei. Values of the mean pairwise divergence between individuals within populations (δx) appear on the diagonal. values below the diagonal (δxy) are the mean pairwise divergences between individuals belonging to two different populations, X and Y. Values above the diagonal (δ) are interpopulation divergences, corrected for variation within those populations with the equation δ = δxy - 0.5(δx + δy) Ancestors, lineages and extents of divergence in the geneaological tree for 134 types of human mtDNA by Melissa L. Cann et al. of the Department of Biochemistry at the University of California, Berkley[62] Number of descendant lineages or clusters specific to a region Ancestor Total Africa Asia Australia Europe New Guinea % divergence age* a 7 1 0 0 0 0 0.57 143-285 b 2 0 1 0 0 0 0.45 112-225 c 20 0 7 3 1 3 0.43 108-215 d 2 0 0 1 1 0 0.39 98-195 e 14 2 2 4 2 0 0.34 85-170 f 19 1 7 4 4 1 0.30 75-150 g 10 2 3 2 2 1 0.28 70-140 h 30 2 4 0 15 1 0.27 68-135 i 8 1 0 0 6 0 0.26 65-130 j 22 1 3 1 5 1 0.25 65-125 All 134 10 27 15 36 7 - - *Assuming that the mtDNA divergence rate is 2-4% per million years See also
- Mongoloid race
- Ethnic groups in Asia
- Afro-Asian (African-Asian mixed ancestry)
- Amerasian — especially the offspring of a U.S. serviceman and an Asian
- Asia — includes boundaries of the continent.
- Eurasian (European-Asian mixed ancestry)
- Hapa — Hawaiian term commonly referring to Eurasians
- Oriental
- Race and genetics
References
- ^ "Asian." Merriam-Webster's Online Dictionary.
- ^ United States National Library of Medicine. Medical Subject Headings. 2004. November 17, 2006.[1]: Asian Continental Ancestry Group is also used for categorical purposes.
- ^ a b British Sociological Association. Equality and Diversity. Language and the BSA:Ethnicity & Race. 2005. October 26. [2]
- ^ World Atlas.com The Middle East. September 30, 2006
- ^ Australian Bureau of Statistics. Australian Standard Classification of Cultural and Ethnic Groups Second Edition. 2005. August 20, 2006. [3]
- ^ '2001 Census Visible Minority and Population Group User Guide'
- ^ http://www.statcan.ca/english/research/89-621-XIE/89-621-XIE2007003.pdf
- ^ http://www.google.com/search?q=west+asian+site%3Astatcan.ca
- ^ Statistics New Zealand. Asian people. 2006. December 4, 2006
- ^ For example, "Asian and Indian people" are referred to in the New Zealand Heart Foundation's BMI calculator.
- ^ (Norwegian) Immigration and emigration
- ^ (Norwegian) SSB: Unge innvandrere i arbeid og utdanning - Er innvandrerungdom en marginalisert gruppe?
- ^ a b Aspinall, Peter J. Oxford Journals. Journal of Public Health. 2003. October 26, 2006. [4]
- ^ National Statistics. Ethnicity. 2005. August 27, 2006
- ^ Gardener, David; Connolly, Helen (October 2005). "Who are the 'Other' ethnic groups?". Office for National Statistics. http://www.statistics.gov.uk/articles/nojournal/other_ethnicgroups.pdf. Retrieved 2009-06-06.
- ^ "Population size: 7.9% from a minority ethnic group". Office for National Statistics. 2003-02-13. http://www.statistics.gov.uk/CCI/nugget.asp?ID=273. Retrieved 2009-06-06.
- ^ Yen Le Espiritu. (1992). Asian American Panethnicity: Bridging Institutions and Identities. Temple University Press, Philadelphia
- ^ 1980 Census: Instructions to Respondents, republished by Integrated Public Use Microdata Series, Minnesota Population Center, University of Minnesota at www.ipums.org Accessed 19 Nov 2006.
- ^ Lee, Gordon. Hyphen Magazine. "The Forgotten Revolution." 2003. January 28, 2007.[5]
- ^ 1990 Census: Instructions to Respondents, republished by Integrated Public Use Microdata Series, Minnesota Population Center, University of Minnesota at www.ipums.org Accessed 19 Nov 2006.
- ^ Reeves, Terrance Claudett, Bennett. United States Census Bureau. Asian and Pacific Islander Population: March 2002. 2003. September 30, 2006.
- ^ U.S. Bureau of Statistics
- ^ Barnes, Jessica S. and Bennett, Claudett E. The Asian Population:2000. 2002. September 1, 2006. [6]
- ^ Campbell Gibson and Kay Jung. Historical Census Statistics On Population Totals By Race, 1790 to 1990, and By Hispanic Origin, 1970 to 1990, For Large Cities And Other Urban Places In The United States, Working Paper No. 76 (2005). See footnote 6 in paper
- ^ Chandy, Sunu P. What is a Valid South Asian Struggle? Report on the Annual SASA Conference. Accessed August 8, 2008.
- ^ Not Quite White: Race Classification and the Arab American Experience, Arab American Institute, 1997, September 29, 2006.
- ^ American Heritage Book of English Usage. Asian. 1996. September 29, 2006. [7]
- ^ Census '90. Asian and Pacific Islanders in the United States. 1990. September 1, 2006. [8]
- ^ "Revisions to the Standards for the Classification of Federal Data on Race and Ethnicity". OFFICE OF MANAGEMENT AND BUDGET. http://www.whitehouse.gov/omb/fedreg/1997standards.html. "The Native Hawaiians presented compelling arguments that the standards must facilitate the production of data to describe their social and economic situation and to monitor discrimination against Native Hawaiians in housing, education, employment, and other areas. Under the current standards for data on race and ethnicity, Native Hawaiians comprise about three percent of the Asian and Pacific Islander population. By creating separate categories, the data on the Native Hawaiians and other Pacific Islander groups will no longer be overwhelmed by the aggregate data of the much larger Asian groups. Native Hawaiians will comprise about 60 percent of the new category. The Asian, Native Hawaiian, and Pacific Islander population groups are well defined; moreover, there has been experience with reporting in separate categories for the Native Hawaiian and Pacific Islander population groups. The 1990 census included "Hawaiian," "Samoan," and "Guamanian" as response categories to the race question. In addition, two of the major tests conducted as part of the current review (the NCS and the RAETT) used "Hawaiian" and/or "Native Hawaiian," "Samoan," "Guamanian," and "Guamanian or Chamorro" as response options to the race question. These factors facilitate breaking apart the current category."
- ^ a b c d e f g h i j Cavalli-Sforza, L.L., Menozzi, P. & Piazza, A. (1994). The History and Geography of Human Genes. New Jersey: Princeton University Press.
- ^ Ontario Multicultural Association. "Speaker Biography: Dr. Keith Lowe." 2007. July 29, 2007.[9]
- ^ Asian Heritage Month. "Credits." 2007. July 29, 2007
- ^ Lieberman, Leonard. (1997). Race 1997 and 2001: A Race Oddyssey. American Anthropological Association. pp. 7 & 19
- ^ Lahr, M. M. (1995), Patterns of modern human diversification: Implications for Amerindian origins. American Journal of Physical Anthropology, 38: 163–198. doi: 10.1002/ajpa.1330380609
- ^ Michael Bamshad, Stephen Wooding, Benjamin A. Salisbury and J. Claiborne Stephens. (2004). DECONSTRUCTING THE RELATIONSHIP BETWEEN GENETICS AND RACE. Nature Publishing Group. (5) pp. 598.
- ^ Taylor, K.T. (2001). Forensic Art and Illustration. CRC Press LLC. pp. 60 ISBN 0-8493-8118-5
- ^ a b Aurore Schmitt, Eugénia Maria Guedes Pinto Antunes da Cunha, and João Pinheiro. (2006). Forensic Anthropology and Medicine: Complementary Sciences from Recovery to Cause of Death. Humana Press. ISBN 1-59745-099-5
- ^ Lee, Sandra S. Mountain, Joanna. Barbara, Koening A. The Meanings of Race in the New Genomics: Implications for Health Disparities Research. Yale University. 2001. October 26, 2006. [10]
- ^ a b Konstantinos Moraitis Ph.D., Constantine Eliopoulos Ph.D., Chara Spiliopoulou MD, PhD, Sotiris Manolis Ph.D. (2009). Assessment of Ancestral Background from the Skull: Case Studies from Greece. The Internet Journal of Biological Anthropology™ ISSN: 1939-4594
- ^ "Human, Races". World Book Encyclopedia (2011). Chicago, Illinois, USA. page 55 ISBN 9780-7166-0111-1 (set)
- ^ Cartmill, M. (1999). The Status of the Race Concept in Physical Anthropology. American Anthropologist 100(3)651 -660.
- ^ Novita, Masniari. (2006). Facial, upper facial, and orbital index in Batak, Klaten, and Flores students of Jember University. Dent. J. (Maj. Ked. Gigi), Vol. 39. No. 3 116–119
- ^ a b c Willett Enos Rotzell. (1905). Man: an introduction to anthropology. Philadelphia.
- ^ a b Valaitis, E., Martin, L. DNA Tribes. 2011 September 12
- ^ Kyung Ran Jun, Sung-Eun Choi, Choong-Hwan Cha, Heung-Bum Oh,corresponding author Yong-Seok Heo, Hong-Yup Ahn, and Kwan-Jeh Lee. J Korean Med Sci. Meta-analysis of the Association between HLA-DRB1 Allele and Rheumatoid Arthritis Susceptibility in Asian Populations. 2007 December; 22(6): 973–980.
- ^ a b c Howells, William W. (1997). Getting here: the story of human evolution. ISBN 0-929590-16-3
- ^ Daniel Garrison Brinton (1890) Races and peoples: lectures on the science of ethnography
- ^ a b S. Sangrigoli, C. Pallier, A.-M. Argenti, V.A.G. Ventureyra, and S. de Schonen Reversibility of the Other-Race Effect in Face Recognition During Childhood. Psychological Science, June 2005; vol. 16, 6: pp. 440-444.
- ^ QING HE, MARY HORLICK, JOHN THORNTON, JACK WANG, RICHARD N. PIERSON, JR., STANLEY HESHKA, AND DYMPNA GALLAGHER (2002). Sex and race differences in fat distribution among Asian, African-American and Caucasian prepubertal children. Journal of Clinical Endocrinology and Metabolism. 87(5). 2164-2170.
- ^ Victor H. H. Goh, C. F. Tain, Terry Y. Y. Tong, Helen P. P. Mok and M. T. Wong. (2004). Are BMI and other anthropometric measures appropriate as indices for obesity? A study in an Asian population. The Journal of Lipid Research, 45, 1892-1898. doi: 10.1194/jlr.M400159-JLR200
- ^ Ahn, J.M. (2006). The Current Trend in Augmentation Rhinoplasty. Facial plast Surg 2006; 22(1): 061-069 DOI: 10.1055/s-2006-939954
- ^ Dhong, Eun-Sang MD, PhD; Han, Seung-Kyu MD, PhD; Lee, Chi-Ho MD; Yoon, Eul-Sik MD; Kim, Woo-Kyung MD, PhD. (2002). Anthropometric Study of Alar Cartilage in Asians. Annals of Plastic Surgery: - Volume 48 - Issue 4 - pp 386-391
- ^ K.W. Chun, H.J. Kang, S.K. Hana, Corresponding Author Contact Information, E-mail The Corresponding Author, E.S. Leea, H. Chang, S.B. Kima and W.K. Kim. (2008). Anatomy of the alar lobule in the Asian nose. Journal of Plastic, Reconstructive & Aesthetic Surgery. Volume 61, Issue 4, Pages 400-407
- ^ a b Sangki Jeong, Bradley N. Lemke, Richard K. Dortzbach, Yeoung Geol Park, and Heoung Keun Kang The Asian Upper Eyelid: An Anatomical Study With Comparison to the Caucasian Eyelid Arch Ophthalmol, Jul 1999; 117: 907 - 912.
- ^ Park, Dae Hwan M.D.; Choi, Won Seok M.D.; Yoon, Sean Hyuck M.D.; Song, Chul Hong M.D. Anthropometry of Asian Eyelids by Age. Plastic & Reconstructive Surgery: April 2008 - Volume 121 - Issue 4 - pp 1405-1413 doi: 10.1097/01.prs.0000304608.33432.67
- ^ Lim, Wee-Kiak F.R.C.Ophth., F.R.C.S.(ED.); Rajendran, Kanagasuntheram F.R.C.S.(ED.); Choo, Chai-Teck F.R.C.Ophth., F.R.C.S.(ED.) Microscopic Anatomy of the Lower Eyelid in Asians.Ophthalmic Plastic & Reconstructive Surgery: May 2004 - Volume 20 - Issue 3 - pp 207-211
- ^ George Richard Scott, Christy G. Turner. (1997). The Anthropology of Modern Human Teeth: Dental Morphology and Its Variation . Cambridge University Press. [11]
- ^ Peter A. Underhill and Toomas Kivisild Use of Y Chromosome and Mitochondrial DNA Population Structure in Tracing Human Migrations Annual Review of Genetics Vol. 41: 539-564 (Volume publication date December 2007) DOI: 10.1146/annurev.genet.41.110306.130407
- ^ a b c REBECCA OAKLEY AND CHRIS TYLER-SMITH. (1990). Y Chromosome DNA Haplotyping Suggests That Most European and Asian Men Are Descended from One of Two Males. Genomics 7(325-330).
- ^ Ballinger, S.W. (1992). Southeast Asian Mitochondrial DNA Analysis Reveals Genetic Continuity of Ancient Mongoloid Migrations. Genetics 130 139-152
- ^ a b Hiroki Oota Takashi Kitano, Feng Jin, Isao Yuasa, Li Wang, Shintaroh Ueda, Naruya Saitou, and Mark Stoneking. (2002). Extreme mtDNA Homogeneity in Continental Asian Populations. AMERICAN JOURNAL OF PHYSICAL ANTHROPOLOGY 118:146–153
- ^ a b c d Rebecca L. Cann, Mark Stoneking, and Allan C. Wilson. Mitochondrial. (1987). DNA and Human Evolution. Letters to Nature
- ^ DOUGLAS C. WALLACE, KATHERINE GARRISON, AND WILLIAM C. KNOWER. Dramatic Founder Effects in Amerindian Mitochondrial DNAs. AMERICAN JOURNAL OF PHYSICAL ANTHROPOLOGY 68:149-155 (1985)
- ^ S. Barnabas, B. Joshi and C. G. Suresh. Indian-Asian Relationship: mtDNA Reveals More. Naturwissenschaften Volume 87, Number 4, 180-183, DOI: 10.1007/s001140050699
- ^ a b c S. Harihara, N. Saitou, M. Hirai, T. Gojobori, K. S. Park,4 S. Misawa, S. B. Ellepola, T. Ishida and K. Omoto (1988). Mitochondrial DNA Polymorphism among Five Asian Populations Am. J. Hum. Genet. 43:134-143
Overseas Asians and Asian diasporas By origin East AsiansSouth AsiansBalochis · Bangladeshis · Indians (Indo-Fijians · Oriya) · Kashmiri · Nepalis · Pakistanis · Pashtuns · Punjabis · Sikhs · Sindhis · Sri Lankans · Tamils (Sri Lankan)Southeast Asians
By residence Australia · Canada · Latin America (Argentina · Brazil · Peru) · South Africa · United States (Hispanic and Latino) · United Kingdom (South Asians · East and Southeast Asians)Asian Americans East Asian 
South Asian2 Southeast Asian Burmese · Cambodian · Filipino · Hmong · Indonesian · Laotian · Laotian Chinese · Mien · Singaporean · Thai · VietnameseOther History 1 The US Census Bureau reclassifies anyone identifying as "Tibetan American" as "Chinese American". [12].
2 The US Census Bureau considers Afghanistan a South Asian country, but does not classify Afghan Americans as Asian. [13]Migration to the United Kingdom from Asia East Asia 
South Asia Southeast Asia Burmese · Filipino · Malaysian · Singaporean · Thai · VietnameseWest Asia Canadians of Asian descent by area of origin East Asia 
Southeast Asia South Asia West Asia Asian Australians East Asia 
South Asia Southeast Asia West Asia Historical definitions of race Color terminology for race Typological definitions of race Typological sub-types Alpine race · American Indian race · Arabid race · Armenoid race · Aryan race · Balkans-Caucasian race · Bantu race · Caspian race · Dinaric race · East Baltic race · Ethiopid race · Hamitic race · Dravidian race · Iranid race · Malay race · Mediterranean race · Nilotic race · Nordic race · Northcaucasian race · Pamirid race · Pontid race · Semitic race · Sudanic raceMixed races Related concepts Writers John Baker · Johann Friedrich Blumenbach · Houston Stewart Chamberlain · Carleton S. Coon · Joseph Deniker · Egon Freiherr von Eickstedt · Arthur de Gobineau · Madison Grant · Hans F. K. Günther · Georges Vacher de Lapouge · Bertil Lundman · Felix von Luschan · William Z. Ripley · Ilse Schwidetzky · Giuseppe Sergi · Lothrop StoddardWritings Categories:


Wikimedia Foundation. 2010.