- Comparison of Canadian and American economies
-
The economies of Canada and the United States are extremely similar because they are both developed countries and are each other's largest trading partners. However, key differences in population makeup, geography, government policies and productivity all result in different economies.
Canada
Canada has one of the highest levels of economic freedom in the world. Today Canada closely resembles the U.S. in its market-oriented economic system, and pattern of production.[10] As of August 2011, Canada's national unemployment rate stood at 7.2%,[11] as the economy continues its recovery from the effects of the 2007-2010 global financial crisis. In May 2010, provincial unemployment rates varied from a low of 5.0% in Saskatchewan to a high of 13.8% in Newfoundland and Labrador.[12] According to the Forbes Global 2000 list of the world's largest companies in 2008, Canada had 69 companies in the list, ranking 5th next to France.[13] As of 2008, Canada’s total government debt burden is the lowest in the G8.
International trade makes up a large part of the Canadian economy, particularly of its natural resources. In 2009, agricultural, energy, forestry and mining exports accounted for about 58% of Canada's total exports.[14] Machinery, equipment, automotive products and other manufactures accounted for a further 38% of exports in 2009.[14] In 2009, exports accounted for approximately 30% of Canada's GDP. The United States is by far its largest trading partner, accounting for about 73% of exports and 63% of imports as of 2009.[15] Canada's combined exports and imports ranked 8th among all nations in 2006.[16]
Canada has considerable natural resources spread across its varied regions. As an example, in British Columbia the forestry industry is of great importance, while the oil and gas industry is important in Alberta, Saskatchewan and Newfoundland and Labrador. Northern Ontario is home to a wide array of mines, while the fishing industry has long been central to the character of the Atlantic provinces, though it has recently been in steep decline. Canada has mineral resources of coal, copper, iron ore, and gold.
These primary industries are increasingly becoming less important to the overall economy. Only some 4% of Canadians are employed in these fields, and they account for 6.2% of GDP.[17] They are still paramount in many parts of the country. Many, if not most, towns in northern Canada, where agriculture is difficult, exist because of a nearby mine or source of timber. Canada is a world leader in the production of many natural resources such as gold, nickel, uranium, diamonds and lead. Several of Canada's largest companies are based in natural resource industries, such as EnCana, Cameco, Goldcorp, and Barrick Gold. The vast majority of these products are exported, mainly to the United States. There are also many secondary and service industries that are directly linked to primary ones. For instance one of Canada's largest manufacturing industries is the pulp and paper sector, which is directly linked to the logging industry.
The large reliance on natural resources has several effects on the Canadian economy and Canadian society. While manufacturing and service industries are easy to standardize, natural resources vary greatly by region. This ensures that differing economic structures developed in each region of Canada, contributing to Canada's strong regionalism. At the same time the vast majority of these resources are exported, integrating Canada closely into the international economy. Howlett and Ramesh argue that the inherent instability of such industries also contributes to greater government intervention in the economy, to reduce the social impact of market changes.[18]
Such industries also raise important questions of sustainability. Despite many decades as a leading producer, there is little risk of depletion. Large discoveries continue to be made, such as the massive nickel find at Voisey's Bay. Moreover the far north remains largely undeveloped as producers await higher prices or new technologies as many operations in this region are not yet cost effective. In recent decades Canadians have become less willing to accept the environmental destruction associated with exploiting natural resources. High wages and Aboriginal land claims have also curbed expansion. Instead many Canadian companies have focused their exploration and expansion activities overseas where prices are lower and governments more accommodating. Canadian companies are increasingly playing important roles in Latin America, Southeast Asia, and Africa.
The exploitation of renewable resources have raised concerns in recent years. After decades of escalating overexploitation the cod fishery all but collapsed in the 1990s, and the Pacific salmon industry also suffered greatly. The logging industry, after many years of activism, has in recent years moved to a more sustainable model.
U.S.A.
The economy of the United States is the world's largest national economy. Its nominal GDP was estimated to be nearly $14.7 trillion in 2010,[1] approximately a quarter of nominal global GDP.[15][16] Its GDP at purchasing power parity was also the largest in the world, approximately a fifth of global GDP at purchasing power parity.[15] The U.S. economy also maintains a very high level of output per capita. In 2010, it was estimated to have a per capita GDP (PPP) of $47,284, the 7th highest in the world. The U.S is the largest trading nation in the world. Its three largest trading partners as of 2010 are Canada, China and Mexico.
Historically, the economy of the United States has maintained a stable overall GDP growth rate, a low unemployment rate, and high levels of research and capital investment funded by both national and, because of decreasing saving rates, increasingly by foreign investors. It has been the world's largest national economy since the 1870s[17][18] and remains the world's largest manufacturer, representing 19% of the world's manufacturing output. In 2009, consumer spending, coupled with government health care spending constituted 70% of the American economy.[19] About 30% of the entire world's millionaire population reside in the United States (in 2009).[20] Furthermore, 34% of the world's billionaires are American (in 2011).[21][22] The US is also home to the world's largest stock exchange, the New York Stock Exchange. It also boasts the world's largest gold reserves and the world's largest gold depository, the New York Federal Reserve Bank. The United States is also home to 139 of the world's 500 largest companies, which is almost twice that of any other country.[23] A large contributor to the country's success has also been a very strong and stable currency. The US dollar holds about 60% of world reserves, as compared to its top competitor, the euro, which controls about 24%.
Since the 1960s, the United States economy absorbed savings from the rest of the world. The phenomenon is subject to discussion among economists. The US is by far the most heavily invested-into country in the world, with foreign investments made in the US measuring almost $2.4 trillion, which is more than twice that of any other country.[24] The US is also by far the largest investor in the world, with US investments in foreign countries totaling over $3.3 trillion, which is almost twice that of any other country.[25] Like other developed countries, the United States faces retiring baby boomers who have already begun withdrawing money from Social Security; however, the American population is young and growing when compared to Europe or Japan. The United States public debt is in excess of $14 trillion and continues to grow at a rate of about $5.48 billion each day by direct calculation between December 31, 2010 and July 31, 2011.[26][27] Total public and private debt was $50.2 trillion at the end of the first quarter of 2010, or 3.5 times GDP.[28] Domestic financial assets totaled $131 trillion and domestic financial liabilities totaled $106 trillion.[29] Due in part to the amount of both public and private investment, the economy of the United States is regarded as a type of mixed economy.
The American labor market has attracted immigrants from all over the world and in 2009 ranked 16th in terms of net migration rate. The United States is ranked fourth, down from first in 2008–2009 due to the economic crisis, in the Global Competitiveness Report.[30] The country is one of the world's largest and most influential financial markets, home to major stock and commodities exchanges like NASDAQ, NYSE, AMEX, CME, and PHLX.


Contents
Geography
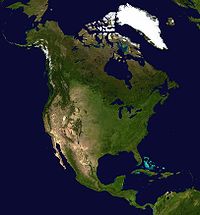 A satellite image of North America showing vegetation and land use. Note that most of Canada is covered in dark green boreal forest or brown tundra, whereas much of the United States is light green cropland.
Geography of U.S.A.
The land area of the contiguous United States is approximately 1,900 million acres (7,700,000 km2). Alaska, separated from the contiguous United States by Canada, is the largest state at 365 million acres (1,480,000 km2). Hawaii, occupying an archipelago in the central Pacific, southwest of North America, has just over 4 million acres (16,000 km2).[17] The United States is the world's third or fourth largest nation by total area (land and water), ranking behind Russia and Canada and just above or below China. The ranking varies depending on how two territories disputed by China and India are counted and how the total size of the United States is measured: calculations range from 3,676,486 square miles (9,522,055 km2)[18] to 3,717,813 square miles (9,629,091 km2)[19] to 3,794,101 square miles (9,826,676 km2).[1] Including only land area, the United States is third in size behind Russia and China, just ahead of Canada.[20] Satellite image showing topography of the contiguous United States
The coastal plain of the Atlantic seaboard gives way further inland to deciduous forests and the rolling hills of the Piedmont. The Appalachian Mountains divide the eastern seaboard from the Great Lakes and the grasslands of the Midwest. The Mississippi–Missouri River, the world's fourth longest river system, runs mainly north–south through the heart of the country. The flat, fertile prairie of the Great Plains stretches to the west, interrupted by a highland region in the southeast. The Rocky Mountains, at the western edge of the Great Plains, extend north to south across the country, reaching altitudes higher than 14,000 feet (4,300 m) in Colorado. Farther west are the rocky Great Basin and deserts such as the Mojave. The Sierra Nevada and Cascade mountain ranges run close to the Pacific coast. At 20,320 feet (6,194 m), Alaska's Mount McKinley is the tallest peak in the country and in North America. Active volcanoes are common throughout Alaska's Alexander and Aleutian Islands, and Hawaii consists of volcanic islands. The supervolcano underlying Yellowstone National Park in the Rockies is the continent's largest volcanic feature.[21] The bald eagle, national bird of the United States since 1782
The United States, with its large size and geographic variety, includes most climate types. To the east of the 100th meridian, the climate ranges from humid continental in the north to humid subtropical in the south. The southern tip of Florida is tropical, as is Hawaii. The Great Plains west of the 100th meridian are semi-arid. Much of the Western mountains are alpine. The climate is arid in the Great Basin, desert in the Southwest, Mediterranean in coastal California, and oceanic in coastal Oregon and Washington and southern Alaska. Most of Alaska is subarctic or polar. Extreme weather is not uncommon—the states bordering the Gulf of Mexico are prone to hurricanes, and most of the world's tornadoes occur within the country, mainly in the Midwest's Tornado Alley.[22]
The U.S. ecology is considered "megadiverse": about 17,000 species of vascular plants occur in the contiguous United States and Alaska, and over 1,800 species of flowering plants are found in Hawaii, few of which occur on the mainland.[23] The United States is home to more than 400 mammal, 750 bird, and 500 reptile and amphibian species.[24] About 91,000 insect species have been described.[25] The Endangered Species Act of 1973 protects threatened and endangered species and their habitats, which are monitored by the United States Fish and Wildlife Service. There are fifty-eight national parks and hundreds of other federally managed parks, forests, and wilderness areas.[26] Altogether, the government owns 28.8% of the country's land area.[27] Most of this is protected, though some is leased for oil and gas drilling, mining, logging, or cattle ranching; 2.4% is used for military purposes.[27]
Geography of Canada
Canada's abundance of natural resources is reflected in their continued importance in the economy of Canada. Major resource-based industries are fisheries, forestry, agriculture, petroleum products and mining.
The fisheries industry has historically been one of Canada's strongest. Unmatched cod stocks on the Grand Banks off Newfoundland launched this industry in the 16th century. Today these stocks are nearly depleted, and their conservation has become a preoccupation of the Atlantic Provinces. On the West Coast, tuna stocks are now restricted. The less depleted (but still greatly diminished) salmon population continues to drive a strong fisheries industry. Canada claims 12 nautical miles (22 km) of territorial sea, a contiguous zone of 24 nautical miles (44 km), an exclusive economic zone of 200 nautical miles (370 km) and a continental shelf of 200 nautical miles (370 km) or to the edge of the continental margin.
Forestry has long been a major industry in Canada. Forest products contribute one fifth of the nation's exports. The provinces with the largest forestry industries are British Columbia, Ontario and Quebec. Fifty-four percent of Canada's land area is covered in forest. The boreal forests account for four-fifths of Canada's forestland. Albertan grain elevators
Five per cent of Canada's land area is arable, none of which is for permanent crops. Three per cent of Canada's land area is covered by permanent pastures. Canada has 7,200 square kilometres (2,800 mi2) of irrigated land (1993 estimate). Agricultural regions in Canada include the Canadian Prairies, the Lower Mainland and interior plateau of British Columbia, the St. Lawrence Basin and the Canadian Maritimes. Main crops in Canada include flax, oats, wheat, maize, barley, sugar beets and rye in the prairies; flax and maize in Western Ontario; Oats and potatoes in the Maritimes. Fruit and vegetables are grown primarily in the Annapolis Valley of Nova Scotia, Southwestern Ontario, the Golden Horseshoe region of Ontario, along the south coast of Georgian Bay and in the Okanagan Valley of British Columbia. Cattle and sheep are raised in the valleys of British Columbia. Cattle, sheep and hogs are raised on the prairies, cattle and hogs in Western Ontario, sheep and hogs in Quebec, and sheep in the Maritimes. There are significant dairy regions in central Nova Scotia, southern New Brunswick, the St. Lawrence Valley, northeastern Ontario, southwestern Ontario, the Red River valley of Manitoba and the valleys of eastern British Columbia, on Vancouver Island and the Lower mainland.
Fossil fuels are a more recently developed resource in Canada, with oil and gas being extracted from deposits in the Western Canadian Sedimentary Basin since the mid 1900's. While Canada's crude oil deposits are fewer, technological developments in recent decades have opened up oil production in Alberta's Tar Sands to the point where Canada now has some of the largest reserves of oil in the world. In other forms, Canadian industry has long exploited large coal and natural gas reserves.
Canada's mineral resources are diverse and extensive. Across the Canadian Shield and in the north there are large iron, nickel, zinc, copper, gold, lead, molybdenum, and uranium reserves. Large diamond concentrations have been recently developed in the Arctic, making Canada one of the world's largest producers. Throughout the Shield there are many mining towns extracting these minerals. The largest, and best known, is Sudbury, Ontario. Sudbury is an exception to the normal process of forming minerals in the Shield since there is significant evidence that the Sudbury Basin is an ancient meteorite impact crater. The nearby, but less known Temagami Magnetic Anomaly has striking similarities to the Sudbury Basin. Its magnetic anomalies are very similar to the Sudbury Basin, and so it could be a second metal-rich impact crater.[8] The Shield is also covered by vast boreal forests that support an important logging industry.
Canada's many rivers have afforded extensive development of hydroelectric power. Extensively developed in British Columbia, Ontario, Quebec and Labrador, the many dams have long provided a clean, dependable source of energy.
Government
Taxation
Main articles: Taxation in Canada and Taxation in the United States The Canadian 50 Dollar Bill
 The American 50 Dollar Bill
In Canada total tax and non-tax revenue for every level of government equals about 38.4% of GDP,[1] compared to the U.S. rate of 28.2%.[2]
A significant portion of this tax differential is due to spending differences between the two countries. While the US is running deficits of about 4% of GDP,[3] Canada has consistently posted a budget surplus of around 1% of GDP.[4] Considered in a revenue-neutral context, the differential is much smaller - Canada's total governmental spending was about 36% of GDP[5] vs. 31% in the US.[3] In addition, caution must be used when comparing taxes across countries, due to the different services each offers. Whereas the Canadian healthcare system is 70% government-funded, the US system is just under 50% government-funded (mostly via Medicare and Medicaid); adding the additional healthcare-spending burden to the above figures to obtain comparable numbers (+3% for Canada, +7% for the US) gives adjusted expenditures of 38–39% of GDP for each of the two nations.
The taxes are applied the same as well. Canada's income tax system is more heavily biased against the highest income earners, thus while Canada's income tax rate is higher on average, the bottom fifty percent of the population is roughly taxed the same on income as in the United States. However, Canada has a national goods and services tax of 5% on most purchases, while the U.S. federal government does not, increasing the tax burden on Canadian low-income earners due to the proportional nature of a sales tax. Canadian GST does not tax food and other essentials and a GST rebate for low-income earners mitigates regressiveness.[6]
In addition to the 5% GST levied on most purchases, some Canadians also pay a provincial sales tax at a rate that varies by province and can be as high as 10%. In Ontario, for example, where the provincial sales tax (PST) is 8%, consumers must pay a total of 13% sales tax on top of the purchase price. (It should be noted that Ontario has eliminated both the PST and GST, replacing them with harmonized sales tax, or HST, of 13%, which changes the sales tax on some items.) There are some purchases which are PST exempt, such as children's clothing. In the U.S., most states impose a sales tax, and cities and counties are often permitted to levy taxes as well, which can exceed 10% on purchases but realistically average at about 6-8%. Five U.S. states do not have any sales tax imposed.[7] The Canadian province of Alberta and all three territories have no provincial or territorial sales tax on top of the GST.
Government Spending
Government spending at all levels (federal, state/provincial and local) has traditionally been higher in Canada than the United States. In Canada, government spending as a percentage of GDP peaked at 53% in 1992. Since 1992 spending has steadily declined in Canada to just below 40 percent in 2008.[8]
Spending in the United States fluctuated narrowly around 34-38 percent of GDP over the same period.[9] However, starting in 2008 US spending has turned sharply upwards to reach an estimated 42.7% of GDP in 2009[10] from 39% in 2008. Spending is expected to reach 45% of GDP in 2011,[11] and stabilize at that level.
Social programs
For its higher taxes Canada has a larger system of social programs than the United States. This includes having a national broadcaster in the CBC, a largely government-funded health care system, and having all major universities receive partial government funding. The United States, however, does have most of its major universities subsidized by state government. The US also has two national public broadcasters which receive partial government funding, PBS (television) and NPR (radio).
The greatest difference in social programs is in health care. Contrary to popular belief, the U.S. Government spends as much on health care, 7% of GDP, as the Canadian government does,[12] and total healthcare spending is much higher - 14.6% of GDP in the US vs. 10% in Canada.[13] Canadians, however, receive comparable care to those Americans who receive treatment, and result measures, such as life expectancy and infant mortality are better in Canada. The Canadian health care system is said by some also to be attractive to employers, as in Canada health care is mostly paid through employee income taxes, while in the United States most companies choose to extend health benefits to full-time employees. Many employers in Canada do offer employees some additional medical coverage, for non-necessary treatments, and for pharmaceuticals which are not universally-covered the government-paid health insurance system. The most common complaint regarding the Canadian system are the long lines and waiting periods that have appeared for minor and non-life threatening procedures over the last 15 years, since the introduction of widespread cuts to public funding. Separately, a number of medical tests and screenings are not covered (or due to increasing costs, are no longer covered) by the Canadian health system, forcing patients to pay for these services out of their own pockets. For these reasons, some relatively wealthy Canadians undergo treatment at private healthcare facilities at their own expense, either in Canada, in India, or in other nations[14] to avoid waiting for medical treatment, joining "medical tourists" from many nations, including the US.[14] Despite these sporadic problems, Canada's healthcare performance is generally on par with, or better than, the US.[citation needed] Furthermore, healthcare coverage is universal for Canadians.
Anti-trust
Main articles: Canadian competition law and United States antitrust lawThe United States has since the Sherman Anti-Trust Act been strongly opposed to monopolies. In Canada this has been far less of an issue, and Canada has never had rigorously enforced rules against monopolization, and in certain situations the government has even encouraged monopolies. However, the Canadian government is more willing to interfere in the operations of large, integrated firms where they appear to be acting against the public interest, offsetting in part one reason that American law prevents large-scale monopolization.
Fiscal and monetary policy
Canada is generally forced to follow American monetary policy quite closely, any large difference in interest rates could quickly lead to large problems for the Canadian economy. The U.S. Federal Reserve and the Bank of Canada both staunchly believe in fighting inflation while neither aggressively pursue policies of full employment. One difference that has emerged recently is that while Canada is still hewing closely to the balanced budgets policies of the 1990s the United States has moved into a heavy deficit, a policy both countries followed in the 1970s and 1980s.
Market size
One of the most important differences historically between Canada and the United States was the size of the two markets. When both nations had high tariffs the two countries did not have a unified market. Canada's smaller market led to higher prices and greater inefficiency.
A good example of this is the automobile industry, which can be clearly demarcated into two periods: before and after the free trade creating Auto Pact of 1969. Before this, Canada had its own production lines creating each of the models that would be sold in Canada. These branch plant factories would only make small production runs of each vehicle, requiring frequent, and expensive retoolings. The factories would also generally be smaller. Fewer varieties were available to Canadian consumers and prices were generally higher. However, these cars were almost all still made by American companies. After the Auto Pact, the industry was transformed as a unified North American market was created. The Canadian factories were rebuilt to be much larger, but to make only one model that would be sold in both countries creating large economies of scale. The prices of cars fell in Canada as wages and total employment in the automobile sector increased.
After the Second World War tariffs between the two countries gradually fell, with full free trade being established by the 1988 Canada-United States Free Trade Agreement. Some industries are still protected, however. These are mostly perceived as sensitive areas such as cultural industries including publishing, television, and newspapers, all of which have stringent foreign ownership rules. Other areas such as the transport industry are also protected with Canadian control of the airlines and trains being viewed as in the national interest.
This tends to create far more monopolies in Canada. For instance the air travel industry in Canada until recently was dominated by a single airline, Air Canada. Canada has long had to make a trade-off between monopolization and efficiency which the United States has not. The United States can support a number of airlines that are big enough to operate efficiently, and still have a competitive market (although in recent years the competitiveness of the major US airlines declined sharply). Canadians are forced to choose between small inefficient airlines that would be competitive, or monopolistic airlines that will generate their own inefficiency.
Banking
Canada and the United States have long had very different banking systems. The United States' was copied from England's, while Canada's was taken from Scotland. The United States traditionally has had a plethora of banks, some with very few branches. The U.S. system continues to support the creation of numerous small banks through both government-sponsored institutions like the Federal Home Loan Banks and similar non-government entities like Bankers' bank, that does not exist in markets like Canada. This has led to a more competitive but less stable system, with many thousands of banks having collapsed during U.S. history. Canada has always had far fewer banks per capita, but the banks have been larger and quickly expanded nationwide. Canadian banks have many branches and distributed assets and Canada has only had one major bank, the Home Bank, collapse in its history. The Glass–Steagall Act and other laws and regulations prevented U.S. banks from becoming too large. Changes allowed U.S. banks to grow and the Glass–Steagall Act was repealed in 1999. This concentration of banks in Canada relative to the U.S. has continued to this day. In 2002 in Canada the six largest banks controlled 90 percent of Canadian domestic banking assets, while the five largest U.S. banks controlled only 9.7 percent of their domestic assets.
There are several subsidies in the U.S. system that do not exist in Canada. In terms of direct impact to consumers, mortgage interest is a tax deductible in the U.S. (a market distortion designed to encourage home ownership), but is not in Canada. The U.S. also indirectly subsidizes mortgages through a plethora of government sponsored enterprises. The U.S. entities do much more than provide mortgage insurance, and use their own huge balance sheets to purchase mortgages. The Canada Mortgage and Housing Corporation historically was mainly limited to providing mortgage insurance, although now facilitates funding of mortgages also through the Canada Mortgage Bond program, which has also grown to be quite large.
Canada's banks have traditionally been fierce competitors internationally, though today America's largest banks have a more significant presence overseas. In part the history of this situation is rooted in Canada's smaller market. For Canadian banks international exchange was always a central concern. For American banks domestic banking was paramount. In the 1920s in the American economic centre of New York Canadian banks dominated the international banking sector due to greater expertise and focus. Thus Canadian banks came to have far wider spread networks. Much of the banking system in the West Indies is controlled by the Canadian banks. Canadian banks also have far more of a presence in the United States than American firms do in Canada. In part this is because American firms cannot buy Canadian banks, but Canadian banks have, at times, been able to buy American ones. Since the large Canadian banks already operated nationwide chains of a thousand or more branches, they find it relatively easy to integrate smaller chains of American banks into their systems.
In recent years this advantage has disappeared as American banks have also grown substantially in size and today have many branches, and the large American banks are now operating over 2000 branches each. In fact, the ten largest banks in North America today are all U.S.-based. Overseas, American banks have a larger presence than Canadian banks. Only Royal Bank of Canada's RBC Capital Markets division has a global scale that even approaches that of the U.S. investment banks.
Until recently, Canadian banks had historically been far less strictly regulated than their American counterparts. Canadian banks had, until the Gramm-Leach-Bliley Act in 1999, been freer to participate in the financial planning and insurance industries than their American counterparts. In the 1980s and 1990s, the large Canadian banks acquired almost all significant trust and brokerage companies in Canada. They also started their own mutual fund and insurance businesses. As a result, Canadian banks broadened out to become supermarkets of financial services, a trend that has started later in the U.S. market. The average U.S. bank is a domestic banking operation. The large Canadian banks are financial conglomerates, with large domestic Canadian banking operations.
Bank regulation in the United States is highly fragmented compared to Canada which has only OSFI as the bank regulator (although credit unions are provincially regulated). In the U.S., a bank's primary regulator could be the Federal Reserve Board, the Office of the Comptroller of the Currency, the Office of Thrift Supervision, or any one of 50 state regulatory bodies, depending on the charter of the bank. And within the Federal Reserve Board, there are 12 districts with 12 different regulatory staffing groups. The U.S. is also one of the most highly regulated banking environments in the world; however, many of the regulations are not safety and soundness related, but are instead focused on privacy, disclosure, fraud prevention, anti-money laundering, anti-terrorism, anti-usury lending, and promoting lending to lower-income segments. Even individual cities enact their own financial regulation laws (for example, for usury lending). Canadian banks had not faced laws against usury, or interest guarantees on deposits. Return on equity for Canadian banks were generally comparable to U.S. banks (with return on assets lower, but with Canadian banks using more leverage to compensate).
Credit unions in Canada are tax-paying entities, while they have been tax-exempt in the U.S. However, as restrictions on the size of credit unions in the U.S. have eased, the American Bankers Association has been lobbying to have credit unions taxed to level the playing field.
Prices
In Canada prices have long tended to be higher. This is partly because of structural issues in Canada such as low population density and harsher weather, and partly due to Canada's tax system, which depends more heavily on sales taxes relative to income taxes than the US. This has contributed to phenomena such as cross-border shopping. Since the early 1990s this has not been the case, as the Canadian dollar had fallen low enough that it more than made up for price differences. Today prices are somewhat lower in Canada for at least one item: the Big Mac Index shows that in January 2006 a Big Mac cost $3.15 in the States and only $3.01 in Canada [1] (both figures in USD). In October, 2007 a strong Canadian dollar rose to parity with a weak American dollar, benefiting Canadian travelers and consumers. However, this was not favorable to Canadian manufacturers and exporters who do most of their business south of the border. As the economic conditions decayed in 2008, a flight to safety in the American dollar and lower prices for Canadian commodities reversed some of the growth in the Canadian dollar relative to the American dollar.
Fuel prices have always been higher in Canada, even though Canada is a net exporter of energy. This is because Canada, unlike many oil producers, does not heavily subsidize fuel. Prices are based on the world market price.
Productivity
Canadian workers are estimated to be 82% as productive per hour as their American counterparts.[15] Because American workers also tend to work longer hours, the productivity gap per worker becomes even greater. The industries with the largest productivity advantages for the U.S. are the manufacturing (particularly electronics and computer), finance, and service sectors. Industries where Canada is more productive than the U.S. are the construction and natural resources sectors with Canadian workers achieving 129% relative productivity. [16].
The productivity gap had been even larger in the 1950s but the difference has been narrowing, aided by the elimination of the smaller market problem through free trade. The gap was still closing somewhat in the 1980s but at a much slower pace than in the 1960s. From 1961 to 1973 labour productivity rose annually by 3.3 percent in Canada and 1.7 percent in the United States. From 1973 to 1995 productivity growth was 1.1% in Canada and 0.8% in the United States.[17]
The productivity gap began to widen again in the 1990s, particularly in the manufacturing sector. By 2000, this was called Canada's "Excellence Gap" by the Chief Economist of Canadian Manufacturers & Exporters.[18] The United States has the second-highest productivity of the G8 countries,[19] while Canada's is 5th based on the 1997 estimate.[20]
Five main reasons for the productivity gap: the lower capital intensity of economic activity in Canada; an innovation gap in Canada relative to the United States; Canada’s relatively underdeveloped high-tech sector; less developed human capital in Canada in terms of proportionately fewer university graduates and scientists and engineers in research and development; and more limited economies of scale and scope in Canada.
Organized Labour
Both Canada and the U.S. follow the Wagoner Act model of regulating trade unions and collective bargaining, though legislation regulating organized labour principally falls under provincial jurisdiction in Canada. This North American model differs significantly from patterns of organized labour found in other developed countries.
Unemployment
For several decades Canada typically had reported its unemployment rate as somewhat higher than the US rate. For example, in June 2008 the reported unemployment in the US was 5.5 percent and 6.1% in Canada. However, a closer examination reveals that the two countries measure the unemployment rate differently. Craig Riddell, a University of British Columbia economist, found that a 0.9% difference was caused by the differing measurement systems.[21] Statistics Canada has also acknowledged this, and it now publishes a second unemployment rate using the same methodology as the Americans. Using the American methodology, the June 2008 Canadian unemployment rate was 5.3%, which was 0.2% lower than the American rate.[22]
Prior to the identification of the difference in methodologies, some politicians claimed that higher income taxes, restrictive labour laws, unions, universal healthcare, and greater unemployment benefits in Canada were causing a higher actual unemployment rate. However, when unemployment insurance and welfare were sharply cut in many parts of Canada during the 1990s there was little gain in employment relative to the Americans. Others attempted to explain the reported difference in terms of the large number of seasonal workers in trades such as fishing and logging who are unemployed for a portion of the year.
Balance of trade
While the United States has in recent years had a large trade deficit, Canada had for several decades maintained a trade surplus, which turned to a deficit since 2006.[23] The Canadian surplus had been almost entirely due to trade with the United States. Canada has trade deficits with Europe and Asia, just as the Americans do. In 2005, Canada exported about $109 billion worth of goods more than they imported from the U.S. With the rest of the world, Canada had a trade deficit of $47 billion creating an overall surplus of some $62 billion.[24]
Income
Although wealth is more highly concentrated in the U.S., the median (50th percentile) worker has essentially the same purchasing power in each nation. In terms of purchasing power parity, the most recent statistics from the IMF has Canada (US $35,494) lower than that in the United States (US $43,444).[25]
In the late 1990s, the GDP gap widened. In this period, GDP increased by 5% annually in the United States, and 2% in Canada. Earlier, it had been narrowing between 1961 and 1995. However, it was closing at a much faster rate in the 1960s than the early 1990s. From 1961 to 1973, real GDP grew at an average annual rate of 5.5% in Canada and 4.0% in the United States. From 1973 to 1995 it was 2.6% in Canada and 2.3% in the USA. [2] Canada was not hit as hard by the economic downturn in 2001, however, so cumulative growth in real GDP has been almost exactly the same amount in each country over the last 15 years.
Standard of living
The United Nations Human Development Index ranks the United States (fourth) higher than Canada (eighth)[26]. Other independent groups, such as the Economist have ranked each of Canada's four largest cities as better places to live than any American city. In their 2005 ranking, Toronto, Montreal, Vancouver and Ottawa ranked within the top 10 livable cities while the highest ranked American cities, Cleveland and Pittsburgh, were tied at 26th place.[27]
Canada ranks higher than the U.S. in statistics such as life expectancy (80.22 years in Canada versus 77.85 in the U.S.) and infant mortality (4.75 Canadian deaths per 1000 versus 6.50 in the States). Both countries rank highly with 99% literacy rates. The United States has more major consumer goods per capita than Canada. For instance, while Canada had only 297 computers per 1000 people in 1996, the United States had 403.
Average income is slightly higher in the United States. However, the gap in median incomes is minor. In terms of racial disparity, United States African-Americans and Hispanics have a lower standard of living than the rest of the population; in Canada, Aboriginal peoples and Black Canadians are disproportionately likely to live in poverty, although these groups represent 25% of the US population and only 6% of Canada's. In both countries, recent immigrants tend to have lower earnings than more established residents. Canada's French-Canadians also used to be a poorer group, but since the Quiet Revolution in the 1960s this has been partially remedied.
The United States measures poverty, while Canada does not have an official measure (see Poverty in Canada#Measures of poverty in Canada), although Statistics Canada measures something called the Low-Income Cutoffs, the statistical agency repeatedly states that this is not a poverty measure (it is an income dispersion measure like the Gini coefficient). In the United States the poverty line is set at triple the "minimum adequate food budget." When a common measure is used, such as that of the Luxembourg Income Study, the United States has higher rates. The LIS reports that Canada has a poverty rate of 15.4% and the United States 18.7%. [3] In both countries lower incomes are found in those most affected by poverty include single-parent families and single elderly people. In addition, because of social policies such as universal healthcare, the poverty stricken in Canada maintain a higher quality of life.
It may be said the cost of absorbing lower skilled, poorer workers in the US skews comparison studies downward for the United States[28] (see also Economic impact of illegal immigrants in the United States). In recent years, what otherwise would have been a reduction in the low-income cutoff, was more than offset by the impact of immigration. According to a 2003 study by Statistics Canada "The rise in the low-income rates in the three major Canadian cities, and in Ontario and B.C. during the 1990s in particular, was largely concentrated among the immigrant population. Basically, low-income rates have been falling over the past two decades among the Canadian born, and rising among immigrants."[29] A more recent January 2007 study by Statistics Canada explains that the low-income rates of new immigrants has deteriorated by yet another significant amount from 2000 to 2004[30] (see also Economic impact of immigration to Canada).
Income
Median household income levels in the U.S. and Canada are roughly the same.
Country or region Median household income national currency units Year PPP rate (OECD) Median household income (PPP) Switzerland[31] (gross) 109,236 CHF, $100,387 2008 1.68375 $64,877 US Connecticut[32] 66,452 USD 2010 1.00 $66,452 US California[32] 54,459 USD 2010 1.00 $54,549 Canada[33] 68,410 CAD 2009 1.254989 $54,510 United States[32] 49,445 USD 2010 1.00 $49,445 Switzerland[31] (after taxes and health insurance) 77,580 CHF, $71,296 2008 1.640256 $47,297 Australia[34] 66,890 AUD 2007/2008 1.5162805 $44,115 New Zealand[35] 63,867 NZD 2008/2009 1.5881895 $40,214 United Kingdom[36] 24,700 GBP 2004 0.632 $39,000 Israel[37] 107,820 ILS 2006 2.90 $37,000 US Mississippi[32] 35,076 USD 2009 1.00 $35,076 Ireland 35,410 EUR 2005 1.02 $35,000 UK Scotland[38] 21,892 GBP 2005 0.649 $34,000 South Korea[39] 26,640,000 KRW 2009 804.718137 $33,105 Hong Kong[40] 186,000 HKD 2005 5.96 $31,000 Singapore[41] 45,960 SGD 2005 1.55 $30,000 Home ownership
While home ownership rates in both countries are very high compared to worldwide (or even developed countries), the United States has a slightly higher level of home ownership at 68.9% [4] versus 67% for Canada [5]. This number has converged in recent years.[citation needed]
See also
References
- ^ "Index of Economic Freedom 2009: Canada". 2009. http://www.heritage.org/index/country/canada.
- ^ "Index of Economic Freedom 2009: United States". 2009. http://www.heritage.org/index/country/UnitedStates.
- ^ a b Total Revenues From All Levels Of Government Drop To Lowest Share Of Economy Since 1968, 1/15/04
- ^ "CBC News Indepth: Budget". CBC News. http://www.cbc.ca/news/background/budget/.
- ^ Consolidated government revenue and expenditures
- ^ Fellows, C. Michael et al. Economic Issues: A Canadian Perspective. (Toronto: McGraw-Hill Ryerson, 1997) 217.
- ^ http://www.taxadmin.org/fta/rate/sales.pdf
- ^ Reducing the size of government
- ^ Great Right North
- ^ Government Spending Details
- ^ Government Spending Details
- ^ Rising Health Costs U.S. health care: expensive and less effective at keeping people healthy
- ^ "CBC News Indepth: Health Care". CBC News. http://www.cbc.ca/news/background/healthcare/priceofcare.html.
- ^ a b "CBC News Indepth: HEALTH CARE". CBC News. http://www.cbc.ca/news/background/healthcare/medicaltourism.html.
- ^ Measuring the Canada-U.S. Productivity Gap: Industry Dimensions
- ^ Measuring the Canada-U.S. Productivity Gap: Industry Dimensions
- ^ http://www.imf.org/external/pubs/ft/fandd/1997/12/pdf/salgado.pdf
- ^ Microsoft Word - Excellence Gap.DOC
- ^ New Page 2
- ^ http://strategis.ic.gc.ca/pics/pr/livstand.pdf
- ^ Microsoft Word - Can-US unem 2003.doc
- ^ Scoffield, Heather. "Unemployment levels fall below U.S. rate" The Globe and Mail. June 6, 2008
- ^ Merchandise trade of Canada, balance of payments basis, seasonally adjusted — Constant dollars, 2002
- ^ Imports, exports and trade balance of goods on a balance-of-payments basis, by country or country grouping. Statistics Canada.
- ^ List of countries by GDP (PPP) per capita
- ^ "HDR_2010_EN_Table1". http://hdr.undp.org/en/media/HDR_2010_EN_Table1.pdf.
- ^ "Vancouver is 'best place to live'" BBC News, Tuesday, 4 October 2005
- ^ The Impact of Immigration on Labour Markets in Canada, Mexico, and the United States, Statistics Canada, Update on Family and Labour Studies, May 2007, URL Accessed 26 May 2007
- ^ The rise in low-income rates among immigrants in Canada, Analytical Studies Branch research paper series, Statistics Canada, June 2003, URL accessed 20 September 2006
- ^ Chronic Low Income and Low-income Dynamics Among Recent Immigrants, Statistics Canada, January 2007, URL accessed 30 January 2007
- ^ a b "Household income and expenditure 2008". http://www.bfs.admin.ch/bfs/portal/en/index/themen/20/02/blank/key/einkommen0/niveau.html. Retrieved 2010-08-23.
- ^ a b c d "Median Household Income for States by state 1984-2010". http://www.census.gov/hhes/www/income/data/historical/household/2010/H08_2010.xls.
- ^ "Median total income, by family type, by province and territory". http://www40.statcan.ca/l01/cst01/FAMIL108A-eng.htm.
- ^ 1.2'!L21 "Household income and income distribution". http://www.ausstats.abs.gov.au/Ausstats/subscriber.nsf/0/EE0E4B902276B5BCCA25761700191F85/$File/65230_detailed_tables_2007-08.xls#'Table 1.2'!L21. Retrieved 2010-07-17.
- ^ "New Zealand income survey showing median household income". http://www.stats.govt.nz/products-and-services/hot-off-the-press/nz-income-survey/new-zealand-income-survey-jun-07-qtr-hotp.htm?page=para002Master. Retrieved 2007-10-04.
- ^ "UK parliament discussion showing median household income". http://www.parliament.the-stationery-office.co.uk/pa/cm200506/cmhansrd/cm060719/text/60719w1831.htm. Retrieved 2006-12-31.
- ^ "israeli median household income, 2006". http://www1.cbs.gov.il/www/publications/households06/pdf/t03_1.pdf. Retrieved 2008-01-15.
- ^ "Scottish Economic Statistics 2007". http://www.scotland.gov.uk/Publications/2007/07/18083820/71. Retrieved 2007-10-09.
- ^ "(Korean) [통계로 읽는 경제 내 월급이 중간수준도 안돼? … `평균의 함정`에 빠졌네"]. http://www.hankyung.com/news/app/newsview.php?aid=2010122612051. Retrieved 2010-12-27.
- ^ "Hong Kong median household income, 2005". http://www.adb.org/Documents/Books/ADO/2005/hkg.asp. Retrieved 2007-01-19.
- ^ "Singapore median household income, 2005". http://www.singstat.gov.sg/keystats/annual/ghs/r2/chap3.pdf. Retrieved 2007-01-19.
Categories:- Canada–United States relations
- Economy of Canada
- Economics comparisons


Wikimedia Foundation. 2010.