- Copeland Council election, 2011
-
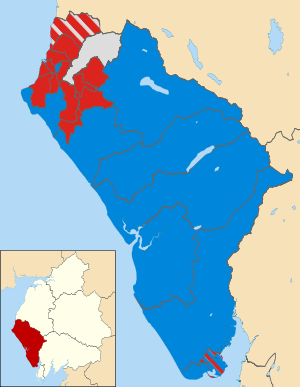 Map of the results of the 2011 Copeland council election. Labour in red, Conservatives in blue and independent in white.
The 2011 Copeland Council election took place on 5 May 2011 to elect members of Copeland Borough Council in Cumbria, England. The whole council was up for election and the Labour party stayed in overall control of the council.[1]
Contents
Background
At the last election in 2007 Labour won 31 seats, compared to 19 Conservatives and 1 independent.[2] However between 2007 and 2011 Labour councillors Brian Dixon and Sam Meteer quit the party to sit as independents.[3][4]
A total of 95 candidates stood in the election for the 51 seats being contested.[2] These were 45 Labour, 37 Conservative, 4 independent, 4 British National Party, 3 Green Party and 2 Liberal Democrats.[2] Meanwhile 12 sitting councillors stood down at the election.[2]
Election result
The results saw Labour hold control of the council after winning 34 of the 51 seats, up 5 on the situation before the election and 3 more than at the 2007 election.[5] The Conservatives dropped 4 seats to have 15 councillors, while 2 independents were elected in Arlecdon and Distington.[5] Overall turnout at the election was 40.98%.[6]
Labour's biggest gains came in Bransty ward in Whitehaven, where they gained all 3 seats from the Conservatives.[7] This included defeating the Conservative parliamentary candidate for Copeland at the 2010 general election, Chris Whiteside.[7] Labour also picked up one seat in Newtown from the Conservatives and defeated the independent, former Labour, councillor Sam Meteer in Egremont North.[5]
Copeland Local Election Result 2011[8] Party Seats Gains Losses Net gain/loss Seats % Votes % Votes +/- Labour 34 5 0 +5 66.7 56.7 23,697 +3.6% Conservative 15 0 4 -4 29.4 36.6 15,294 -7.0% Independent 2 0 1 -1 3.9 3.9 1,649 +2.3% BNP 0 0 0 0 0 1.3 541 +1.3% Liberal Democrat 0 0 0 0 0 0.8 342 -0.9% Green 0 0 0 0 0 0.6 253 +0.6% Ward results
Arlecdon[8][5] Party Candidate Votes % ±% Independent Joseph Sunderland 359 80.5 +26.5 Conservative Marie Simpson 87 19.5 -4.3 Majority 272 61.0 +30.7 Turnout 446 37.3 Independent hold Swing Beckermet (2)[8][5] Party Candidate Votes % ±% Conservative Yvonne Clarkson 681 Conservative John Jackson 536 Labour Jim Hewitson 340 Turnout 1,557 46.3 Conservative hold Swing Conservative hold Swing Bootle[8][5] Party Candidate Votes % ±% Conservative Keith Hitchen 453 83.1 Labour Anne Bradshaw 92 16.9 Majority 361 66.2 Turnout 545 51.6 Conservative hold Swing Bransty (3)[8][5] Party Candidate Votes % ±% Labour Dave Smith 803 Labour Gillian Troughton 801 Labour Phil Greatorex 710 Conservative Brian O'Kane 653 Conservative Christopher Whiteside 649 Conservative Allan Mossop 642 Turnout 4,258 40.4 Labour gain from Conservative Swing Labour gain from Conservative Swing Labour gain from Conservative Swing Cleator Moor North (3)[8][5] Party Candidate Votes % ±% Labour Joan Hully 723 Labour Bill Southward 688 Labour Hugh Branney 680 Conservative Alexander Carroll 280 BNP Daniel Verity 129 Turnout 2,500 33.0 Labour hold Swing Labour hold Swing Labour hold Swing Cleator Moor South (2)[8][5] Party Candidate Votes % ±% Labour David Riley 576 Labour Dave Banks 502 Conservative David Walker 118 BNP Colin Boyton 88 Turnout 1,284 33.7 Labour hold Swing Labour hold Swing Distington (3)[8][5] Party Candidate Votes % ±% Labour John Bowman 614 Labour Jackie Bowman 598 Independent Brian Dixon 486 Labour Simon Leyton 431 Liberal Democrat Frank Hollowell 284 Conservative Sheena Gray 272 Turnout 2,685 39.1 Labour hold Swing Labour hold Swing Independent hold Swing Egremont North (3)[8][5] Party Candidate Votes % ±% Labour Sam Pollen 714 Labour Elaine Woodburn 685 Labour Karl Connor 635 Independent Sam Meteer 509 Conservative John Holmes 371 Turnout 2,914 40.0 Labour hold Swing Labour hold Swing Labour gain from Independent Swing Egremont South (3)[8][5] Party Candidate Votes % ±% Labour Mike McVeigh 803 Labour Lena Hogg 694 Labour Carole Woodman 676 Conservative Elizabeth Hutson 398 Conservative Graham Hutson 374 Independent Nicola Hewitt 295 Turnout 3,240 43.3 Labour hold Swing Labour hold Swing Labour hold Swing Ennerdale[8][5] Party Candidate Votes % ±% Conservative Bob Salkeld 265 59.3 +1.0 Labour Cam Ross 96 21.5 +4.4 Liberal Democrat Mike Minogue 58 13.0 -11.6 Green Andy Crow 28 6.3 +6.3 Majority 169 37.8 +4.1 Turnout 447 54.3 Conservative hold Swing Frizington (2)[8][5] Party Candidate Votes % ±% Labour Peter Connolly 489 Labour Jon Downie 355 Conservative Hazel Dirom 255 Turnout 1,099 37.3 Labour hold Swing Labour hold Swing Gosforth[8][5] Party Candidate Votes % ±% Conservative Alan Jacob 478 77.5 +6.5 Labour Bernard Kirk 139 22.5 -6.5 Majority 339 54.9 +12.9 Turnout 61.7 46.7 Conservative hold Swing Harbour (3)[8][5] Party Candidate Votes % ±% Labour John Kane 913 Labour Henry Wormstrup 746 Labour Jeanette Williams 730 Conservative Martin Barbour 468 Conservative Dorothy Wonnacott 447 Conservative Graham Roberts 440 Turnout 3,744 40.9 Labour hold Swing Labour hold Swing Labour hold Swing Haverigg[8][5] Party Candidate Votes % ±% Conservative Doug Wilson 282 55.6 +14.5 Labour Carl Carter 225 44.4 +17.9 Majority 57 11.2 +2.6 Turnout 507 48.2 Conservative hold Swing Hensingham (3)[8][5] Party Candidate Votes % ±% Labour Geoff Garrity 729 Labour Norman Williams 653 Labour Margarita Docherty 619 Conservative Mary Lomas 302 Turnout 2,303 33.8 Labour hold Swing Labour hold Swing Labour hold Swing Hillcrest (2)[8][5] Party Candidate Votes % ±% Conservative Stephen Haraldsen 567 Conservative Alistair Norwood 518 Labour John Wooley 360 Turnout 1,445 45.7 Conservative hold Swing Conservative hold Swing Holborn Hill (2)[8][5] Party Candidate Votes % ±% Conservative Fred Gleaves 398 Labour Jack Park 360 Conservative Jane Micklethwaite 308 Labour Denise Burness 259 Green Neil Wilson 73 Turnout 1,398 41.9 Conservative hold Swing Labour hold Swing Kells (2)[8][5] Party Candidate Votes % ±% Labour George Clemnts 508 Labour Alan Holliday 399 Conservative Glenn Gray 199 Turnout 1,106 37.4 Labour hold Swing Labour hold Swing Millom Without[8][5] Party Candidate Votes % ±% Conservative Gilbert Scurrah 386 62.3 Green Lynette Gilligan 152 24.5 Labour Karon Carter 82 13.2 Majority 234 37.7 Turnout 620 52.5 Conservative hold Swing Mirehouse (3)[8][5] Party Candidate Votes % ±% Labour Anne Faichney 775 Labour Peter Kane 711 Labour Paul Whalley 583 Conservative Jim King 225 BNP George Benson 194 Turnout 2,488 32.7 Labour hold Swing Labour hold Swing Labour hold Swing Moresby[8][5] Party Candidate Votes % ±% Labour Geoff Blackwell 243 55.6 +1.3 Conservative Brigid Whiteside 194 44.4 -1.3 Majority 49 11.2 +2.5 Turnout 437 40.8 Labour hold Swing Newtown (3)[8][5] Party Candidate Votes % ±% Labour John Fallows 725 Conservative Francis Heathcote 613 Conservative Fee Wilson 480 Conservative Brian Crawford 432 Turnout 2,250 43.0 Conservative hold Swing Conservative hold Swing Labour gain from Conservative Swing Sandwith (2)[8][5] Party Candidate Votes % ±% Labour Peter Stephenson 373 Labour Peter Tyson 352 Conservative Adrian Davis-Johnson 131 BNP Malcolm Southward 130 Conservative John Dirom 104 Turnout 1,090 35.7 Labour hold Swing Labour hold Swing Seascale (2)[8][5] Party Candidate Votes % ±% Conservative David Moore 935 Conservative Eileen Eastwood 878 Labour Wendy Skillicorn 292 Turnout 2,105 54.9 Conservative hold Swing Conservative hold Swing St Bees[8][5] Party Candidate Votes % ±% Conservative Ian Hill 475 68.7 -4.7 Labour Alan Alexander 216 31.3 +4.7 Majority 259 37.5 -9.4 Turnout 691 51.7 Conservative hold Swing References
- ^ "England council elections". BBC News Online. http://www.bbc.co.uk/news/special/election2011/council/html/16ue.stm. Retrieved 25 July 2011.
- ^ a b c d Clarke, Andrew (15 April 2011). "Major shake-up expected after elections". The Whitehaven News. http://www.whitehavennews.co.uk/news/major-shake-up-expected-after-elections-1.827694?referrerPath=/whitehaven_news_headlines_1_60007. Retrieved 26 July 2011.
- ^ Whittle, Julian (10 September 2009). "Coupland councillor claims Labour party 'intimidation'". News and Star. http://www.newsandstar.co.uk/news/copeland_councillor_claims_labour_party_intimidation_1_610047?referrerPath=home. Retrieved 26 July 2011.
- ^ "Labour councillor 'crosses the floor'". Cumbria Life. 15 April 2009. http://www.cumbrialife.co.uk/labour-councillor-crosses-the-floor-1.541413?referrerPath=2.1817. Retrieved 26 July 2011.
- ^ a b c d e f g h i j k l m n o p q r s t u v w x y z aa ab Irving, Alan (12 May 2011). "Labour keeps its hands on reins at Copeland council". The Whitehaven News. http://www.whitehavennews.co.uk/news/labour-keeps-its-hands-on-reins-at-copeland-council-1.836488?referrerPath=pictures/slideshow-galleries. Retrieved 26 July 2011.
- ^ "Copeland". North-West Evening Mail. 9 May 2011. http://www.nwemail.co.uk/home/copeland-1.834067?referrerPath=home. Retrieved 26 July 2011.
- ^ a b "Copeland council elections: Labour triumphs again". News and Star. 7 May 2011. http://www.newsandstar.co.uk/news/copeland-council-elections-labour-triumphs-again-1.835146?referrerPath=news. Retrieved 26 July 2011.
- ^ a b c d e f g h i j k l m n o p q r s t u v w x y z "May 2011 Election results". Copeland Borough Council. http://www.copeland.gov.uk/Default.aspx?page=2276. Retrieved 25 July 2011.
Preceded by
Copeland Council election, 2007Copeland local elections Succeeded by
Copeland Council election, 2015(2010 ←)  United Kingdom local elections, 2011 (→ 2012)
Metropolitan boroughs Barnsley · Birmingham · Bolton · Bradford · Bury · Calderdale · Coventry · Doncaster · Dudley · Gateshead · Kirklees · Knowsley · Leeds · Liverpool · Manchester · Newcastle upon Tyne · North Tyneside · Oldham · Rochdale · Rotherham · Salford · Sandwell · Sefton · Sheffield · Solihull · South Tyneside · St Helens · Stockport · Sunderland · Tameside · Trafford · Wakefield · Walsall · Wigan · Wirral · WolverhamptonUnitary authorities Bath and North East Somerset · Blackburn with Darwen · Blackpool · Bournemouth · Bracknell Forest · Brighton & Hove · Bristol · Cheshire East · Cheshire West & Chester · Darlington · Derby · East Riding of Yorkshire · Halton · Hartlepool · Herefordshire · Kingston upon Hull · Leicester · Luton · Medway · Middlesbrough · Milton Keynes · North East Lincolnshire · North Lincolnshire · North Somerset · Nottingham · Peterborough · Plymouth · Poole · Portsmouth · Reading · Redcar and Cleveland · Rutland · Slough · South Gloucestershire · Southampton · Southend-on-Sea · Stockton-on-Tees · Stoke-on-Trent · Swindon · Telford and Wrekin · Thurrock · Torbay · Warrington · West Berkshire · Windsor and Maidenhead · Wokingham · YorkDistrict councils Allerdale · Amber Valley · Arun · Ashfield · Ashford · Aylesbury Vale · Babergh · Barrow-in-Furness · Basildon · Basingstoke and Deane · Bassetlaw · Blaby · Boston · Braintree · Breckland · Brentwood · Broadland · Bromsgrove · Broxbourne · Broxtowe · Burnley · Cambridge · Cannock Chase · Canterbury · Carlisle · Castle Point · Charnwood · Chelmsford · Cherwell · Chesterfield · Chichester · Chiltern · Christchurch · Chorley · Colchester · Copeland · Corby · Cotswold · Craven · Crawley · Dacorum · Dartford · Daventry · Derbyshire Dales · Dover · Eastbourne · East Cambridgeshire · East Devon · East Dorset · East Hampshire · East Hertfordshire · Eastleigh · East Lindsey · East Northamptonshire · East Staffordshire · Eden · Elmbridge · Epping Forest · Epsom and Ewell · Erewash · Exeter · Fenland · Forest Heath · Forest of Dean · Fylde · Gedling · Gloucester · Gravesham · Guildford · Great Yarmouth · Hambleton · Harborough · Harlow · Harrogate · Hart · Havant · Hertsmere · High Peak · Hinckley and Bosworth · Horsham · Huntingdonshire · Hyndburn · Ipswich · Kettering · King's Lynn and West Norfolk · Lancaster · Lewes · Lincoln · Lichfield · Maidstone · Maldon · Malvern Hills · Mansfield · Melton · Mendip · Mid Devon · Mid Suffolk · Mid Sussex · Mole Valley · New Forest · Newark and Sherwood · Newcastle-under-Lyme · North Devon · North Dorset · North East Derbyshire · North Hertfordshire · North Kesteven · North Norfolk · North Warwickshire · North West Leicestershire · Northampton · Norwich · Oadby and Wigston · Pendle · Preston · Purbeck · Redditch · Reigate and Banstead · Ribble Valley · Richmondshire · Rochford · Rossendale · Rother · Rugby · Runnymede · Rushcliffe · Rushmoor · Ryedale · Scarborough · Sedgemoor · Selby · Sevenoaks · Shepway · South Cambridgeshire · South Derbyshire · South Hams · South Holland · South Kesteven · South Lakeland · South Norfolk · South Northamptonshire · South Oxfordshire · South Ribble · South Somerset · South Staffordshire · Spelthorne · St Albans · St Edmundsbury · Stafford · Staffordshire Moorlands · Stevenage · Stratford-on-Avon · Stroud · Suffolk Coastal · Surrey Heath · Swale · Swale · Tamworth · Tandridge · Taunton Deane · Teignbridge · Tendring · Test Valley · Tewkesbury · Thanet · Three Rivers · Tonbridge and Malling · Torridge · Tunbridge Wells · Uttlesford · Vale of White Horse · Warwick · Watford · Waveney · Waverley · Wealden · Wellingborough · Welwyn Hatfield · West Devon · West Dorset · West Lancashire · West Lindsey · West Oxfordshire · West Somerset · Weymouth and Portland · Winchester · Woking · Worcester · Worthing · Wychavon · Wycombe · Wyre · Wyre ForestMayoral elections Categories:- English District Council elections
- English local elections, 2011
- Council elections in Cumbria
- Copeland

Wikimedia Foundation. 2010.