- Critical band
-
The term critical band, introduced by Harvey Fletcher in the 1940s, referred to the frequency bandwidth of the then loosely defined auditory filter.
Psychophysiologically, beating and auditory roughness sensations can be linked to the inability of the auditory frequency-analysis mechanism to resolve inputs whose frequency difference is smaller than the critical bandwidth and to the resulting irregular "tickling"[1] of the mechanical system (basilar membrane) that resonates in response to such inputs. Critical bands are also closely related to auditory masking phenomena – reduced audibility of a sound signal when in the presence of a second signal of higher intensity and within the same critical band. Masking phenomena have wide implications, ranging from a complex relationship between loudness (perceptual frame of reference) and intensity (physical frame of reference) to sound compression algorithms.
Contents
Auditory filters
Filters are used in many aspects of audiology and psychoacoustics including the peripheral auditory system. A filter is a device that boosts certain frequencies and attenuates others. In particular, a band-pass filter allows a range of frequencies within the bandwidth to pass through while stopping those outside the cut-off frequencies.[2]
 A Band-pass filter showing the centre frequency(Fc), the lower(Fl) and upper(Fu) cut off frequencies and the bandwidth. The upper and lower cut-off frequencies are defined as the point where the amplitude falls to 3dB below the peak amplitude. The bandwidth is the area between the upper and lower cut-off frequencies and is the range of frequencies passed by the filter.
The shape and organisation of the basilar membrane means that different frequencies resonate particularly strongly at different points along the membrance. This leads to a tonotopic organisation of the sensitivity to frequency ranges along the membrane, which can be modeled as being an array of overlapping band-pass filters known as "auditory filters".[3] The auditory filters are associated with points along the basilar membrane and determine the frequency selectivity of the cochlea, and therefore the listener’s discrimination between different sounds.[2][4] They are non-linear, level-dependent and the bandwidth decreases from the base to apex of the cochlea as the tuning on the basilar membrane changes from high to low frequency.[5][4][2] The bandwidth of the auditory filter is called the critical bandwidth, as first suggested by Fletcher (1940). If a signal and masker are presented simultaneously then only the masker frequencies falling within the critical bandwidth contribute to masking of the signal. The larger the critical bandwidth the lower the signal-to-noise ratio (SNR) and the more the signal is masked.
 Figure 2: ERB related to centre frequency. The diagram shows the ERB versus centre frequency according to the formula of Glasberg and Moore.[4]
Another concept associated with the auditory filter is the equivalent rectangular bandwidth (ERB). The ERB shows the relationship between the auditory filter, frequency, and the critical bandwidth. An ERB passes the same amount of energy as the auditory filter it corresponds to and shows how it changes with input frequency.[2][4] At low sound levels, the ERB is approximated by the following equation according to Glasberg and Moore:[4]
- ERB = 24.7*(4.37F + 1)
Where the ERB is in Hz and F is the centre frequency in kHz.
It is thought that each ERB is the equivalent of around 0.9mm on the basilar membrane.[4][5] The ERB can be converted into a scale that relates to frequency and shows the position of the auditory filter along the basilar membrane. For example, an ERB number of 3.36 corresponds to a frequency at the apical end of the basilar membrane whereas an ERB number of 38.9 corresponds to the base and a value of 19.5 falls half-way between the two.[4]
One filter type used to model the auditory filters is the gammatone filter. It provides a simple linear filter, which is therefore easy to implement, but cannot by itself account for nonlinear aspects of the auditory system; it is nevertheless used in a variety of models of the auditory system. Variations and improvements of the gammatone model of auditory filtering include the gammachirp filter, the all-pole and one-zero gammatone filters, the two-sided gammatone filter, and filter cascade models, and various level-dependent and dynamically nonlinear versions of these.[6]
Psychoacoustic tuning curves
The shapes of auditory filters are found by analysis of psychoacoustic tuning, which are graphs that show a subject's threshold for detection of a tone as a function of masker parameters.[7]
Psychoacoustic tuning curves can be measured using the notched-noise method. This form of measurement can take a considerable amount of time and can take around 30 minutes to find each masked threshold.[8] In the notched-noise method the subject is presented with a notched noise as the masker and a sinusoid (pure tone) as the signal. Notched noise is used as a masker to prevent the subject hearing beats that occur if a sinusoidal masker is used.[5] The notched noise is noise with a notch around the frequency of the signal the subject is trying to detect, and contains noise within a certain bandwidth. The bandwidth of the noise changes and the masked thresholds for the sinusoid are measured. The masked thresholds are calculated through simultaneous masking when the signal is played to the subject at the same time as the masker and not after.
To get a true representation of the auditory filters in one subject, many psychoacoustic tuning curves need to be calculated with the signal at different frequencies. For each psychoacoustic tuning curve being measured, at least five but preferably between thirteen and fifteen thresholds must be calculated, with different notch widths.[8] Also a large number of thresholds need to be calculated because the auditory filters are asymmetrical, so thresholds should also be measured with the notch asymmetric to the frequency of the signal.[7] Because of the many measurements needed, the amount of time needed to find the shape of a person's auditory filters is very long. To reduce the amount of time needed, the ascending method can be used when finding the masked thresholds. If the ascending method is used to calculate the threshold the time needed to calculate the shape of the filter is reduced dramatically, as it takes around two minutes to calculate the threshold.[8] This is because the threshold is recorded is when the subject first hears the tone, instead of when they respond to a certain stimulus level a certain percentage of the time.
Anatomy and physiology of the basilar membrane
The human ear is made up of three areas: the outer, middle and inner ear. Within the inner ear sits the cochlea. The cochlea is a snail-shaped formation that enables sound transmission via a sensorineural route, rather than through a conductive pathway.[9] The cochlea is a complex structure, consisting of three layers of fluid. The scala vestibuli and scala media are separated by Reissner’s Membrane whereas the scala media and scala tympani are divided by the basilar membrane.[9] The diagram below illustrates the complex layout of the compartments and their divisions:[2]
 Cross-section through the cochlea, showing the different compartments (as described above)
The basilar membrance widens as it progresses from base to apex. Therefore, the base (the thinnest part) has a greater stiffness than the apex.[2] This means that the amplitude of a sound wave travelling through the basilar membrane varies as it travels through the cochlea.[9] When a vibration is carried through the cochlea, the fluid within the three compartments causes the basilar membrane to respond in a wave-like manner. This wave is referred to as a 'travelling wave'; this term means that the basilar membrane does not simply vibrate as one unit from the base towards the apex.
When a sound is presented to the human ear, the time taken for the wave to travel through the cochlea is only 5 milliseconds.[9]
When low-frequency travelling waves pass through the cochlea, the wave increases in amplitude gradually, then decays almost immediately. The placement of vibration on the cochlea depends upon the frequency of the presented stimuli. For example, lower frequencies mostly stimulate the apex, in comparison to higher frequencies, which stimulate the base of the cochlea. This attribute of the physiology of the basilar membrane can be illustrated in the form of a place–frequency map:[10]
 Simplified schematic of the basilar membrane, showing the change in characteristic frequency from base to apex
The basilar membrane supports the organ of Corti, which sits within the scala media.[2] The organ of Corti comprises both outer and inner hair cells. There are approximately between 15,000 and 16,000 of these hair cells in one ear.[9] Outer hair cells have stereocilia projecting towards the tectorial membrane, which sits above the organ of Corti. Stereocilia respond to movement of the tectorial membrane when a sound causes vibration through the cochlea. When this occurs, the stereocilia separate and a channel is formed that allows chemical processes to take place. Eventually the signal reaches the eighth nerve, followed by processing in the brain.[9]
Relationship to masking
Auditory filters are closely associated with masking in the way they are measured and also the way they work in the auditory system. As described previously the critical bandwidth of the filter increases in size with increasing frequency, along with this the filter becomes more asymmetrical with increasing level.
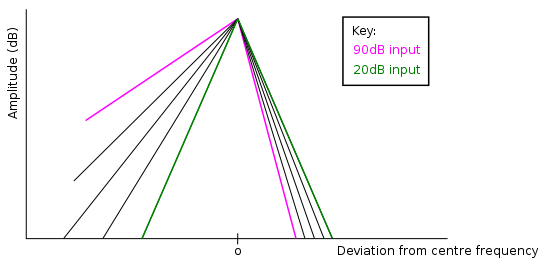 Asymmetry of the auditory filter. The diagram shows the increasing asymmetry of the auditory filter with increasing input level. The highlighted filters show the shape for 90dB input level (pink) and a 20dB input level (green). Diagram adapted from Moore and Glasberg,[11] which showed rounded (roex) filter shapes.
These two properties of the auditory filter are thought to contribute to the upward spread of masking, that is low frequencies mask high frequencies better than the reverse. As increasing the level makes the low frequency slope shallower, by increasing its amplitude, low frequencies mask high frequencies more than at a lower input level.
The auditory filter can reduce the effects of a masker when listening to a signal in background noise using off-frequency listening. This is possible when the centre frequency of the masker is different from that of the signal. In most situations the listener chooses to listen ‘through’ the auditory filter that is centred on the signal however if there is a masker present this may not be appropriate. The auditory filter centred on the signal may also contain a large amount of masker causing the SNR of the filter to be low and decreasing the listeners ability to detect the signal. However, if the listener listened through a slightly different filter that still contained a substantial amount of signal but less masker, the SNR is increased, allowing the listener to detect the signal.[2]
 Off-frequency listening. Diagram A shows the auditory filter centred on the signal and how some of the masker falls within that filter, resulting in a low SNR. Diagram B shows a filter further along the basilar membrane, which is not centered on the signal but contains a substantial amount of that signal and less masker. This shift reduces the effect of the masker by increasing the SNR. Diagram adapted from Gelfand (2004).[2]
The first diagram above shows the auditory filter centred on the signal and how some of the masker falls within that filter. This results in a low SNR. The second diagram shows the next filter along the basilar membrane, which is not centred on the signal but contains a substantial amount of that signal and less masker. This reduces the effect of the masker by increasing the SNR.
The above applies to the power-spectrum model of masking. In general this model relies on the auditory system containing the array of auditory filters and choosing the filter with the signal at its centre or with the best SNR. Only masker that falls into the auditory filter contributes to masking and the person’s threshold for hearing the signal is determined by that masker.[4]
Normal and impaired auditory filters
In a ‘normal’ ear the auditory filter has a shape similar to the one shown below. This graph reflects the frequency selectivity and the tuning of the basilar membrane.
 The auditory filter of a "normal" cochlea
The tuning of the basilar membrane is due to its mechanical structure. At the base of the basilar membrane it is narrow and stiff and is most responsive to high frequencies. However, at the apex the membrane is wide and flexible and is most responsive to low frequencies. Therefore, different sections of the basilar membrane vibrate depending on the frequency of the sound and give a maximum response at that particular frequency.
In an Impaired ear, however the auditory filter has a different shape compared to that of a ‘normal’ ear.[12]
 The auditory filter of an impaired cochlea
The auditory filter of an impaired ear is flatter and broader compared to a normal ear. This is because the frequency selectivity and the tuning of the basilar membrane is reduced as the outer hair cells are damaged. When only the outer hair cells are damaged the filter is broader on the low frequency side. When both the outer and inner hair cells are damaged the filter is broader on both sides. This is less common. The broadening of the auditory filter is mainly on the low frequency side of the filter. This increases susceptibility to low frequency masking i.e. upward spread of masking as described above.[4]
See also
- Loudness
- Psychoacoustics, Masking effects
- Auditory masking
- Consonance and dissonance
- Equivalent rectangular bandwidth
References
- ^ Campbell, M.; Greated, C. (1987). The Musician's Guide to Acoustics. New York: Schirmer Books. ISBN 0028701615.
- ^ a b c d e f g h i Gelfand, S. A. (2004). Hearing: an introduction to psychological and physiological acoustics (4th ed.). New York: Marcel Dekker. ISBN 0585266069.
- ^ Munkong, R. (2008), IEEE Signal Processing Magazine 25 (3): 98--117, Bibcode 2008ISPM...25...98M, doi:10.1109/MSP.2008.918418
- ^ a b c d e f g h i Moore, B. C. J. (1998). Cochlear hearing loss. London: Whurr Publishers Ltd.. ISBN 0585122563.
- ^ a b c Moore, B. C. J. (1986), "Parallels between frequency selectivity measured psychophysically and in cochlear mechanics", Scand. Audio Suppl. (25): 129–52
- ^ R. F. Lyon, A. G. Katsiamis, E. M. Drakakis (2010). "History and Future of Auditory Filter Models". Proc. ISCAS. IEEE. http://research.google.com/pubs/archive/36895.pdf.
- ^ a b Glasberg, B. R.; Moore, B. C. J. (1990), "Derivation of auditory filter shapes from notched-noise data", Hear. Res. (47): 103–138
- ^ a b c Nakaichi, T.; Watanuki, K.; Sakamoto, S. (2003), "A simplified measurement method of auditory filters for hearing impaired listeners", Acoust. Sci. and tech. 24 (6): 365–375
- ^ a b c d e f Plewes, K. (2006). Anatomy and physiology of the ear.
- ^ "Promenade 'round the Cochlea". 2003. http://www.cochlea.org.
- ^ Moore, B. C. J. and Glasberg, B. R. (1987). "Formulae describing frequency selectivity as a function of frequency and level, and their use in calculating excitation patterns". Hearing Research 28 (2-3): 209–225. doi:10.1016/0378-5955(87)90050-5. ISSN 0378-5955. PMID 3654390.
- ^ Moore, B. C. J. (2003). An introduction to the psychology of hearing (5th ed.). San Diego, CA: Academic Press. ISBN 0125056273.
External links
- Vassilakis, P.N. and Fitz, K. (2007). SRA: A Web-based Research Tool for Spectral and Roughness Analysis of Sound Signals. Supported by a Northwest Academic Computing Consortium grant to J. Middleton, Eastern Washington University
- Psychoacoustics: Critical Bands etc.
Categories:


Wikimedia Foundation. 2010.