- Ethnic origins of people in Canada
-
Culture of Canada
This article is part of a series History Canadians
Canadian identity
Canadian nationalism
Royal symbols
National symbols
Cultural protectionism
Multiculturalism in Canada
Ethnic origins
Immigration
Official bilingualism
Spoken languagesTopics Architecture · Bibliography
Art · Cinema
Cuisine · Festivals · Humour
Literature · Media · Music
Politics · Religion
Sports · Television · TheatrePortal Immigration to Canada

This article is part of a series Topics Canadians
History of immigration
Economic impact of immigration
Population by year
Ethnic origins
Immigration department
Passport Canada
Permanent Resident CardNationality law History of nationality law
Citizenship Act 1946
Immigration Act, 1976
Immigration Protection Act
Citizenship Test
Oath of CitizenshipCitizenship classes Permanent resident
Honorary citizenship
Commonwealth citizen
Temporary resident
Refugee
Lost Canadians
"Canadians of convenience"Demographics of Canada Given here are the ethnic origins of Canadian residents (citizens, landed immigrants, and non-citizen temporary residents) as recorded by them on their 2006 census form. The relevant census question asked for "the ethnic or cultural origins" of the respondent's ancestors and not the respondents themselves.
As data were collected by self-declaration, labels may not necessarily describe the true ancestry of respondents.[1] Also note that many respondents acknowledged multiple ancestries. These people were added to the "multiple origin" total for each origin listed. These include responses as varied as a respondent who listed eight different origins and a respondent who answered "French Canadian" (leading to him/her being counted once for "French" and once for "Canadian". As with all self-reported data, understanding of the question may have varied from respondent to respondent.
Contents
Larger ethnic origins (200,000 or more individuals per group)
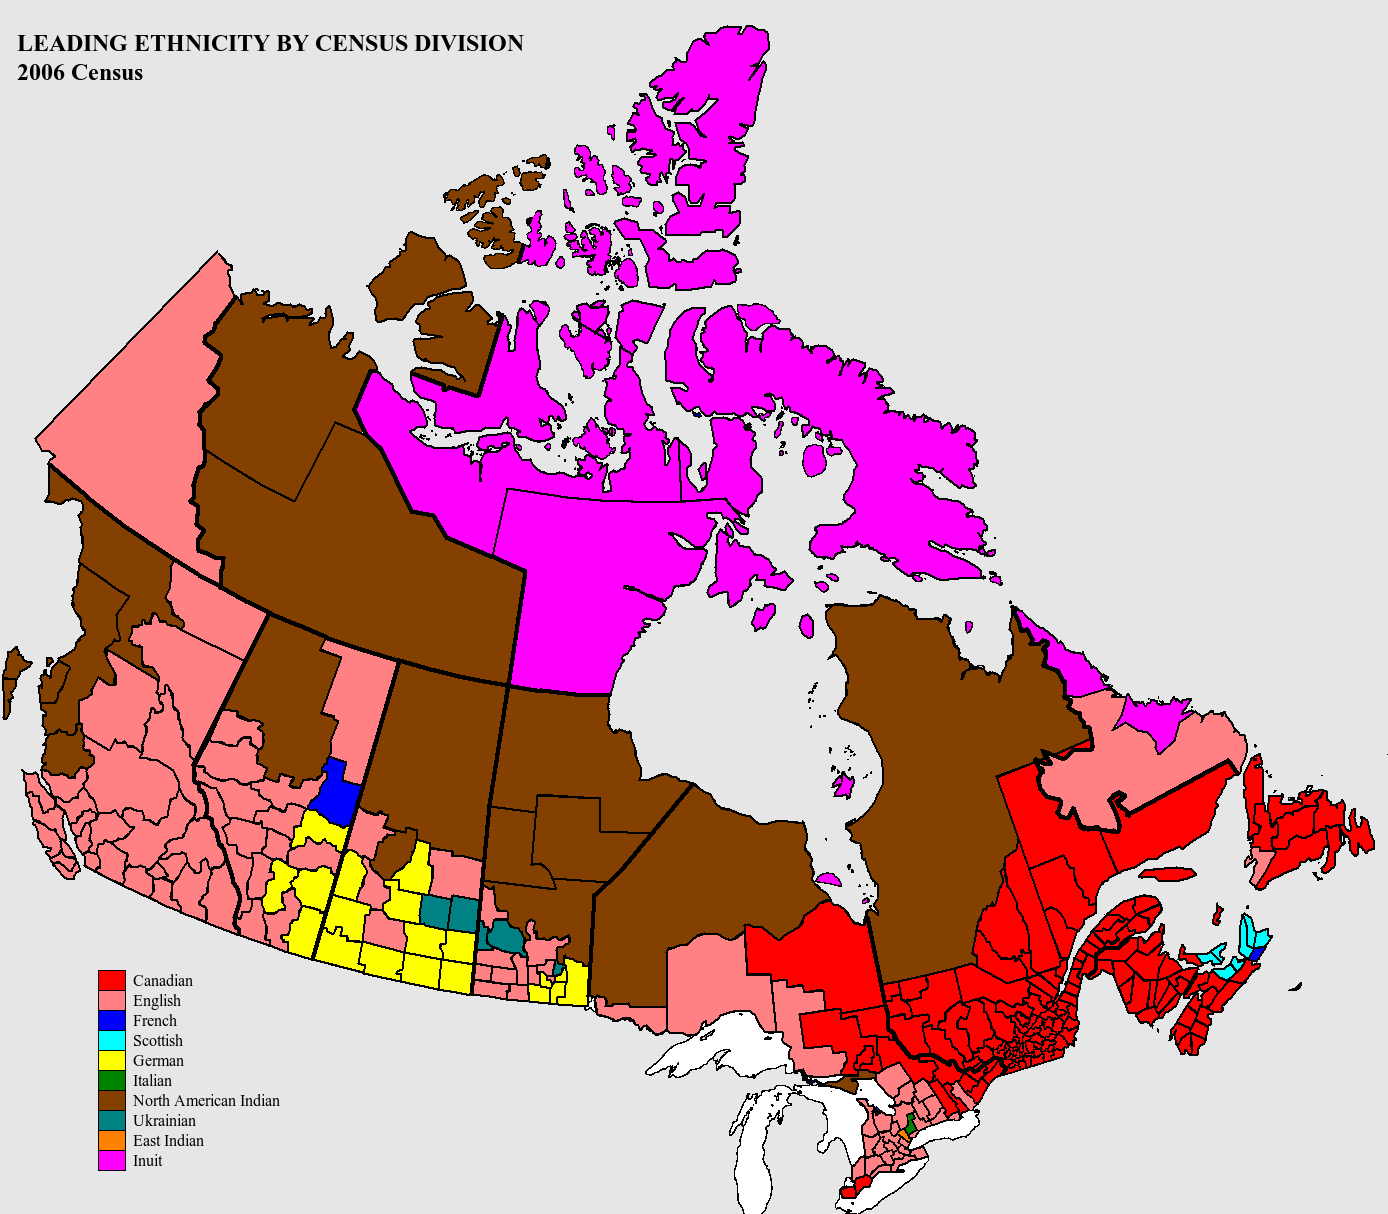
 Map of the dominant self-identified ethnic origins of ancestors per census division of 2006.
 CanadianEnglishFrenchScottishGermanItalianNorth American IndianUkrainianEast IndianInuit
Ethnicity[3] Combined
responses[3]As single
response[3]One of multiple
responses[3]Canadian[4] 10,066,290 5,748,720 4,317,570 English 6,570,015 1,367,125 5,202,890 French 4,941,210 1,230,535 3,710,675 Scottish 4,719,850 568,515 4,151,340 Irish 4,354,155 491,030 3,863,125 German 3,179,425 670,640 2,508,785 Italian 1,445,335 741,045 704,285 Chinese 1,346,510 1,135,365 211,145 North American Indian[5] 1,253,615 512,150 741,470 Ukrainian 1,209,085 300,590 908,495 Dutch (Netherlands) 1,035,965 303,400 732,560 Polish 984,565 269,375 715,190 East Indian 962,665 780,175 182,495 Russian 500,600 98,245 402,355 Welsh 440,965 27,115 413,855 Filipino 436,190 321,390 114,800 Norwegian 432,515 44,790 387,725 Portuguese 410,850 262,230 148,625 Métis 409,065 77,295 331,770 British Isles,
not included elsewhere403,915 94,145 309,770 Swedish 334,765 28,445 306,325 Spanish 325,730 67,475 258,255 American 316,350 28,785 287,565 Hungarian (Magyar) 315,510 88,685 226,820 Jewish 315,120 134,045 181,070 Greek 242,685 145,250 97,435 Jamaican 231,110 134,320 96,785 Danish 200,035 33,770 166,265 Lebanese 165,150 103,855 61,295 Smaller ethnic origins
Ethnicity[3] Combined
responses[3]As single
response[3]One of multiple
responses
per respondent[3]Belgian (related article: Belgians) 168,915 33,675 135,240 Vietnamese 151,410 119,120 32,290 Austrian (related article: Austrians) 147,585 25,320 122,265 Romanian 131,830 53,320 78,505 Finnish 114,690 31,985 82,705 Swiss 110,795 24,595 86,200 Serbian 55,540 39,205 16,330 South Korean 101,715 95,200 6,510 Québécois 98,670 65,480 33,190 Trinidadian/Tobagonian 70,590 65,440 50,150 Black African, n.i.e.(*) 97,185 37,380 59,810 Croatian 97,050 58,170 38,880 Iranian 88,220 73,450 14,770 Japanese 85,230 53,175 32,050 Haitian 82,405 70,755 11,650 Czech 79,910 24,945 54,965 Icelandic 75,090 10,850 64,240 Pakistani 74,015 54,565 19,450 Arab, n.i.e. 71,705 47,600 24,100 Acadian 71,590 21,945 49,645 Yugoslav, n.i.e. 65,505 26,880 38,625 Sri Lankan 61,315 45,485 15,825 West Indian 59,705 33,295 26,410 Inuit 56,330 37,030 19,300 Guyanese 51,570 26,290 25,280 Slovak 50,860 19,865 30,990 South Asian, n.i.e. 49,205 41,950 7,255 Oceania origins 48,595 10,760 37,835 Maghrebi origins 48,165 32,175 15,990 Punjabi 47,155 28,980 18,180 Latin/Central/South
American, n.i.e.41,620 30,380 11,240 Egyptian 41,310 26,150 15,160 Armenian 40,505 27,175 13,330 Mexican 36,575 15,815 20,755 Lithuanian 36,485 11,320 25,165 Chilean 34,115 21,820 12,290 Somali 33,725 30,830 2,895 Czechoslovakian 33,540 7,205 26,340 Maltese 33,000 14,115 18,880 Scandinavian, n.i.e. 32,730 6,690 26,040 Macedonian 31,265 16,790 14,475 Slovenian 28,910 15,285 13,635 Bulgarian 27,260 16,480 10,775 Salvadoran 26,735 20,795 5,940 Australian 25,415 3,805 21,615 Afghan 25,230 22,320 2,910 Turkish 24,910 15,065 9,845 Barbadian 23,725 10,600 13,125 Latvian 22,615 8,885 13,730 Estonian 22,085 9,645 12,435 Syrian 22,065 10,425 11,640 Moroccan 21,355 13,035 8,315 European, n.i.e. 20,450 9,715 10,735 Cambodian 20,430 14,840 5,595 Iraqi 19,245 14,105 5,140 South African 18,925 4,980 13,945 Taiwanese 18,080 13,335 4,745 Peruvian 17,945 10,935 7,010 Laotian 16,950 12,345 4,605 Ghanaian 16,935 14,170 2,765 Colombian 15,865 10,445 5,415 Ethiopian 15,725 13,100 2,625 Bosnian 15,720 12,185 3,540 Algerian 15,500 11,235 4,260 Albanian 14,935 12,310 2,625 Palestinian 14,675 9,215 5,465 Newfoundlander 13,715 4,155 9,555 Bangladeshi 13,080 11,295 1,785 Flemish 11,665 2,325 9,345 Caribbean, n.i.e. 10,990 4,295 6,695 Fijian 10,035 5,115 4,920 Khmer 10,000 710 295 Brazilian 9,710 3,185 6,525 Indonesian 9,700 2,080 7,620 Guatemalan 9,550 6,435 3,120 Nigerian 9,530 6,570 2,960 Argentinian 9,095 2,970 6,125 Central/South
American Indian8,965 1,865 7,100 West Asian, n.i.e. 8,805 7,245 1,565 East/Southeast
Asian, n.i.e.8,795 8,465 330 Ecuadorian 8,785 5,960 2,830 New Zealander 8,600 1,160 7,435 Grenadian 7,995 4,315 3,680 Hispanic 7,850 5,460 2,390 Vincentian/Grenadinian 7,450 3,875 3,575 Eritrean 7,165 6,265 900 Bengali 7,020 5,465 1,560 Assyrian 6,980 4,570 2,410 Thai 6,965 2,810 4,160 Dominican, n.o.s. 6,865 3,255 3,610 Slav (European) 6,810 2,790 4,020 Sudanese 6,525 4,495 2,030 Congolese, n.o.s. 6,235 5,005 1,230 Cuban 6,200 2,195 4,005 Nicaraguan 6,190 4,340 1,850 Malaysian 6,095 1,570 4,520 Israeli 6,060 1,395 4,665 Venezuelan 5,925 2,320 3,600 Berber 5,570 3,350 2,220 Tunisian 5,325 3,425 1,890 Byelorussian 5,115 1,490 3,620 Tibetan 5,000 1,000 4,000 Goan 3,865 1,630 2,235 Uruguayan 3,800 1,695 2,105 Jordanian 3,760 2,320 1,435 Sinhalese 3,560 2,195 1,370 Frisian 3,175 670 2,500 Rwandan 3,060 2,430 630 Honduran 3,025 1,955 1,070 Kenyan 2,990 1,540 1,455 Maya 2,875 685 2,190 Burmese 2,840 1,070 1,770 Gujarati 2,805 1,180 1,620 St. Lucian 2,765 1,420 1,345 Mauritian 2,720 1,145 1,575 Basque 2,715 395 2,320 Gypsy (Roma) 2,590 390 2,205 Sicilian 2,465 420 2,045 Antiguan 2,435 1,025 1,405 Luxembourger 2,390 450 1,945 East African 2,270 1,000 1,270 Maghrebi, n.i.e. 2,270 1,125 1,145 Ugandan 2,125 1,115 1,005 Panamanian 2,075 1,055 1,020 Cameroonian 2,070 1,615 455 Cypriot 2,060 590 1,470 Asian, n.o.s. 2,010 960 1,045 Hawaiian 1,955 110 1,840 Burundian 1,900 1,535 360 Zairian 1,885 1,390 495 Yoruba 1,875 1,340 535 Tanzanian 1,865 830 1,030 Ashanti 1,860 1,325 540 Bermudan 1,845 205 1,640 Bolivian 1,795 865 935 Polynesian 1,745 310 1,435 Kittitian/Nevisian 1,730 730 1,000 Mongolian 1,675 545 1,130 Senegalese 1,675 1,045 630 Costa Rican 1,615 770 845 Bahamian 1,585 360 1,225 Azerbaijani 1,445 470 975 Yemeni 1,445 685 760 Carib 1,330 70 1,255 Maori 1,305 135 1,170 Afrikaner 1,250 310 935 Zimbabwean 1,250 585 660 Igbo 1,200 850 355 Kosovar 1,200 960 245 Libyan 1,180 795 390 Nepali 1,170 770 405 Ivoirean 1,120 655 465 Guinean, n.o.s. 1,120 710 415 Angolan 1,110 615 490 Saudi Arabian 1,080 660 420 Montenegrin 1,055 230 820 Puerto Rican 1,045 130 915 Pashtun 1,040 540 500 Oromo 1,030 710 320 "Texan" 1,000 700 300 Seychellois 980 605 370 Georgian 970 385 580 Tatar 875 370 505 Kuwaiti 855 585 275 Malian 815 480 340 Malagasy 780 415 365 Paraguayan 760 125 640 Togolese 755 480 275 Akan 750 505 240 Belizean 725 225 500 Martinique 605 140 460 Hmong 595 455 140 Sierra Leonean 565 350 220 Kashmiri 480 210 275 Pacific Islander, n.i.e. 390 125 265 Cornish (see Cornish people) 365 N/A 1,550 Manx (see Manx people) 350 N/A N/A See also
- 1666 census of New France
- Canada 1911 Census
- Canada 1996 Census
- Canada 2001 Census
- Canada 2006 Census
- List of population of Canada by years
- History of Canada
- Immigration to Canada
References
- ^ Source: "Ethnocultural Portrait of Canada - Data table". Statistics Canada. http://www12.statcan.ca/census-recensement/2006/dp-pd/hlt/97-562/pages/page.cfm?Lang=E&Geo=PR&Code=01&Data=Count&Table=2&StartRec=1&Sort=3&Display=All&CSDFilter=5000. Retrieved 2011-01-16. Additional data: "2006 Census release topics". Statistics Canada. http://www12.statcan.gc.ca/census-recensement/2006/rt-td/index-eng.cfm. Retrieved 2011-01-16.
- ^ "Population and growth components (1851-2001 Censuses)". Statistics Canada. 2010. http://www12.statcan.ca/english/census01/products/standard/themes/RetrieveProductTable.cfm?Temporal=2001&PID=62124&APATH=3&GID=431515&METH=1&PTYPE=55440&THEME=43&FOCUS=0&AID=0&PLACENAME=0&PROVINCE=0&SEARCH=0&GC=99&GK=NA&VID=0&VNAMEE=&VNAMEF=&FL=0&RL=0&FREE=0. Retrieved 2011-01-19.
- ^ a b c d e f g h "Population by selected ethnic origins, by province and territory (2006 Census)". statcan.gc.ca. 2009-07-28. http://www40.statcan.gc.ca/l01/cst01/demo26a-eng.htm. Retrieved 2010-09-10.
- ^ All citizens of Canada are classified as "Canadians" as defined by Canada's nationality laws. However since 1996 "Canadian" as an ethnic group has been added to census questionnaires for possible ancestry. The majority of respondents to this selection are from the eastern part of the country that was first settled. Respondents generally are visibly European (Anglophones and Francophones), however no-longer self identify with their ethnic ancestral origins. This response is attributed to a multitude and/or generational distance from ancestral lineage. Source 1: Jack Jedwab (April 2008). "Our ‘Cense’ of Self: the 2006 Census saw 1.6 million ‘Canadian’". Association for Canadian Studies. http://www.acs-aec.ca/pdf/polls/12154527016855.pdf. Retrieved 2011-03-07. Source 2: Don Kerr (April 2007). The Changing Face of Canada: Essential Readings in Population. Canadian Scholars' Press. pp. 313–317. ISBN 9781551303222. http://books.google.com/books?id=CofPBh5BRhwC&pg=PA313. Retrieved 11 July 2011.
- ^ The category "North American Indian" includes respondents who indicated that their ethnic origins were from a Canadian First Nation, or another, non-Canadian aboriginal group (excluding Inuit and Métis) Source: "How Statistics Canada Identifies Aboriginal Peoples". http://www.statcan.gc.ca/pub/12-592-x/12-592-x2007001-eng.htm.
Further reading
- Bumsted, J. M (2003). Canada's diverse peoples: a reference sourcebook. Library of Congress ( ABC-CLIO). ISBN 1576076725. http://books.google.ca/books?id=Pb5AvfpCZZkC&lpg=PA42&dq=The%20people%20of%20Canada&pg=PP1#v=onepage&q&f=true.
- Magocsi, Paul R (1999). Encyclopedia of Canada's peoples. Society of Ontario, University of Toronto Press. ISBN 0802029388. http://books.google.ca/books?id=dbUuX0mnvQMC&lpg=PA582&dq=Territorial%20evolution%20of%20Canada&pg=PP1#v=onepage&q&f=true.
External links
- Canada Year Book 2010 - Statistics Canada
Categories:- Lists of Canadian people
- Demographics of Canada
- Ethnic groups in Canada
- Immigration to Canada


Wikimedia Foundation. 2010.