- Diagnostic odds ratio
-
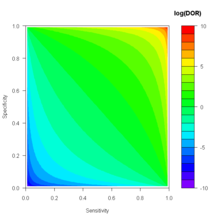 log(Diagnostic Odds Ratio) for varying sensitivity and specificity
The diagnostic odds ratio is a measure of the effectiveness of a diagnostic test.[1] It is defined as the ratio of the odds of the test being positive if the subject has a disease relative to the odds of the test being positive if the subject does not have the disease.
Contents
Definition
The diagnostic odds ratio is defined mathematically as:
where TP, FN, FP and TN are the number of true positives, false negatives, false positives and true negatives respectively.[1]
Confidence interval
As an odds ratio the logarithm of the diagnostic odds ratio is approximately normally distributed. The standard error of the log diagnostic odds ratio is approximately:
From this an approximate 95% confidence interval can be calculated for the log diagnostic odds ratio:
Exponentiation of the approximate confidence interval for the log diagnostic odds ratio gives the approximate confidence interval for the diagnostic odds ratio.[1]
Relation to other measures of diagnostic test accuracy
The diagnostic odds ratio may be expressed in terms of the sensitivity and specificity of the test[1]:
It may also be expressed in terms of the Positive predictive value (PPV) and Negative predictive value (NPV)[1]:
It is also related to the likelihood ratios, LR + and LR − [1]:
Rationale and interpretation
The rationale for the diagnostic odds ratio is that it is a single indicator of test performance (like accuracy and Youden's J statistic) but which is independent of prevalence (unlike accuracy) and is presented as an odds ratio, which is familiar to medical practitioners.
The diagnostic odds ratio ranges from zero to infinity, although diagnostic odds ratios less than one indicate that the test can be improved by simply inverting the outcome of the test. A diagnostic odds ratio of exactly one means that the test is equally likely to predict a positive outcome whatever the true condition. Higher diagnostic odds ratios are indicative of better test performance.[1]
Uses
The log diagnostic odds ratio is sometimes used in meta-analyses of diagnostic test accuracy studies due to its simplicity (being approximately normally distributed).[2]
Traditional meta-analytic techniques such as inverse-variance weighting can be used to combine log diagnostic odds ratios computed from a number of data sources to produce an overall diagnostic odds ratio for the test in question.
The log diagnostic odds ratio can also be used to study the trade-off between sensitivity and specificity.[3][4] By expressing the log diagnostic odds ratio in terms of the logit of the true positive rate (sensitivity) and false positive rate (1 − specificity), and by additionally constructing a measure, S:
It is then possible to fit a straight line, D = a + bS. If b ≠ 0 then there is a trend in diagnostic performance with threshold beyond the simple trade-off of sensitivity and specificity. The value a can be used to plot a summary ROC (SROC) curve.[3][4]
Example
Consider a test with the following 2×2 confusion matrix:
Condition (as determined by “Gold standard” Positive Negative Test outcome Positive 26 12 Negative 3 48 We calculate the diagnostic odds ratio as:
This diagnostic odds ratio is greater than one, so we know that the test is discriminating correctly. We compute the confidence interval for the diagnostic odds ratio of this test as [8.967, 134.0].
Now consider another test with ten extra false positives; its diagnostic odds ratio is:
This diagnostic odds ratio is also greater than one, but is lower, indicating worse performance, as we would expect if the number of false positives increased. The confidence interval for the diagnostic odds ratio of this test is [3.193, 20.04]. The confidence intervals for these tests are clearly overlapping, so we would not conclude that the first test was statistically better than the second.
Criticisms
The diagnostic odds ratio is undefined when the number of false negatives or false positives is zero. The typical response to such a scenario is to add 0.5 to all cells in the contingency table,[1][5] although this should not be seen as a correction as it introduces a bias to results.[3] It is suggested that the adjustment is made to all contingency tables, even if there are no cells with zero entries.[3]
See also
- Sensitivity and specificity
- Binary classification
- Positive predictive value and negative predictive value
- Odds ratio
References
- ^ a b c d e f g h Afina S. Glas, Jeroen G. Lijmer, Martin H. Prins, Gouke J. Bonsel, Patrick M.M. Bossuyt. The diagnostic odds ratio: a single indicator of test performance. Journal of Clinical Epidemiology, 56 (2003), 1129-1135.
- ^ Constantine Gatsonis, Prashni Paliwal. Meta-analysis of diagnostic and screening test accuracy evaluations: methodologic primer. American Journal of Roentgenology 187(2), 271-281. 2006.
- ^ a b c d Lincoln E. Moses, David Shapiro. Combining independent studies of a diagnostic test into a summary ROC curve: data-analytic approaches and some additional considerations. Statistics in Medicine, 12(12) 1293–1316, 1993.
- ^ a b J. Dinnes, J. Deeks, H. Kunst, A. Gibson, E. Cummins, N. Waugh, F. Drobniewski, A. Lalvani. A systematic review of rapid diagnostic tests for the detection of tuberculosis infection. Health Technology Assessment, 11(3), 2007.
- ^ D.R. Cox. The analysis of binary data. Methuen, London, 1970.
Categories:- Statistical theory
- Biostatistics
- Medical statistics
- Statistical ratios
- Bioinformatics
- Summary statistics for contingency tables


![D = \log{\text{DOR}} = \log{\left[\frac{TPR}{(1-TPR)}\times\frac{(1-FPR)}{FPR}\right]} = \operatorname{logit}(TPR) - \operatorname{logit}(FPR)](c/d5c7293dba33a0b50aa61dee3f903fed.png)


Wikimedia Foundation. 2010.