- Vortex Indicator
-
The Vortex Indicator is a technical indicator invented by Etienne Botes and Douglas Siepman to identify the start of a new trend or the continuation of an existing trend within financial markets. It was published in the January 2010 edition of Technical Analysis of Stocks & Commodities.[1]
Contents
Inspiration
The Vortex Indicator was inspired by the work of an Austrian inventor, Viktor Schauberger, who studied the flow of water in rivers and turbines. Etienne Botes and Douglas Siepman developed the idea that movements and flows within financial markets are similar to the vortex motions found in water. The Vortex Indicator was also partly inspired by J. Welles Wilder's concept of directional movement, which assumes the relationship between price bars gives clues as to the direction of a market.[2]
Description
A vortex pattern may be observed in any market by connecting the lows of that market’s price bars with the consecutive bars’ highs, and then price bar highs with consecutive lows. The greater the distance between the low of a price bar and the subsequent bar’s high, the greater the upward or positive Vortex movement (VM+). Similarly, the greater the distance between a price bar’s high and the subsequent bar’s low, the greater the downward or negative Vortex movement (VM-).
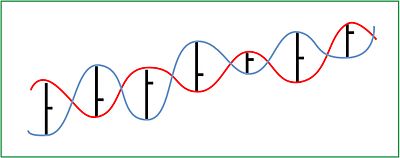 A Vortex Pattern in the Market: By connecting the lows of price bars with the consecutive bars’ highs, and then price bar highs with consecutive lows, one can observe a vortex pattern in the market.
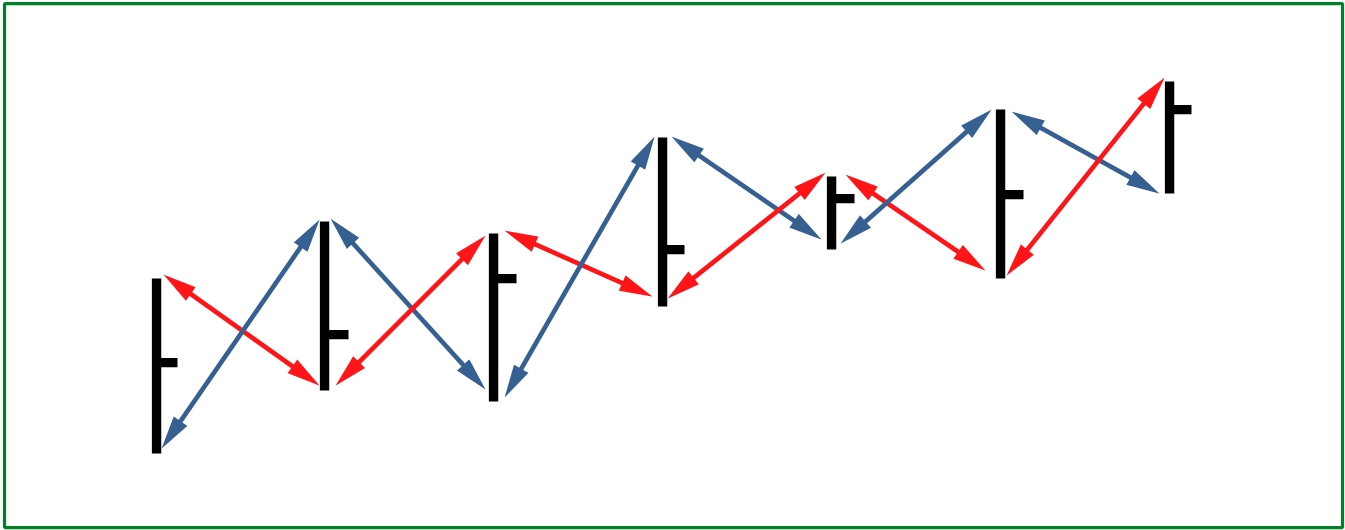
 The Vortex Indicator: The greater the distance between the low of a price bar and the subsequent bar’s high, the stronger the positive Vortex movement (VM+). Similarly, the greater the distance between a price bar’s high and the subsequent bar’s low, the stronger the negative Vortex movement (VM-).
Identifying a trend
On a chart, VI+ and VI- will be seen to intersect each other at a change of trend, and begin to diverge ever wider as the strength of a trend increases. When VI+ is larger and above VI-, the market is trending up. Conversely, when VI- is bigger and above VI+, the market is trending down.
A trader should focus on the key trend change points of the Vortex Indicator (i.e. the crossing points of VI+ and VI-). When VI+ crosses above VI-, a long (buy) position is indicated. A short or sell position is suggested when VI- crosses above VI+.
The published article also suggested further measures to ensure an effective trading strategy, for example, only entering a trade at the extreme high or low of the price bar that corresponds with a crossing of the Vortex Indicator.[3]
 14-Period Daily Vortex Indicator: When VI+ is greater than VI-, it indicates that the market is trending up. The market is trending down when VI- is above VI+. The potential change of trend points are found where VI+ and VI- intersect one another.
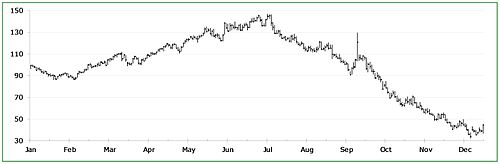 Price Chart: As the trend strengthens, notice how the VI+ and VI- lines increasingly diverge. As the trend weakens, you will observe the two lines converging again.
Calculation
The high, low and close values are required for any chosen stock, future, commodity or currency. These values may be 15-minute, hourly, daily, etc.
- First, calculate the current True Range:
- Current True Range (TR) = Maximum absolute value of either (Current High-Current Low), (Current Low-Previous Close), (Current High-Previous Close)
- Next, calculate the current upward (positive) and downward (negative) Vortex movements:
- Current Vortex Movement Up (VM+) = Absolute value of Current High – Previous Low
- Current Vortex Movement Down (VM-) = Absolute Value of Current Low – Previous High
- Decide on a parameter length (21 periods was used for this example). Now, sum the last 21 period’s True Range, VM+ and VM-:
- Sum of the last 21 periods’ True Range = SUM TR21
- Sum of the last 21 periods’ VM+ = SUM VM21+
- Sum of the last 21 periods’ VM- = SUM VM21-
- Finally, divide SUM VM21+ and SUM VM21- respectively with the SUM TR21 to obtain the Vortex Indicator:
- SUM VM21+/SUM TR21 = VI21+
- SUM VM21-/SUM TR21 = VI21-
If this process is repeated, the resulting VI21+ and VI21- can be drawn graphically to represent the two lines of the Vortex Indicator.
Practical application
The Vortex Indicator is simple to use as the only required inputs are the high, low and close of a price bar. Traders may use the Vortex Indicator on its own, in combination with other technical indicators to confirm a change of trend or as part of a larger trading system.
In addition, the Vortex Indicator may be used for any:
- market (such as stocks, futures or currencies)
- time frame (for example, 15 minute, hourly or weekly charts)
- parameter (such as 13, 21 or 34 periods)
The inventors of the Vortex Indicator recommend using longer time frames and parameters in order to filter out false signals. If a trader does opt to use a very short time frame, such as 5 minutes, this should be combined with a long parameter of 34 or 55 periods.
Because of its universal applicability, the Vortex Indicator is suitable for both short term traders as well as longer term fund managers who may wish to identify larger macro trends within a market.
Coding and strategies
The Vortex Indicator is available on most charting software.[4] Some of these companies have suggested additional trading strategies to use in conjunction with the Vortex Indicator, including the implementation of a trailing stop [5] and making use of supporting indicators in order to reduce the number of false signals.[6]
Comparative studies
To test the Vortex Indicator against Welles Wilder’s Directional Movement Indicator (DMI), a portfolio of 38 of the most actively traded, full sized, futures contracts was created. These 38 futures included a number of index and financial futures, currencies, metals, energy futures and commodities like grains, oils and foods. The test period was from 3 January 1978 to 6 November 2009, using a 14 day parameter for both indicators. Over the entire test period, and also during the last 10 years, the Vortex Indicator showed a better performance than the DMI.[7]
However, using a similar test based on 101 NASDAQ stocks, on a smaller sample (for the period 2 January 1992 to 14 August 2009), the DMI showed a better performance than the Vortex Indicator.[8]
Possible improvement and variation
An alternative version of the indicator was created by Jez Liberty.[9] This version enables the calculation to account for gap days which sometimes occur in non-continuous markets such as stocks.[10]
See also
References
- ^ Botes, Etienne & Siepman, Douglas (January 2010). “The Vortex Indicator”. Technical Analysis of Stocks & Commodities 28(1), p. 21.
- ^ Wilder, J. Welles (1978). New Concepts In Technical Trading Systems. Trend Research.
- ^ Botes, Etienne & Siepman, Douglas (January 2010). “The Vortex Indicator”. Technical Analysis of Stocks & Commodities 28(1), p. 25.
- ^ "Traders’ Tips". Technical Analysis of Stocks & Commodities. January 2010. http://www.traders.com/Documentation/FEEDbk_docs/2010/01/TradersTips.html. Retrieved 17 January 2010.
- ^ Mills, Mark (January 2010). "TRADESTATION: VORTEX INDICATOR". TradeStation Securities, Inc. http://www.traders.com/Documentation/FEEDbk_docs/2010/01/TradersTips.html. Retrieved 17 January 2010.
- ^ Rast, Pete (January 2010). "STRATASEARCH: VORTEX INDICATOR". Avarin Systems, Inc. http://www.traders.com/Documentation/FEEDbk_docs/2010/01/TradersTips.html. Retrieved 17 January 2010.
- ^ Denning, Richard (January 2010). "January 2010 Stocks and Commodities Traders Tips". Traders Edge Systems. http://www.tradersedgesystems.com/aiq/traderstips/traders-tips-january-2010.htm. Retrieved 17 January 2010.
- ^ Denning, Richard (January 2010). "January 2010 Stocks and Commodities Traders Tips". Traders Edge Systems. http://www.tradersedgesystems.com/aiq/traderstips/traders-tips-january-2010.htm. Retrieved 17 January 2010.
- ^ Liberty, Jez (April 2010). “Vortex Indicator In Trading Blox”. Technical Analysis of Stocks & Commodities 28(5), p. 76.
- ^ Liberty, Jez (February 2010). "Vortex indicator". Automated Trading System. http://www.automated-trading-system.com/free-code-improved-vortex/. Retrieved 11 November 2010.
External links
Concepts Support and resistance · Trend line · Breakout · Market trend · Dead cat bounce · Elliott wave principle · Fibonacci retracements · Pivot point · Dow theoryCharts Patterns Head and shoulders · Cup and handle · Double top and double bottom · Triple top and triple bottom · Broadening top · Price channels · Wedge pattern · Triangle · Flag and pennant · Island reversal · GapCandlestickSimpleComplexIndicators Average Directional Index (ADX) · Ichimoku Kinkō Hyō · Moving Average Convergence/Divergence (MACD) · Mass Index · Moving average (MA) · Parabolic SAR (SAR) · Smart Money Index (SMI) · Trix · Vortex Indicator (VI) · Know sure thing oscillator (KST)Relative Strength Index (RSI) · Stochastic oscillator · True Strength Index (TSI) · Williams %R (%R)VolumeAccumulation/Distribution Index · Money Flow Index (MFI) · On-balance volume (OBV) · Volume Price Trend (VPT) · Force Index (FI) · Negative volume index (NVI) · Ease of movement · Put/call ratio (PCR)OtherAdvance–decline line (ADL) · Commodity Channel Index (CCI) · Coppock curve · Keltner channel · McClellan oscillator · Ulcer Index · Ultimate oscillatorCategories:- Technical indicators
- First, calculate the current True Range:


Wikimedia Foundation. 2010.