- Maidstone Council election, 2007
-
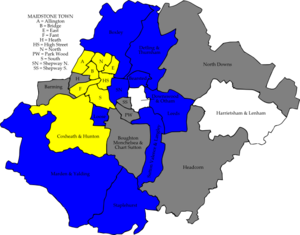 Map of the results of the 2007 Maidstone council election. Conservatives in blue, Liberal Democrats in yellow and independent in white. Wards in grey were not contested in 2007.
The 2007 Maidstone Council election took place on 3 May 2007 to elect members of Maidstone Borough Council in Kent, England. One third of the council was up for election and the council stayed under no overall control.[1]
After the election, the composition of the council was
- Conservative 26
- Liberal Democrat 21
- Labour 4
- Independent 4[2]
Contents
Background
Before the election the Conservatives were the largest party on the council with 27 seats, compared to 20 Liberal Democrats, 4 Labour and 4 independent councillors.[3] 20 seats were up for election, with 2 of these in Bridge and South wards being by-elections after the resignation of the previous councillors.[3]
The Conservatives held the seats of Detling and Thurnham and Sutton Valence and Langley without a contest after no other candidates stood in those seats.[3] In total 64 candidates stood in the election, comprising 20 Conservatives, 16 Liberal Democrats, 11 Green party, 10 Labour, 5 independents and 2 British National Party.[3] As well as the by-elections, 2 sitting councillors did not stand in the election, Liberal Democrat John Williams from Coxheath and Hunton ward and independent Janetta Sams from Harrietsham and Lenham ward.[3]
Election result
The results saw no party win a majority on the council after the Liberal Democrats made a net gain of 1 seat from the Conservatives.[4] This reduced the Conservatives to 26 seats and was a disappointment for them as Maidstone had been one of the party's top 10 targets in the 2007 local elections.[4] Overall turnout in the election was 37.68%.[3]
Maidstone Local Election Result 2007[3][5] Party Seats Gains Losses Net gain/loss Seats % Votes % Votes +/- Conservative 9 1 2 -1 45.0 49.2 15,968 +2.5% Liberal Democrat 9 2 1 +1 45.0 33.2 10,773 +2.5% Independent 2 0 0 0 10.0 5.4 1,762 -0.2% Labour 0 0 0 0 0 5.9 1,905 -5.3% Green 0 0 0 0 0 5.3 1,722 +0.8% BNP 0 0 0 0 0 1.0 329 +1.0% Ward results
Allington[3] Party Candidate Votes % ±% Liberal Democrat Cynthia Robertson 1,517 63.9 +1.3 Conservative Jeff Curwood 684 28.8 +2.6 Labour Marianna Poliszczuk 174 7.3 +1.3 Majority 833 35.1 -1.3 Turnout 2,375 42.7 +1.0 Liberal Democrat hold Swing Bearsted[3] Party Candidate Votes % ±% Conservative Allan Bradshaw 1,935 70.0 +28.7 Liberal Democrat Sheila Chittenden 510 18.5 +18.5 Green Edward Wallace 319 11.3 +6.8 Majority 1,425 51.6 Turnout 2,764 42.9 +0.4 Conservative hold Swing Boxley[3] Party Candidate Votes % ±% Conservative Malcolm Greer 1,415 67.2 +1.5 Liberal Democrat John Doherty 534 25.3 +1.5 BNP Gareth Veitch 158 7.5 +7.5 Majority 881 41.8 -0.1 Turnout 2,107 32.9 +4.3 Conservative hold Swing Bridge[3] Party Candidate Votes % ±% Liberal Democrat David Pickett 746 50.5 +12.8 Conservative Martin Cluett 611 41.4 -2.0 Green Andrew Waldie 120 8.1 -2.8 Majority 135 9.1 Turnout 1,477 34.7 +1.5 Liberal Democrat hold Swing Coxheath and Hunton[3] Party Candidate Votes % ±% Liberal Democrat Colin Parr 1,239 47.8 -0.3 Conservative John Wilson 1,221 47.1 +0.4 Labour Michael Casserley 130 5.0 -0.2 Majority 18 0.7 -0.8 Turnout 2,590 47.7 +5.6 Liberal Democrat hold Swing Detling and Thurnham[3] Party Candidate Votes % ±% Conservative John Horne unopposed Conservative hold Swing Downswood and Otham[3] Party Candidate Votes % ±% Independent David Marchant 405 50.8 -25.5 Independent Gordon Newton 230 28.9 +28.9 Conservative Mark Hodges 162 20.3 +1.6 Majority 175 22.0 -35.6 Turnout 797 37.9 +8.9 Independent hold Swing East[3] Party Candidate Votes % ±% Liberal Democrat David Naghi 1,386 54.1 +16.5 Conservative Jamie Devlin 912 35.6 -16.0 Labour Michael Beckwith 167 6.5 -0.3 Green James Shalice 97 3.8 +3.8 Majority 474 18.5 Turnout 2,562 41.4 +2.8 Liberal Democrat hold Swing Fant[3] Party Candidate Votes % ±% Liberal Democrat Nick Schnell 773 40.2 +2.9 Conservative James Ross 454 23.6 -2.5 Green Stuart Jeffery 342 17.8 +5.1 Labour Keith Adkinson 245 12.7 -4.4 Independent Carol Vizzard 109 5.7 -1.1 Majority 319 16.6 +5.5 Turnout 1,923 33.6 +4.3 Liberal Democrat hold Swing Harrietsham and Lenham[3] Party Candidate Votes % ±% Independent Tom Sams 941 45.8 +45.8 Conservative Gary Cooke 834 40.6 -16.9 Liberal Democrat Stephen Morris 230 11.2 +11.2 Green Sarah Goodwin 50 2.4 +2.4 Majority 107 5.2 Turnout 2,055 48.1 +7.0 Independent hold Swing High Street[3] Party Candidate Votes % ±% Liberal Democrat Fran Wilson 758 46.8 +0.6 Conservative Paul Butcher 533 32.9 -1.3 Labour Richard Coates 182 11.2 -1.3 Green Wendy Lewis 148 9.1 +9.1 Majority 225 13.9 +1.9 Turnout 1,621 27.8 +2.8 Liberal Democrat hold Swing Leeds[3] Party Candidate Votes % ±% Conservative Peter Parvin 639 84.7 +15.8 Labour Elizabeth Stevens 115 15.3 +2.3 Majority 524 69.5 +18.7 Turnout 754 40.1 -1.4 Conservative hold Swing Loose[3] Party Candidate Votes % ±% Conservative Ben Sherreard 413 50.4 +7.9 Liberal Democrat Hugh Laing 358 43.7 -8.2 Green Angela Wooi 48 5.9 +5.9 Majority 55 6.7 Turnout 819 44.5 +3.4 Conservative gain from Liberal Democrat Swing Marden and Yalding[3] Party Candidate Votes % ±% Conservative Annabelle Blackmore 1,324 62.7 -9.7 Liberal Democrat Carol Jacques 422 20.0 -7.6 Labour Edith Davis 216 10.2 +10.2 Green Ian McDonald 151 7.1 +7.1 Majority 902 42.7 -2.2 Turnout 2,113 36.5 +1.0 Conservative hold Swing North[3] Party Candidate Votes % ±% Liberal Democrat Marvyn Warner 973 54.0 -3.4 Conservative Jeff Tree 500 27.8 -0.4 Green Derek Eagle 145 8.1 +0.6 Labour Patrick Coates 106 5.9 -1.0 Independent Maureen Cleator 77 4.3 +4.3 Majority 473 26.3 -2.8 Turnout 1,801 32.0 -1.4 Liberal Democrat hold Swing Shepway North[3] Party Candidate Votes % ±% Conservative Marion Ring 989 53.8 +6.3 Labour James Carney 359 19.5 -4.3 Liberal Democrat Geoffrey Samme 201 10.9 +10.9 BNP William Hitches 171 9.3 +9.3 Green Stephen Muggeridge 119 6.5 -3.1 Majority 630 34.3 +10.6 Turnout 1,839 30.0 +0.1 Conservative hold Swing South (2)[3] Party Candidate Votes % ±% Liberal Democrat John Wilson 1,234 Liberal Democrat Ian Chittenden 1,139 Conservative Keith Andrews 1,113 Conservative Alan Chell 1,102 Green Penny Kemp 183 Turnout 4,771 40.7 Liberal Democrat gain from Conservative Swing Liberal Democrat gain from Conservative Swing Staplehurst[3] Party Candidate Votes % ±% Conservative Richard Lusty 1,127 70.1 +3.4 Liberal Democrat Thomas Burnham 270 16.8 -3.8 Labour John Randall 211 13.1 +0.4 Majority 857 53.3 +7.2 Turnout 1,608 35.7 -0.6 Conservative hold Swing Sutton Valence and Langley[3] Party Candidate Votes % ±% Conservative Paulina Stockell unopposed Conservative hold Swing References
- ^ "Maidstone". BBC News Online. http://news.bbc.co.uk/1/shared/vote2007/councils/html/29uh.stm. Retrieved 7 March 2011.
- ^ "National: Elections 2007: Town and country go to the polls". The Guardian: p. 6. 4 May 2007.
- ^ a b c d e f g h i j k l m n o p q r s t u v w x y z "Maidstone Borough Council Election Results - Thursday 3 May 2007". Maidstone Borough Council. http://www.maidstone.gov.uk/pdf/070503resultsheet_after.pdf. Retrieved 7 March 2011.
- ^ a b "Lib Dems victory in Prescott's back yard". The Press and Journal: p. 13. 4 May 2007.
- ^ "Results". The Times: p. 83. 5 May 2007.
Preceded by
Maidstone Council election, 2006Maidstone local elections Succeeded by
Maidstone Council election, 2008(2006 ←)  United Kingdom local elections, 2007 (→ 2008)
Metropolitan boroughs Barnsley · Birmingham · Bolton · Bradford · Bury · Calderdale · Coventry · Doncaster · Dudley · Gateshead · Kirklees · Knowsley · Leeds · Liverpool · Manchester · Newcastle upon Tyne · North Tyneside · Oldham · Rochdale · Rotherham · Salford · Sandwell · Sefton · Sheffield · Solihull · South Tyneside · St Helens · Stockport · Sunderland · Tameside · Trafford · Wakefield · Walsall · Wigan · Wirral · WolverhamptonUnitary authorities Bath and North East Somerset · Blackburn with Darwen · Blackpool · Bournemouth · Bracknell Forest · Brighton & Hove · Bristol · Darlington · Derby · East Riding of Yorkshire · Halton · Hartlepool · Herefordshire · Kingston upon Hull · Leicester · Luton · Medway · Middlesbrough · Milton Keynes · North East Lincolnshire · North Lincolnshire · North Somerset · Nottingham · Peterborough · Plymouth · Poole · Portsmouth · Reading · Redcar and Cleveland · Rutland · Slough · South Gloucestershire · Southampton · Southend-on-Sea · Stockton-on-Tees · Stoke-on-Trent · Swindon · Telford and Wrekin · Thurrock · Torbay · Warrington · West Berkshire · Windsor and Maidenhead · Wokingham · YorkDistrict councils Allerdale · Alnwick · Amber Valley · Arun · Ashfield · Ashford · Aylesbury Vale · Babergh · Barrow-in-Furness · Basildon · Basingstoke and Deane · Bassetlaw · Bedford · Berwick-upon-Tweed · Blaby · Blyth Valley · Bolsover · Boston · Braintree · Breckland · Brentwood · Bridgnorth · Broadland · Bromsgrove · Broxbourne · Broxtowe · Burnley · Cambridge · Cannock Chase · Canterbury · Caradon · Carlisle · Carrick · Castle Point · Castle Morpeth · Charnwood · Chelmsford · Cherwell · Chester · Chester-le-Street · Chesterfield · Chichester · Chiltern · Christchurch · Chorley · Colchester · Congleton · Copeland · Corby · Cotswold · Craven · Crawley · Crewe and Nantwich · Dacorum · Dartford · Daventry · Derbyshire Dales · East Hampshire · Eastleigh · Ellesmere Port and Neston · Elmbridge · Epping Forest · Exeter · Fenland · Fylde · Gedling · Gloucester · Guildford · Gravesham · Great Yarmouth · Harlow · Harrogate · Hart · Havant · Hertsmere · High Peak · Huntingdonshire · Hyndburn · Ipswich · Kettering · Lancaster · Macclesfield · Maidstone · Mole Valley · Newcastle-under-Lyme · North Devon · North West Leicestershire · Northampton · Norwich · Nuneaton and Bedworth · Pendle · Penwith · Preston · Purbeck · Redditch · Reigate and Banstead · Rochford · Rossendale · Rugby · Runnymede · Rushmoor · Ryedale · Scarborough · Sedgefield · Shepway · Shrewsbury and Atcham · South Bedfordshire · South Cambridgeshire · South Lakeland · South Ribble · St Albans · Stevenage · Stratford-on-Avon · Stroud · Swale · Tamworth · Tandridge · Three Rivers · Tonbridge and Malling · Tunbridge Wells · Tynedale · Warwick · Watford · Waveney · Welwyn Hatfield · West Lancashire · West Lindsey · West Oxfordshire · West Wiltshire · Weymouth and Portland · Winchester · Woking · Worcester · Worthing · Wyre · Wyre ForestScottish councils Aberdeen · Aberdeenshire · Angus · Argyll and Bute · Clackmannanshire · Dumfries and Galloway · Dundee City · East Ayrshire · East Dunbartonshire · East Lothian · East Renfrewshire · Edinburgh · Falkirk · Fife · Glasgow · Highland · Inverclyde · Midlothian · Moray · Comhairle nan Eilean Siar · North Ayrshire · North Lanarkshire · Orkney · Perth and Kinross · Renfrewshire · Scottish Borders · Shetland · South Ayrshire · South Lanarkshire · Stirling · West Dunbartonshire · West LothianCategories:- English local elections, 2007
- Council elections in Kent
- English District Council elections
- Maidstone (borough)

Wikimedia Foundation. 2010.