- Norfolk Council election, 2009
-
Norfolk Council election, 2009 
2005 ← 4 June 2009 → 2013 All 84 council division seats First party Second party Third party 


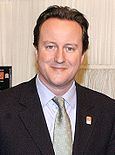
Leader David Cameron Nick Clegg Caroline Lucas Party Conservative Liberal Democrat Green Leader since 6 December 2005 18 December 2007 5 September 2008 Last election 47 seats
56.0%13 seats
15.5%2 seats
2.4%Seats won 60 13 7 Seat change +13 No change +5 Divisions Divisions +/– Fourth party 
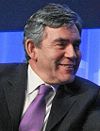
Leader Gordon Brown Party Labour Leader since 24 June 2007 Last election 22 seats
26.2%Seats won 3 Seat change -19 Divisions Divisions +/– The Nofolk Council election took place on 4 June 2009, coinciding with local elections for all county councils in England.
The Conservatives were re-elected with an increased majority and as in Suffolk and Kent the Liberal Democrats replaced Labour as the main opposition party. The Conservatives increased their majority on the Council from 10 to a comfortable 36 seats. They held virtually all of their seats across the county, but lost three seats to the Liberal Democrats in North Norfolk.
The Liberal Democrats had performed well in the North Norfolk area through making a net gain of 1 against the Conservatives, and gaining Theford West from Labour in Breckland, but lost seats to the Conservatives in West North & Kings Lynn and South Norfolk as the latter swept the board. In Norwich the party also lost Thorpe Hamlet and Mancroft to the Greens, but gained Lakenham from Labour. Despite the party's flat-lining, they became the official opposition to the governing Conservative administration.
Labour, just as had been the case across the rest of the country, suffered heavy losses to all parties and especially to the Conservatives. They ceased holding a majority of the seats in Norwich and were wiped out in West Norfolk & King's Lynn. In Great Yarmouth they held onto Magdalen and thus avoiding a complete wipe out across the area.
The Green party made great strides, particularly in Norwich where they won a majority of seats, which built upon their successes in City elections over the preceding years. They also pushed Labour into fourth place across the county in both terms of seats and vote share.
Contents
Summary of Results
Norfolk County Council election results 2009[1] Party Seats Gains Losses Net gain/loss Seats % Votes % Votes +/- Conservative 60 16 3 +13 71.4 45.9 115,363 +6.9 Liberal Democrat 13 5 5 0 15.5 22.7 57,053 -5.3 Green 7 5 0 +5 8.3 10.9 27,395 +5.9 Labour 3 0 19 -19 3.6 13.5 33,930 -13.5 UKIP 1 1 0 +1 1.2 4.6 11,561 Independents 0 0 0 ±0 0 1.4 3,518 BNP 0 0 0 ±0 0 0.9 2,262 Results by district
Breckland
Broadland
Acle division Party Candidate Votes % ±% Conservative Brian Iles Labour Anthony Hemmingway Liberal Democrat Jane Key Majority Aylsham division Party Candidate Votes % ±% Conservative Ian Graham Labour Deborah Kemp Liberal Democrat David Harrison Majority Drayton and Horsford division Party Candidate Votes % ±% Conservative Tony Adams Labour Michael Cox Liberal Democrat Peter Sergeant Green Rachel Heeds Majority Hellesdon division Party Candidate Votes % ±% Conservative Shelagh Gurney Labour Wendy Thorogood Liberal Democrat Peter Fish Green Jennifer Parkhouse UKIP John Youles Majority Hevingham and Spixworth division Party Candidate Votes % ±% Conservative Tony Williams Labour Richard Powell Liberal Democrat Daniel Roper Green Susan Curran Majority Old Catton division Party Candidate Votes % ±% Conservative Stuart Dunn Labour Kenneth Lashley Liberal Democrat Nigel Steane Green Thomas Wedge-Roberts UKIP Susan Sadler Majority Reepham division Party Candidate Votes % ±% Liberal Democrat James Joyce 1,426 52.5 +9.4 Conservative Simon Woodbridge 1,120 41.2 +4.3 Labour Christopher Jones 173 6.4 -13.7 Majority 306 11.3 +5.1 Sprowston division Party Candidate Votes % ±% Conservative John Ward Labour Barbara Lashley Liberal Democrat Corrine Russen Green James Dexter UKIP Glenn Tingle BNP Julia Howman Majority Taverham division Party Candidate Votes % ±% Conservative Stuart Clancy Labour Jason Bill Liberal Democrat Julia Holland Green Ben Duffy Majority Great Yarmouth
King's Lynn and West Norfolk
North Norfolk
Norwich
South Norfolk
References
- ^ "Norfolk council". BBC News Online. 19 April 2009. http://news.bbc.co.uk/1/shared/bsp/hi/elections/local_council/09/html/3869.stm. Retrieved 2009-06-05.
(2008 ←) United Kingdom local elections, 2009 (→ 2010) County council elections Buckinghamshire · Cambridgeshire · Cumbria · Derbyshire · Devon · Dorset · East Sussex · Essex · Gloucestershire · Hampshire · Hertfordshire · Kent · Lancashire · Leicestershire · Lincolnshire · Norfolk · North Yorkshire · Northamptonshire · Nottinghamshire · Oxfordshire · Somerset · Staffordshire · Suffolk · Surrey · Warwickshire · West Sussex · Worcestershire
Mayoral elections Unitary authorities Bold indicates a new unitary authority. Stoke-on-Trent cancelled mayoral election after abolishing mayoral system. Categories:- English local elections, 2009
- English county council elections
- Council elections in Norfolk
Wikimedia Foundation. 2010.
