- North Atlantic tropical cyclone
-
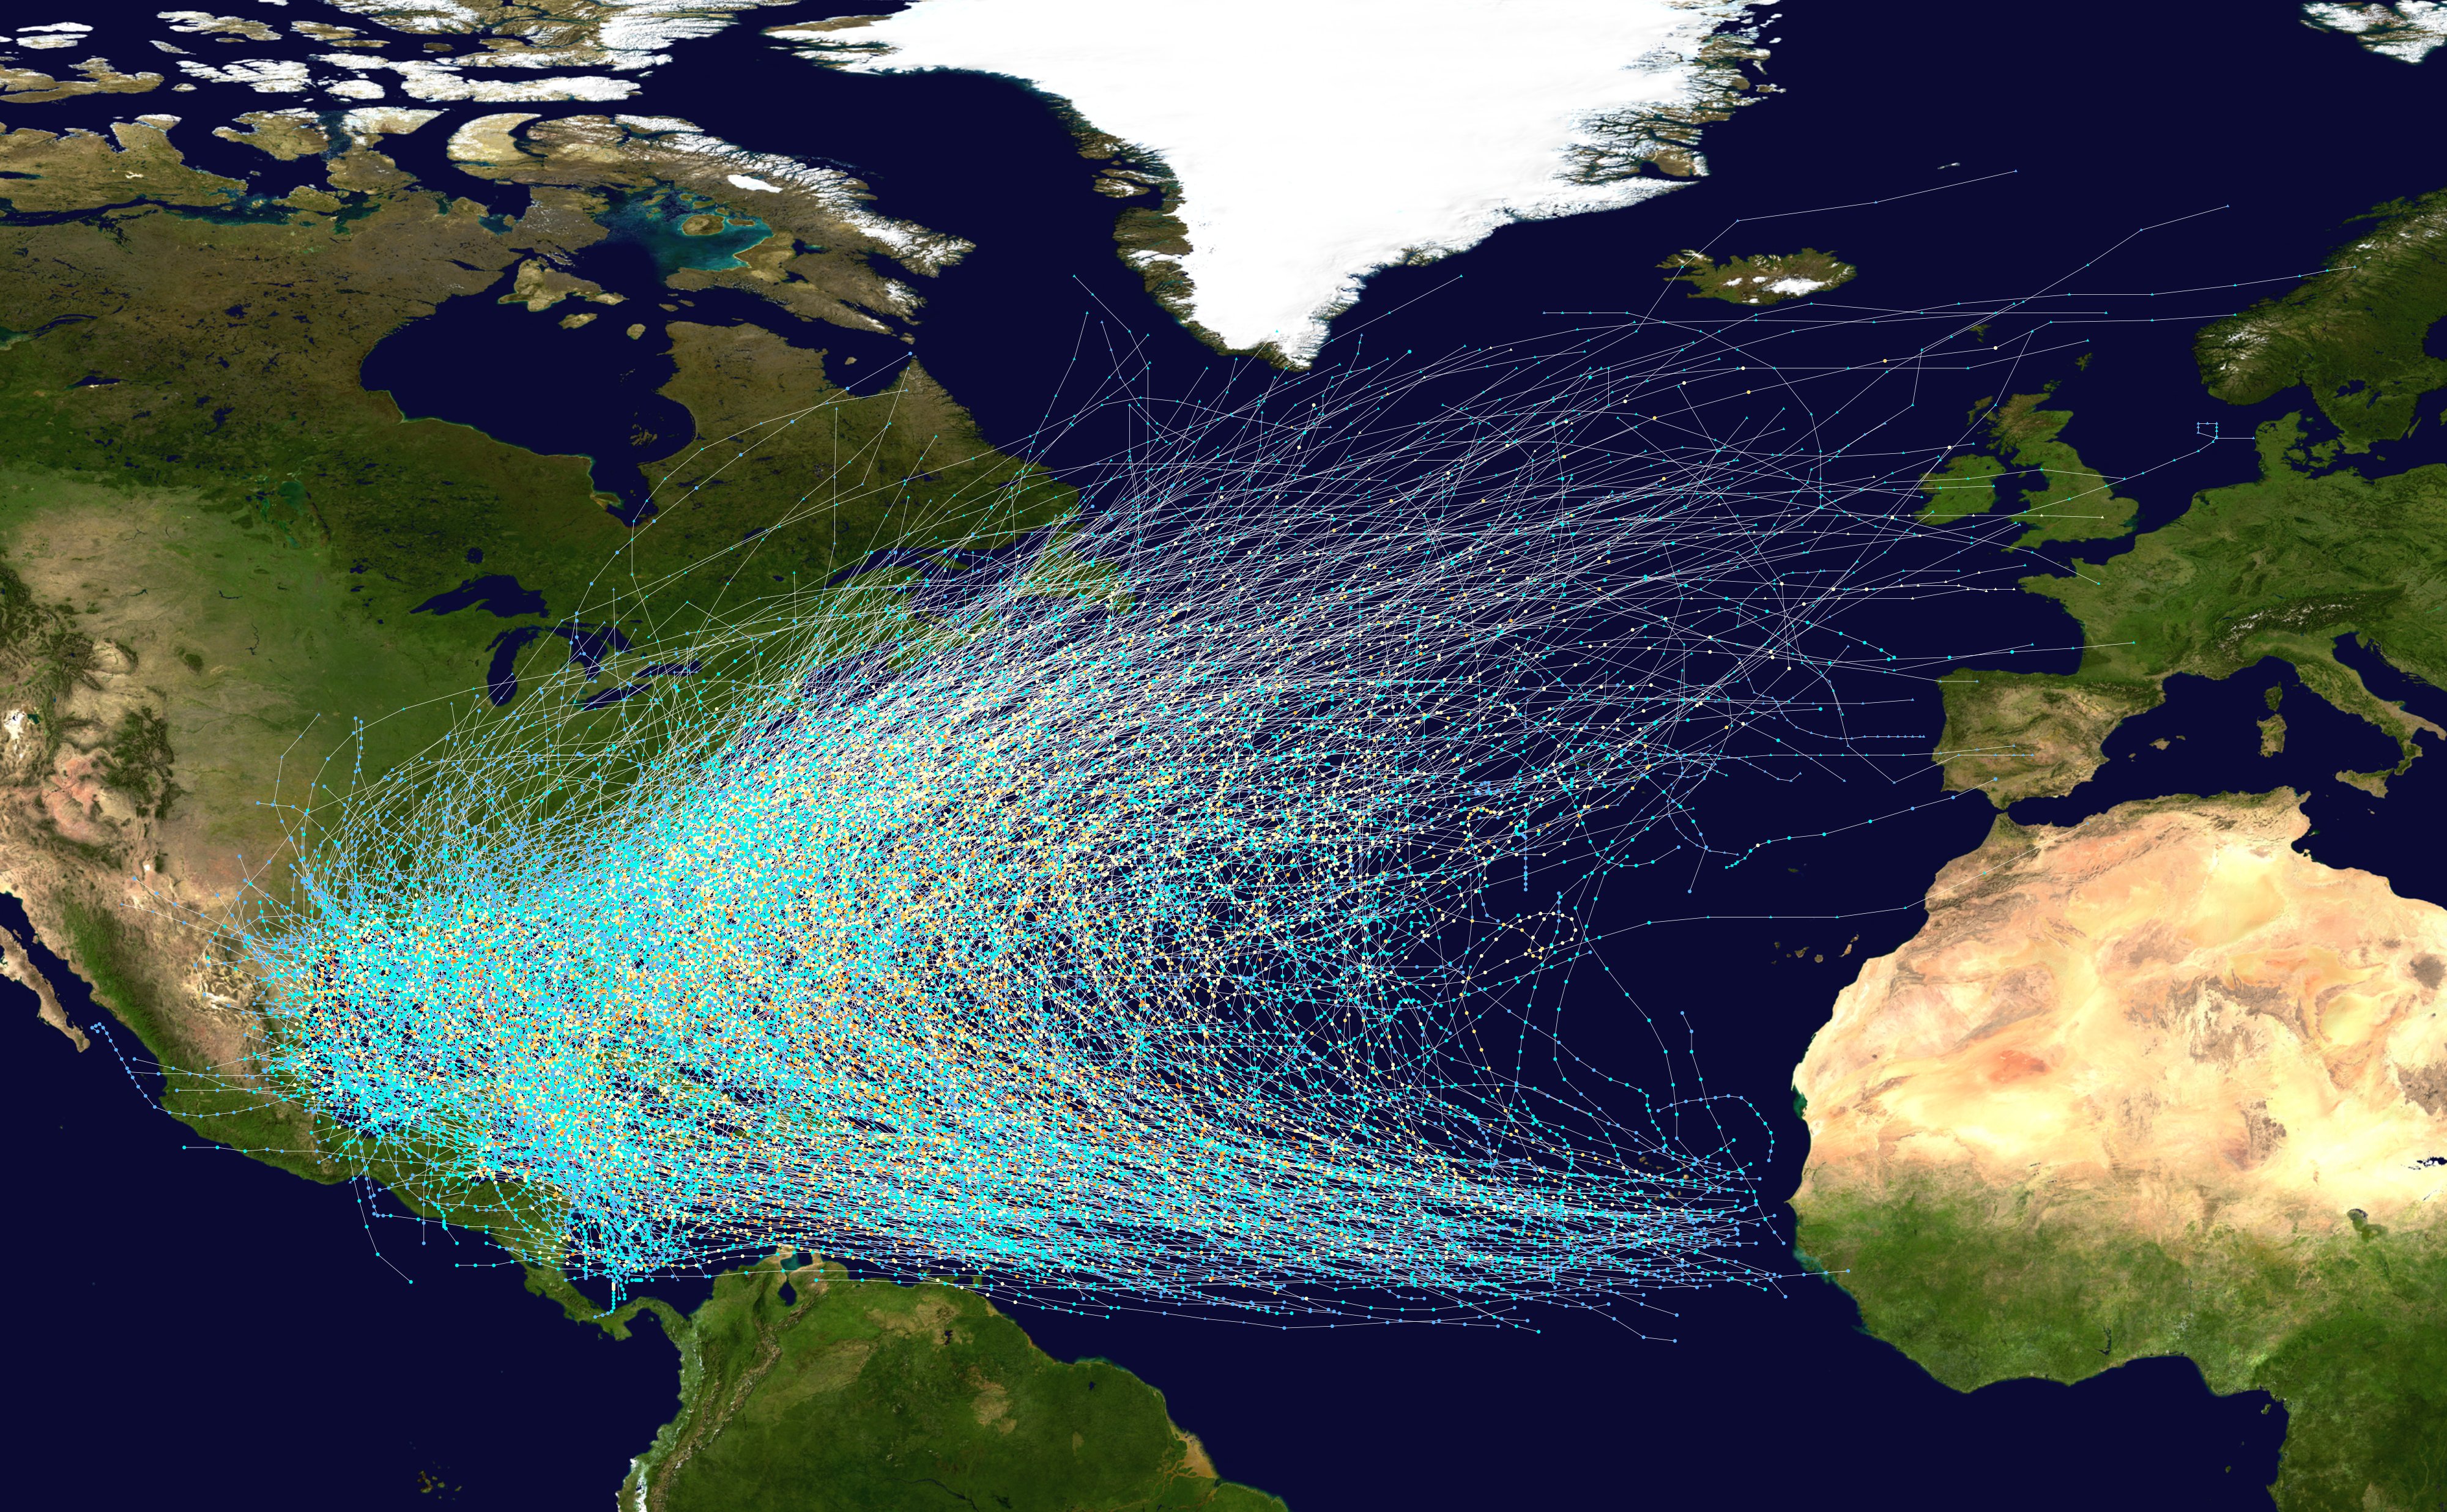
 Tracks of Atlantic tropical cyclones
(1851—2005)North Atlantic tropical cyclones usually form in the northern hemisphere summer or fall. Tropical cyclones can be categorized by intensity. Tropical storms have one-minute maximum sustained winds of at least 39 mph (34 knots, 17 m/s, 63 km/h), while hurricanes have one-minute maximum sustained exceeding 74 mph (64 knots, 33 m/s, 119 km/h).[1] Most Atlantic tropical storms and hurricanes form between June 1 and November 30.[2] The United States National Hurricane Center monitors the basin and issues reports, watches and warnings about tropical weather systems for the Atlantic Basin as one of the Regional Specialized Meteorological Centers for tropical cyclones as defined by the World Meteorological Organization.[3]
Tropical disturbances that reach tropical storm intensity are named from a predetermined list. Hurricanes that result in significant damage or casualties may have their names retired from the list at the request of the affected nations in order to prevent confusion should a subsequent storm be given the same name.[4] On average, in the North Atlantic basin (from 1966 to 2009) 11.3 named storms occur each season, with an average of 6.2 becoming hurricanes and 2.3 becoming major hurricanes (Category 3 or greater).[5] The climatological peak of activity is around September 10 each season.[6]
Contents
Steering factors
 The subtropical ridge (in the Pacific) shows up as a large area of black (dryness) on this water vapor satellite image from September 2000
Tropical cyclones are steered by the surrounding flow throughout the depth of the troposphere (the atmosphere from the surface to about eight miles (12 km) high). Neil Frank, former director of the United States National Hurricane Center, used the analogies such as "a leaf carried along in a stream" or a "brick moving through a river of air" to describe the way atmospheric flow affects the path of a hurricane across the ocean. Specifically, air flow around high pressure systems and toward low pressure areas influence hurricane tracks.
In the tropical latitudes, tropical storms and hurricanes generally move westward with a slight tend toward the north, under the influence of the subtropical ridge, a high pressure system that usually extends east-west across the subtropics.[7] South of the subtropical ridge, surface easterly winds (blowing from east to west) prevail. If the subtropical ridge is weakened by an upper trough, a tropical cyclone may turn poleward and then recurve,[8] or curve back toward the northeast into the main belt of the Westerlies. Poleward (north) of the subtropical ridge, westerly winds prevail and generally steer tropical cyclones that reach northern latitudes toward the east. The westerlies also steer extratropical cyclones with their cold and warm fronts from west to east.[9]
Climatology
See also: Tropical cyclogenesisTotal and Average Number of
Tropical Storms by Month (1851–2009)Month Total Average January — April 5 <0.05 May 18 0.1 June 80 0.5 July 109 0.7 August 352 2.2 September 540 3.4 October 314 2.0 November 85 0.5 December 16 0.1 Source: NOAA FAQ[10] Climatology does serve to characterize the general properties of an average season and can be used as one of many other tools for making forecasts. Most storms form in warm waters several hundred miles north of the equator near the Intertropical convergence zone from tropical waves. The Coriolis force is usually too weak to initiate sufficient rotation near the equator.[11] Storms frequently form in the warm waters of the Gulf of Mexico, the Caribbean Sea, and the tropical Atlantic Ocean as far east as the Cape Verde Islands, the origin of strong and long-lasting Cape Verde-type hurricanes. Systems may also strengthen over the Gulf Stream off the coast of the eastern United States, wherever water temperatures exceed 26.5 °C (79.7 °F).[11]
Although most storms are found within tropical latitudes, occasionally storms will form further north and east from disturbances other than tropical waves such as cold fronts and upper-level lows. There is a strong correlation between Atlantic hurricane activity in the tropics and the presence of an El Niño or La Niña in the Pacific Ocean. El Niño events increase the wind shear over the Atlantic, producing a less-favorable environment for formation and decreasing tropical activity in the Atlantic basin. Conversely, La Niña causes an increase in activity due to a decrease in wind shear.[12]
According to the Azores High hypothesis by Kam-biu Liu, an anti-phase pattern is expected to exist between the Gulf of Mexico coast and the North American Atlantic coast. During the quiescent periods (3000–1400 BC, and 1000 AD to present), a more northeasterly position of the Azores High would result in more hurricanes being steered towards the Atlantic coast. During the hyperactive period (1400 BC to 1000 AD), more hurricanes were steered towards the Gulf coast as the Azores High was shifted to a more southwesterly position near the Caribbean.[13][14] Such a displacement of the Azores High is consistent with paleoclimatic evidence that shows an abrupt onset of a drier climate in Haiti around 3200 14C years BP,[15] and a change towards more humid conditions in the Great Plains during the late-Holocene as more moisture was pumped up the Mississippi Valley through the Gulf coast. Preliminary data from the northern Atlantic coast seem to support the Azores High hypothesis. A 3000-year proxy record from a coastal lake in Cape Cod suggests that hurricane activity has increased significantly during the past 500–1000 years, just as the Gulf coast was amid a quiescent period of the last millennium.
June
 Typical locations and tracks of tropical systems in June. Blue is likely, green more likely, and orange most likely.
The beginning of the hurricane season is most closely related to the timing of increases in sea surface temperatures, convective instability, and other thermodynamic factors.[16] Although this month marks the beginning of the hurricane season, the month of June generally sees little activity, with an average of about 1 tropical cyclone every 2 years. Tropical systems usually form in the Gulf of Mexico or off the east coast of the United States.[17]
Since 1851, a total of 81 tropical storms and hurricanes have formed in the month of June. During this period, two of these systems developed in the deep tropics.[18] Since 1870, three major hurricanes have formed during the month, the most notable of which was Category 4 Hurricane Audrey in 1957. Audrey is the earliest forming Category 4 hurricane in the basin and for 48 years, Before Hurricanes Dennis and Emily of 2005, the latter a Category 5 hurricane, it was the strongest pre-August tropical cyclone.[19] The esternmost forming storm during June was Tropical Storm Ana in 1979, forming at 45°W.[18]
July
 Typical locations and tracks in July.
Not much tropical activity occurs during the month of July, but the majority of hurricane seasons see the formation of one tropical cyclone during July. Using data from 1944 to 1996, on average, half of the hurricane seasons had their first tropical storm by July 11, with a second having formed by August 8.[6]
Formation usually occurs in the eastern Caribbean Sea around the Lesser Antilles, in the northern and eastern parts of the Gulf of Mexico, in the vicinity of the northern Bahamas, and off the coast of The Carolinas and Virginia over the Gulf Stream. Storms travel westward through the Caribbean and then either move towards the north and curve near the eastern coast of the United States or stay on a north-westward track and enter the Gulf of Mexico.[17]
Since 1851, a total of 105 tropical storms have formed during the month of July.[20] Since 1870, ten of these storms became major hurricanes, the strongest of which was Hurricane Emily of 2005. This storm is the only known Category 5 hurricane during July, becoming the earliest forming cyclone of this intensity in the basin.[19][21] The easternmost forming storm and longest lived during the month was Hurricane Bertha in 2008, forming at 22.9°W and lasting for just over 17 days.[22]
August
 Typical locations and tracks in August.
Decrease in wind shear from July to August produces a significant increase of tropical activity.[23] An average of 2.8 tropical storms develop annually in August. On average, four named systems and one hurricane occur by August 30, and by September 4, the Atlantic ocean has spawned its first major hurricane.[6]
September
 Typical locations and tracks in September.
The peak of the hurricane season occurs in September and corresponds to low wind shear [23] and the warmest sea surface temperatures.[24] The month of September sees an average of 3 storms a year. By September 24, the average season sees 7 named systems, 4 of which are hurricanes. In addition, two major hurricanes occur on average by September 28 (though these may not necessarily make landfall).[6]
October
 Typical locations and tracks in October.
The favorable conditions found during September begin to decay in October. The main reason for the decrease in activity is increasing wind shear, although sea surface temperatures are cooler than in September.[16] Activity falls off markedly, with 1.8 cyclones developing on average, though there is a climatological secondary peak around October 20.[25] By October 21, the average season is expected to have 9 named storms with 5 hurricanes. A third major hurricane would be expected sometime between September 28 and the end of the year for half of all seasons.[6] In contrast to mid-season activity, the mean locus of formation shifts westward to the Caribbean and Gulf of Mexico, a reverse trend to the eastward progression of June through August.[17]
November
 Typical locations and tracks in November.
Wind shear from westerlies increases substantially through November, generally preventing cyclone formation.[16] On average, one storm forms during November every other year. On rare occasions, a major hurricane forms, such as Category 4 Hurricane Lenny in 1999, which formed in mid November, Hurricane Kate, a Category 3 which formed in late November 1985 (the latest major hurricane on record),[17] and Hurricane Paloma, which formed in early November 2008.
December to May
Further information: Off-season storms Probability of a tropical cyclone of tropical storm or hurricane strength at a specific date, expressed as systems per 100 years
Although the hurricane season is defined as beginning on June 1 and ending on November 30, there have been several off-season storms.[17] Since 1870, there have been 32 off-season cyclones, 18 of which occurred in May. In the same time span, nine storms formed in December, two in April and one each in January, February and March.[19] Four seasons, 1887,[26] 1953,[27] 2003[28] and 2007 have had storms form both before and after the official hurricane season.[29] In 1887, there were four storms that occurred outside the season, the most in a single year.[26] High vertical wind shear and low sea surface temperatures generally preclude formation.[6]
Tropical cyclones have been monitored in all months;[19] however, no tropical systems have formed in January. Two tropical cyclones have existed during the month, both of which formed in late December. The first was the second Hurricane Alice in 1954 and more recently, Tropical Storm Zeta in 2005. The only system to form during the month was a subtropical storm during the 1978 season.[17] The strongest storm outside the hurricane season was Hurricane Able in 1951. This storm attained Category 3 status on May 21, the earliest date a storm has reached major hurricane status on record.[30]
Extremes
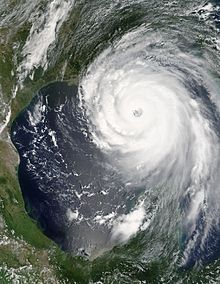 Hurricane Katrina was the costliest and one of the five deadliest hurricanes in the history of the United States, costing over 1800 lives and $81.2 billion USD.See also: List of Atlantic hurricane records
- The season in which the most tropical storms formed on record was the 2005 Atlantic hurricane season (28). That season was also the one in which the most hurricanes formed on record (15).[17]
- The 1950 Atlantic hurricane season had the most major hurricanes on record (8).[17]
- The least active season on record since 1944 (when the database is considered more reliable) was the 1983 Atlantic hurricane season, with one tropical storm, two hurricanes, and one major hurricane. Overall, the 1914 Atlantic hurricane season remains the least active, with only one documented storm.[17]
- The most intense hurricane (by barometric pressure) on record to form in the North Atlantic basin was Hurricane Wilma (2005) (882 mbar).[17]
- The longest-lasting hurricane was the San Ciriaco Hurricane of 1899 (28 days).[17]
- The fastest-moving hurricane was Hurricane Emily (1987) at 69 mph.[17]
- The most tornadoes spawned by a hurricane was 127 by Hurricane Ivan (2004 season).[17]
- The strongest landfalling hurricane was the Labor Day Hurricane of 1935 (892 hPa).[17]
- The deadliest hurricane was the Great Hurricane of 1780 (22,000 fatalities).[31]
- The deadliest hurricane to make landfall on the continental United States was the Galveston Hurricane in 1900 which may have killed up to 12,000 people.[32]
- The most damaging hurricane (adjusted for inflation) was Hurricane Katrina of the 2005 season which caused $81.2 billion in damages (2005 USD).[33]
- The quickest forming hurricane was Hurricane Humberto in 2007. It was a minimal hurricane that formed and intensified faster than any other tropical cyclone on record before landfall. Developing on September 12, 2007, in the northwestern Gulf of Mexico, the cyclone rapidly strengthened and struck High Island, Texas, with winds of about 90 mph (150 km/h) early on September 13.
Trends
-
See also: Atlantic hurricane reanalysis
 Atlantic Multidecadal Cycle since 1950, using accumulated cyclone energy (ACE)
 Atlantic Multidecadal Oscillation Timeseries, 1856–2009
While the number of storms in the Atlantic has increased since 1995, there is no obvious global trend. The annual number of tropical cyclones worldwide remains about 87 ± 10. However, the ability of climatologists to make long-term data analysis in certain basins is limited by the lack of reliable historical data in some basins, primarily in the Southern Hemisphere.[34] In spite of that, there is some evidence that the intensity of hurricanes is increasing. Kerry Emanuel stated, "Records of hurricane activity worldwide show an upswing of both the maximum wind speed in and the duration of hurricanes. The energy released by the average hurricane (again considering all hurricanes worldwide) seems to have increased by around 70% in the past 30 years or so, corresponding to about a 15% increase in the maximum wind speed and a 60% increase in storm lifetime."[35] Emanuel theorized at the time that increased heat from global warming was driving this trend. However, some argue that Emanuel's own research in 2008 refuted this theory and others contend that the trend does not exist at all, but is instead a figment created by faulty readings from primitive 1970s-era measurement equipment.[citation needed] Vecchi and Knutson (2008) found a weakly positive, though not statistically significant trend in the number of North Atlantic tropical cyclones for 1878–2006, but also a surprisingly strong decrease in cyclone duration over this period.[36]
Atlantic storms are becoming more destructive financially, since five of the ten most expensive storms in United States history have occurred since 1990. According to the World Meteorological Organization, “recent increase in societal impact from tropical cyclones has largely been caused by rising concentrations of population and infrastructure in coastal regions.”[37] Pielke et al. (2008) normalized mainland U.S. hurricane damage from 1900–2005 to 2005 values and found no remaining trend of increasing absolute damage. The 1970s and 1980s were notable because of the extremely low amounts of damage compared to other decades. The decade 1996–2005 has the second most damage among the past 11 decades, with only the decade 1926–1935 surpassing its costs. The most damaging single storm is the 1926 Miami hurricane, with $157 billion of normalized damage.[38]
Often in part because of the threat of hurricanes, many coastal regions had sparse population between major ports until the advent of automobile tourism; therefore, the most severe portions of hurricanes striking the coast may have gone unmeasured in some instances. The combined effects of ship destruction and remote landfall severely limit the number of intense hurricanes in the official record before the era of hurricane reconnaissance aircraft and satellite meteorology. Although the record shows a distinct increase in the number and strength of intense hurricanes, therefore, experts regard the early data as suspect.[39] Christopher Landsea et al. estimated an undercount bias of zero to six tropical cyclones per year between 1851 and 1885 and zero to four per year between 1886 and 1910. These undercounts roughly take into account the typical size of tropical cyclones, the density of shipping tracks over the Atlantic basin, and the amount of populated coastline.[40]
The number and strength of Atlantic hurricanes may undergo a 50–70 year cycle, also known as the Atlantic Multidecadal Oscillation.[41] Nyberg et al. reconstructed Atlantic major hurricane activity back to the early 18th century and found five periods averaging 3–5 major hurricanes per year and lasting 40–60 years, and six other averaging 1.5–2.5 major hurricanes per year and lasting 10–20 years. These periods are associated with the Atlantic multidecadal oscillation. Throughout, a decadal oscillation related to solar irradiance was responsible for enhancing/dampening the number of major hurricanes by 1–2 per year.[42]
Although more common since 1995, few above-normal hurricane seasons occurred during 1970–94.[43] Destructive hurricanes struck frequently from 1926–60, including many major New England hurricanes. Twenty-one Atlantic tropical storms formed in 1933, a record only recently exceeded in 2005, which saw 28 storms. Tropical hurricanes occurred infrequently during the seasons of 1900–25; however, many intense storms formed during 1870–99. During the 1887 season, 19 tropical storms formed, of which a record 4 occurred after November 1 and 11 strengthened into hurricanes. Few hurricanes occurred in the 1840s to 1860s; however, many struck in the early 19th century, including an 1821 storm that made a direct hit on New York City. Some historical weather experts say these storms may have been as high as Category 4 in strength.[44]
These active hurricane seasons predated satellite coverage of the Atlantic basin. Before the satellite era began in 1960, tropical storms or hurricanes went undetected unless a reconnaissance aircraft encountered one, a ship reported a voyage through the storm, or a storm hit land in a populated area.[39] The official record, therefore, could miss storms in which no ship experienced gale-force winds, recognized it as a tropical storm (as opposed to a high-latitude extra-tropical cyclone, a tropical wave, or a brief squall), returned to port, and reported the experience.
Proxy records based on paleotempestological research have revealed that major hurricane activity along the Gulf of Mexico coast varies on timescales of centuries to millennia.[13][14][45] Few major hurricanes struck the Gulf coast during 3000–1400 BC and again during the most recent millennium. These quiescent intervals were separated by a hyperactive period during 1400 BC and 1000 AD, when the Gulf coast was struck frequently by catastrophic hurricanes and their landfall probabilities increased by 3–5 times. This millennial-scale variability has been attributed to long-term shifts in the position of the Azores High,[14] which may also be linked to changes in the strength of the North Atlantic Oscillation.[46]
According to the Azores High hypothesis, an anti-phase pattern is expected to exist between the Gulf of Mexico coast and the Atlantic coast. During the quiescent periods, a more northeasterly position of the Azores High would result in more hurricanes being steered towards the Atlantic coast. During the hyperactive period, more hurricanes were steered towards the Gulf coast as the Azores High was shifted to a more southwesterly position near the Caribbean. Such a displacement of the Azores High is consistent with paleoclimatic evidence that shows an abrupt onset of a drier climate in Haiti around 3200 14C years BP,[15] and a change towards more humid conditions in the Great Plains during the late-Holocene as more moisture was pumped up the Mississippi Valley through the Gulf coast. Preliminary data from the northern Atlantic coast seem to support the Azores High hypothesis. A 3000-year proxy record from a coastal lake in Cape Cod suggests that hurricane activity increased significantly during the past 500–1000 years, just as the Gulf coast was amid a quiescent period of the last millennium.
See also
- List of Atlantic hurricanes
- List of Atlantic hurricane seasons
- South Atlantic tropical cyclone
- List of named tropical cyclones
- Hebert Box
- Mediterranean tropical cyclone
- Pacific hurricane
- Pacific typhoon
- Western Hemisphere Warm Pool
References
- ^ National Hurricane Center. Glossary of NHC/TPC Terms. Retrieved on 2006-10-28.
- ^ Chris Landsea. Subject: E16- When did the earliest and latest hurricanes occur? Retrieved on 2008-06-10.
- ^ World Meteorological Organization (April 25, 2006). "RSMCs". Tropical Cyclone Programme (TCP). http://severe.worldweather.wmo.int/rsmcs.html. Retrieved 2006-11-05.
- ^ NOAA The Retirement of Hurricane Names. Retrieved on 2008-06-10.
- ^ http://www.nhc.noaa.gov/pastprofile.shtml
- ^ a b c d e f National Hurricane Center. Tropical Cyclone Climatology. Retrieved on 2008-06-10.
- ^ Atlantic Oceanographic and Meteorological Laboratory, Hurricane Research Division. "Frequently Asked Questions: What determines the movement of tropical cyclones?". NOAA. http://www.aoml.noaa.gov/hrd/tcfaq/G6.html. Retrieved 2006-07-25.
- ^ U. S. Navy. Section 2: Tropical Cyclone Motion Terminology. Retrieved on 2007-04-10.
- ^ Hurricane Research Division. Frequently Asked Questions: Subject G6) What determines the movement of tropical cyclones? Retrieved on 2006-10-28.
- ^ "TC FAQ: E17: How many hurricanes have there been in each month?". Atlantic Oceanographic and Meteorological Laboratory. National Oceanic and Atmospheric Administration. 2010-04-22. http://www.aoml.noaa.gov/hrd/tcfaq/E17.html. Retrieved 2010-06-15.
- ^ a b Atlantic Oceanographic and Meteorological Laboratory, Hurricane Research Division. "Frequently Asked Questions: How do tropical cyclones form?". NOAA. http://www.aoml.noaa.gov/hrd/tcfaq/A15.html. Retrieved 2006-07-26.
- ^ Marc C. Cove, James J. O'Brien, et al. Effect of El Niño on U.S. Landfalling Hurricanes, Revisited. Retrieved on 2006-10-28.
- ^ a b Liu, Kam-biu (1999). "Millennial-scale variability in catastrophic hurricane landfalls along the Gulf of Mexico coast". 23d Conf. on Hurricanes and Tropical Meteorology. Dallas, TX: Amer. Meteor. Soc.. pp. 374–377.
- ^ a b c Liu, Kam-biu; Fearn, Miriam L. (2000). "Reconstruction of Prehistoric Landfall Frequencies of Catastrophic Hurricanes in Northwestern Florida from Lake Sediment Records". Quaternary Research 54 (2): 238–245. Bibcode 2000QuRes..54..238L. doi:10.1006/qres.2000.2166.
- ^ a b Higuera-Gundy, Antonia; et al. (1999). "A 10,300 14C yr Record of Climate and Vegetation Change from Haiti". Quaternary Research 52 (2): 159–170. Bibcode 1999QuRes..52..159H. doi:10.1006/qres.1999.2062.
- ^ a b c William M. Gray and Philip J. Klotzbach. SUMMARY OF 2005 ATLANTIC TROPICAL CYCLONE ACTIVITY AND VERIFICATION OF AUTHOR’S SEASONAL AND MONTHLY FORECASTS. Retrieved on 2006-10-28.
- ^ a b c d e f g h i j k l m n National Hurricane Center.Atlantic Hurricane Database. Retrieved on 2008-06-10.
- ^ a b USDC and NOAA (2009) Historical Climatology Series 6-2 Tropical Cyclones of the North Atlantic Ocean 1851-2006 pp. 212
- ^ a b c d USDC and NOAA (2009) Historical Climatology Series 6-2 Tropical Cyclones of the North Atlantic Ocean 1851-2006 pp. 27
- ^ USDC and NOAA (2009) Historical Climatology Series 6-2 Tropical Cyclones of the North Atlantic Ocean 1851-2006 pp. 213
- ^ USDC and NOAA (2009) Historical Climatology Series 6-2 Tropical Cyclones of the North Atlantic Ocean 1851-2006 pp. 200
- ^ USDC and NOAA (2009) Historical Climatology Series 6-2 Tropical Cyclones of the North Atlantic Ocean 1851-2006 pp. 203
- ^ a b Anantha R. Aiyyer. Climatology of Vertical Wind Shear Over the Tropical Atlantic. Retrieved on 2006-10-28.
- ^ Chris Landsea. Frequently Asked Questions: G5) Why do tropical cyclones occur primarily in the summer and autumn? Retrieved on 2006-10-28.
- ^ NOAA. Graph showing average activity during the hurricane Season. Retrieved on 2006-10-28.
- ^ a b USDC and NOAA (2009) Historical Climatology Series 6-2 Tropical Cyclones of the North Atlantic Ocean 1851-2006 pp. 82
- ^ USDC and NOAA (2009) Historical Climatology Series 6-2 Tropical Cyclones of the North Atlantic Ocean 1851-2006 pp. 148
- ^ USDC and NOAA (2009) Historical Climatology Series 6-2 Tropical Cyclones of the North Atlantic Ocean 1851-2006 pp. 198
- ^ USDC and NOAA (2009) Historical Climatology Series 6-2 Tropical Cyclones of the North Atlantic Ocean 1851-2006 pp. 202
- ^ USDC and NOAA (2009) Historical Climatology Series 6-2 Tropical Cyclones of the North Atlantic Ocean 1851-2006 pp. 146
- ^ Edward N. Rappaport and Jose Fernandez-Partagas. The Deadliest Atlantic Tropical Cyclones, 1492-1996. Retrieved on 2008-06-10.
- ^ http://www.aoml.noaa.gov/hrd/Landsea/deadly/Table2.htm
- ^ Eric S. Blake, Edward N. Rappaport, and Chris Landsea. The Dealiest, Costliest, and Most Intense United States Tropical Cyclones From 1851 to 2006 (and other frequently requested hurricane facts). Retrieved on 2008-03-19.
- ^ Landsea, Chris, et al. (July 28, 2006). "Can We Detect Trends in Extreme Tropical Cyclones?" (PDF). Science 313 (5786): 452–454. doi:10.1126/science.1128448. PMID 16873634. http://www.aoml.noaa.gov/hrd/Landsea/landseaetal-science06.pdf. Retrieved 2007-06-09.
- ^ Emanuel, Kerry (January 2006). "Anthropogenic Effects on Tropical Cyclone Activity". http://wind.mit.edu/~emanuel/anthro2.htm. Retrieved 2006-03-30.
- ^ Vecchi, Gabriel A.; Knutson, Thomas R. (2008). "On Estimates of Historical North Atlantic Tropical Cyclone Activity". Journal of Climate 21 (14): 3580–3600. Bibcode 2008JCli...21.3580V. doi:10.1175/2008JCLI2178.1.
- ^ "Summary Statement on Tropical Cyclones and Climate Change" (PDF) (Press release). World Meteorological Organization. 2006-12-04. http://www.wmo.int/pages/prog/arep/press_releases/2006/pdf/iwtc_summary.pdf.
- ^ Pielke, Roger A., Jr.; et al. (2008). "Normalized Hurricane Damage in the United States: 1900–2005" (PDF). Natural Hazards Review 9 (1): 29–42. doi:10.1061/(ASCE)1527-6988(2008)9:1(29). http://forecast.mssl.ucl.ac.uk/shadow/docs/Pielkeetal2006a.pdf.
- ^ a b Neumann, Charles J.. "1.3: A Global Climatology". Global Guide to Tropical Cyclone Forecasting. Bureau of Meteorology. http://www.bom.gov.au/bmrc/pubs/tcguide/ch1/ch1_3.htm. Retrieved 2006-11-30.
- ^ Landsea, C. W.; et al. (2004). "The Atlantic hurricane database re-analysis project: Documentation for the 1851–1910 alterations and additions to the HURDAT database". In Murname, R. J.; Liu, K.-B.. Hurricanes and Typhoons: Past, Present and Future. New York: Columbia University Press. pp. 177–221. ISBN 0231123884.
- ^ Chylek, Petr; Lesins, Glen (2008). "Multidecadal variability of Atlantic hurricane activity: 1851–2007". Journal of Geophysical Research: Atmospheres 113: D22106. Bibcode 2008JGRD..11322106C. doi:10.1029/2008JD010036.
- ^ Nyberg, J.; Winter, A.; Malmgren, B. A. (2005). "Reconstruction of Major Hurricane Activity". Eos Trans. AGU 86 (52, Fall Meet. Suppl.): Abstract PP21C–1597. http://www.agu.org/cgi-bin/wais?dd=PP21C-1597.
- ^ Risk Management Solutions (March 2006). "U.S. and Caribbean Hurricane Activity Rates." (PDF). http://www.rms.com/Publications/60HUActivityRates_whitepaper.pdf. Retrieved 2006-11-30.
- ^ Center for Climate Systems Research. "Hurricanes, Sea Level Rise, and New York City". Columbia University. Archived from the original on 2007-01-02. http://web.archive.org/web/20070102092224/http://www.ccsr.columbia.edu/information/hurricanes/. Retrieved 2006-11-29.
- ^ McCloskey, T. A.; Knowles, J. T. (2009). "Migration of the tropical cyclone zone throughout the Holocene". In Elsner, J. B.; Jagger, T. H.. Hurricanes and Climate Change. New York: Springer. ISBN 9780387094090.
- ^ Elsner, James B.; Liu, Kam-biu; Kocher, Bethany (2000). "Spatial Variations in Major U.S. Hurricane Activity: Statistics and a Physical Mechanism". Journal of Climate 13 (13): 2293–2305. Bibcode 2000JCli...13.2293E. doi:10.1175/1520-0442(2000)013<2293:SVIMUS>2.0.CO;2.
External links
Categories:- Atlantic hurricanes
- Tropical cyclone meteorology


Wikimedia Foundation. 2010.