- North Devon Council election, 2003
-
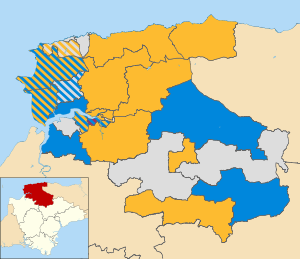 Map of the results of the 2003 North Devon council election. Liberal Democrats in yellow, Conservatives in blue, independent in grey and United Kingdom Independence Party in purple.
The 2003 North Devon Council election took place on 1 May 2003 to elect members of North Devon District Council in Devon, England. The whole council was up for election with boundary changes since the last election in 1999 reducing the number of seats by 1.[1] The Liberal Democrats stayed in overall control of the council.[2]
Election result
The results saw the Liberal Democrats keep their majority on the council with 22 seats, but the Conservatives gained 5 seats to move to 10 councillors.[2] Overall turnout in the election was 45%.[3]
North Devon Local Election Result 2003[3] Party Seats Gains Losses Net gain/loss Seats % Votes % Votes +/- Liberal Democrat 22 -5 51.2 41.9 16,164 -5.8% Conservative 10 +5 23.3 31.1 11,996 +7.2% Independent 10 -2 23.3 24.6 9,487 +2.0% UKIP 1 +1 2.3 1.4 559 +1.4% Green 0 0 0 0.7 286 +0.7% BNP 0 0 0 0.3 118 +0.3% 4 Liberal Democrat and 1 independent candidates were unopposed.[3]
Ward results
Bickington & Roundswell (2)[3] Party Candidate Votes % ±% Conservative Rodney Cann 573 Liberal Democrat Carol McCormack-Hole 385 Conservative Colin Brown 362 Liberal Democrat Ronald Ellerton 343 Independent Charles Piper 315 Turnout 1,978 35.0 Bishop's Nympton[3] Party Candidate Votes % ±% Independent Eric Ley 789 77.7 Liberal Democrat Gerald Eva 226 22.3 Majority 563 55.5 Turnout 1,015 69.3 Bratton Fleming[3] Party Candidate Votes % ±% Liberal Democrat Malcolm Prowse 589 64.0 Conservative Richard Peek 331 36.0 Majority 258 28.0 Turnout 920 65.5 Braunton East (2)[3] Party Candidate Votes % ±% Independent Douglas Lucas 580 Conservative Philip Daniel 554 Liberal Democrat Derrick Spear 444 Liberal Democrat Elizabeth Spear 420 Conservative Geraldine Neale 328 Turnout 2,326 44.6 Braunton West (2)[3] Party Candidate Votes % ±% Conservative Jasmine Chesters 507 Liberal Democrat Marguerite Shapland 462 Liberal Democrat Letitia Sellwood 449 Independent Susan Lynch 397 Conservative Sallieanne Tingey 364 Independent Peter Manning 328 Turnout 2,507 44.1 Central Town (Barnstaple) (2)[3] Party Candidate Votes % ±% Liberal Democrat Faye Webber 568 Liberal Democrat John Wilsher 519 Conservative Simon Harvey 350 Conservative Christopher Gifford 301 Independent Paul Dyer 164 Turnout 1,902 31.3 Chittlehampton[3] Party Candidate Votes % ±% Independent Albert Cook unopposed Chumleigh[3] Party Candidate Votes % ±% Liberal Democrat Kevin Butt 495 56.0 Conservative Terence Pincombe 389 44.0 Majority 106 12.0 Turnout 884 54.2 Combe Martin (2)[3] Party Candidate Votes % ±% Liberal Democrat Yvette Gubb 957 Liberal Democrat Julia Clark 839 Conservative Susan Sussex 810 Conservative Arthur Yelton 513 Turnout 3,119 56.5 Forches & Whiddon Valley (2)[3] Party Candidate Votes % ±% Independent Laurence Haydn-Higgins 374 Liberal Democrat Francis Ovey 298 Liberal Democrat Valerie Monk 279 Independent James Bartlett 261 Conservative Susan McCrum 167 Independent Beresford Bawden 166 Turnout 1,545 29.9 Fremington (2)[3] Party Candidate Votes % ±% Independent Roy Morrish 603 Independent Peter Mullen 500 Independent David Harris 318 Conservative John Gill 312 Conservative Andrew Day 274 Liberal Democrat Ronald Taylor 109 Liberal Democrat Arthur Windsor 105 Turnout 2,221 36.9 Georgeham & Mortehoe (2)[3] Party Candidate Votes % ±% Liberal Democrat Malcolm Wilkinson 512 Conservative Ernest Evans 500 Liberal Democrat William Foster 489 Conservative Anthony Turner 482 Turnout 1,983 36.9 Heanton Punchardon[3] Party Candidate Votes % ±% Conservative Andrea Davis 244 54.0 Liberal Democrat Brian Jewell 208 46.0 Majority 36 8.0 Turnout 452 33.6 Ilfracombe Central (2)[3] Party Candidate Votes % ±% Independent Ivan Frances 503 Independent Richard Campbell 394 Independent Franklin Pearson 389 Independent Tony Cooper 292 Independent David Williams 244 Turnout 1,822 34.0 Ilfracombe East[3] Party Candidate Votes % ±% Independent Michael Edmunds 308 38.4 Conservative Carol Slinn 258 32.2 Independent Albert Furber 139 17.3 Independent Ann Rhodes 97 12.1 Majority 50 6.2 Turnout 802 46.3 Ilfracombe West (2)[3] Party Candidate Votes % ±% Liberal Democrat Geoffrey Fowler 696 Independent David Spear 573 Independent Brian Cotton 373 Independent Christine Tomlinson-Smith 316 Independent Keith Thompson 235 Turnout 2,193 37.4 Instow[3] Party Candidate Votes % ±% Conservative Lynn Brown 220 35.3 Liberal Democrat Patricia Ford 214 34.3 Independent Reginald Cane 190 30.4 Majority 6 1.0 Turnout 624 48.3 Landkey, Swimbridge & Taw (2)[3] Party Candidate Votes % ±% Liberal Democrat David Butt unopposed Liberal Democrat Alan Rennles unopposed Longbridge (2)[3] Party Candidate Votes % ±% UKIP Michael Pagram 559 Conservative David Brailey 538 Independent Pamela Holland 475 Liberal Democrat Rodney Hawes 284 Liberal Democrat Paulene Godfrey 264 Independent Nicholas Magnum 164 Turnout 2,284 43.3 Lynton & Lynmouth[3] Party Candidate Votes % ±% Liberal Democrat John Travis 733 88.0 Conservative John Walley 100 12.0 Majority 633 76.0 Turnout 833 59.5 Marwood[3] Party Candidate Votes % ±% Liberal Democrat Frederick Tucker 413 55.6 Conservative Mary Farrer 330 44.4 Majority 83 11.2 Turnout 743 55.3 Newport (2)[3] Party Candidate Votes % ±% Conservative Henry Harrison 431 Liberal Democrat Brian Macbeth 416 Liberal Democrat Diana Piercy 408 Conservative David Simpson 391 Green Richard Knight 286 Turnout 1,932 36.1 North Molton[3] Party Candidate Votes % ±% Conservative Richard Edgell 495 50.1 Liberal Democrat Michael Nelson 375 38.0 BNP Peter Chantler 118 11.9 Majority 120 12.1 Turnout 988 62.0 Pilton (2)[3] Party Candidate Votes % ±% Liberal Democrat Brian Greenslade 753 34.9 Liberal Democrat Mair Manuel 717 33.3 Conservative Malcolm Keene 353 16.4 Conservative John Jones 333 15.4 Turnout 2,156 41.1 South Molton (2)[3] Party Candidate Votes % ±% Liberal Democrat Ernest Moore 969 Liberal Democrat Susan Sewell 870 Conservative Jeremy Yabsley 469 Conservative Douglas Dowling 332 Turnout 2,640 48.0 Witheridge[3] Party Candidate Votes % ±% Conservative Nancy Lewis 385 52.0 Liberal Democrat Catherine Palmer 356 48.0 Majority 29 3.9 Turnout 741 44.3 Yeo Valley (2)[3] Party Candidate Votes % ±% Liberal Democrat Christopher Haywood unopposed Liberal Democrat Colin Payne unopposed References
- ^ "Local elections". BBC News Online. http://news.bbc.co.uk/1/shared/bsp/hi/vote2003/locals/html/179.stm. Retrieved 31 July 2011.
- ^ a b "Tories lose Torbay and Plymouth". BBC News Online. 2 May 2003. http://news.bbc.co.uk/1/hi/england/devon/2994593.stm. Retrieved 31 July 2011.
- ^ a b c d e f g h i j k l m n o p q r s t u v w x y z aa ab ac ad "Declaration of Result of Poll". District of North Devon. http://www.northdevon.gov.uk/district_election_resultsmay03.pdf. Retrieved 31 July 2011.
Preceded by
North Devon Council election, 1999North Devon local elections Succeeded by
North Devon Council election, 2007(2002 ←)  United Kingdom local elections, 2003 (→ 2004)
Metropolitan boroughs Barnsley · Birmingham · Bolton · Bradford · Bury · Calderdale · Coventry · Doncaster · Dudley · Gateshead · Kirklees · Knowsley · Leeds · Liverpool · Manchester · Newcastle upon Tyne · North Tyneside · Oldham · Rochdale · Rotherham · Salford · Sandwell · Sefton · Sheffield · Solihull · South Tyneside · St Helens · Stockport · Sunderland · Tameside · Trafford · Wakefield · Walsall · Wigan · Wirral · WolverhamptonUnitary authorities Bath and North East Somerset · Blackburn with Darwen · Blackpool · Bournemouth · Bracknell Forest · Brighton & Hove · Bristol · Darlington · Derby · East Riding of Yorkshire · Halton · Hartlepool · Herefordshire · Kingston upon Hull · Leicester · Luton · Medway · Middlesbrough · Milton Keynes · North East Lincolnshire · North Lincolnshire · North Somerset · Nottingham · Peterborough · Plymouth · Portsmouth · Reading · Redcar and Cleveland · Rutland · Slough · South Gloucestershire · Southampton · Southend-on-Sea · Stockton-on-Tees · Stoke-on-Trent · Swindon · Telford and Wrekin · Torbay · Warrington · West Berkshire · Windsor and Maidenhead · Wokingham · YorkDistrict councils Adur · Allerdale · Alnwick · Amber Valley · Arun · Ashfield · Ashford · Aylesbury Vale · Babergh · Barrow-in-Furness · Basildon · Basingstoke and Deane · Bassetlaw · Bedford · Berwick-upon-Tweed · Blaby · Blyth Valley · Bolsover · Boston · Braintree · Breckland · Brentwood · Bridgnorth · Broadland · Bromsgrove · Broxbourne · Broxtowe · Burnley · Cambridge · Cannock Chase · Canterbury · Caradon · Carlisle · Carrick · Castle Point · Castle Morpeth · Charnwood · Chelmsford · Cherwell · Chester · Chester-le-Street · Chesterfield · Chichester · Chiltern · Christchurch · Chorley · Colchester · Congleton · Copeland · Corby · Cotswold · Craven · Crawley · Crewe and Nantwich · Dacorum · Dartford · Daventry · Derbyshire Dales · East Hampshire · Eastleigh · Ellesmere Port and Neston · Elmbridge · Epping Forest · Exeter · Fenland · Fylde · Gedling · Gloucester · Gravesham · Great Yarmouth · Harlow · Harrogate · Hart · Havant · Hertsmere · Huntingdonshire · Hyndburn · Ipswich · Macclesfield · Maidstone · Mole Valley · Newcastle-under-Lyme · North Devon · Norwich · Nuneaton and Bedworth · Pendle · Penwith · Preston · Purbeck · Redditch · Reigate and Banstead · Rochford · Rossendale · Rugby · Runnymede · Rushmoor · Shrewsbury and Atcham · South Bedfordshire · South Cambridgeshire · South Lakeland · South Ribble · St Albans · Stevenage · Stratford-on-Avon · Stroud · Swale · Tamworth · Tandridge · Three Rivers · Tonbridge and Malling · Tunbridge Wells · Watford · Waveney · Welwyn Hatfield · West Lancashire · West Lindsey · West Oxfordshire · Weymouth and Portland · Winchester · Woking · Worcester · Worthing · Wyre ForestScottish councils Aberdeen · Aberdeenshire · Angus · Argyll and Bute · Clackmannanshire · Dumfries and Galloway · Dundee City · East Ayrshire · East Dunbartonshire · East Lothian · East Renfrewshire · Edinburgh · Falkirk · Fife · Glasgow · Highland · Inverclyde · Midlothian · Moray · Comhairle nan Eilean Siar · North Ayrshire · North Lanarkshire · Orkney · Perth and Kinross · Renfrewshire · Scottish Borders · Shetland · South Ayrshire · South Lanarkshire · Stirling · West Dunbartonshire · West LothianCategories:- English District Council elections
- English local elections, 2003
- Council elections in Devon
- North Devon

Wikimedia Foundation. 2010.