- Nottingham City Council election, 2011
-
Nottingham City Council election, 2011 
2007 ← 5 May 2011 → 2015 All 55 seats to Nottingham City Council
28 seats needed for a majorityFirst party Second party Third party 


Leader Jon Collins Andrew Price Gary Long Party Labour Conservative Liberal Democrat Leader's seat St Ann's Clifton North Leen Valley Last election 42 7 6 Seats won 50 5 0 Seat change +9 -2 -6
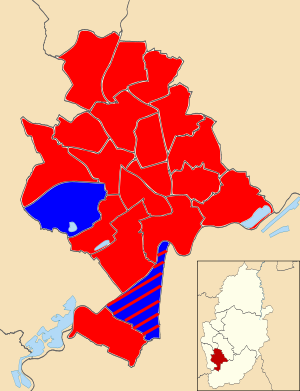
Nottingham ward map following the 2011 election
Leader before election
Jon Collins
LabourSubsequent Leader
Jon Collins
Labour Nottingham Council House
The 2011 elections to Nottingham City Council were held on 5 May 2011 to elect all 55 members to the Council.
The previous election was held in 2007 and the results were: Labour 42, Conservatives 7, Liberal Democrats 6. At the time of the 2011 election one Labour councillor, Mick Newton, had left the party and was an independent councillor.[1] This left Labour with 41 councillors at the time of the election.
No ward boundary changes took place between the 2007 and 2011 elections.
The result of the election was notable for completely wiping-out the Liberal Democrats in Nottingham. The Conservative Party lost two seats, whilst Labour strengthened their position.
Contents
Overall results
A total of 55 councillors were elected from 20 wards in the city.
The expected declaration time was 4am on 6th May.[2]
Nottingham Local Election Result 2011[3] Party Seats Gains Losses Net gain/loss Seats % Votes % Votes +/- Labour 50 9 0 +9 90.9 60.4 112,325 Conservative 5 0 2 -2 9.1 25.2 46,899 Liberal Democrat 0 0 6 -6 0 9.7 18,052 Green 0 0 0 0 0 1.9 3,602 UKIP 0 0 0 0 0 1.6 2,963 BNP 0 0 0 0 0 0.4 760 Independent 0 0 1 -1 0 0.3 567 Militant Elvis Anti-Tesco Popular Front 0 0 0 0 0 0.2 322 Elvis Turns Green 0 0 0 0 0 0.1 240 Trade Unionists and Socialists Against Cuts 0 0 0 0 0 0.1 212 Results by ward
 Alex Foster was one of six Liberal Democrats who lost their seats. The party was completely wiped out in Nottingham
 Labour's Brian Grocock retained his seat
Arboretum ward (2 seats) Party Candidate Votes % ±% Labour Merlita Bryan 1,335 35.4 Labour Azad Choudhry 1,266 33.6 Liberal Democrat Tony Marshall 451 12.0 Liberal Democrat Ali Shan 382 10.1 Conservative Adam William Poole 167 4.4 Conservative William Gordon Newing 165 4.4 Labour hold Swing Labour gain from Liberal Democrat Swing Turnout 27.1 Aspley ward (3 seats) Party Candidate Votes % ±% Labour Graham Ransley Chapman 2,417 Labour Carole Williams McCulloch 2,251 Labour Leon Unczur 2,206 Conservative Michael Holmstock 348 Conservative James Henry Marshall 323 UKIP Jennie Raymond 309 Conservative Marjorie Anne Wroughton 257 UKIP David Spooner 220 UKIP Deb Spooner 208 Labour hold Swing Labour hold Swing Labour hold Swing Turnout 30.3 Basford ward (3 seats) Party Candidate Votes % ±% Labour Cat Arnold 2,436 Labour Bill Ottewell 2,197 Labour Alex Norris 2,126 Conservative Keith Ian Goodinson 795 Conservative Susan Carole Goodinson 765 Conservative Dan Sullivan 701 Independent Mick Newton 567 Liberal Democrat Julia Dawn Bates 547 Liberal Democrat Tim Ball 536 Liberal Democrat William Henry Davison 407 Labour hold Swing Labour hold Swing Labour hold Swing Turnout 37.1 Berridge ward (3 seats) Party Candidate Votes % ±% Labour Mohammed Ibrahim 2,749 Labour Carole Ann Jones 2,681 Labour Toby Charles Neal 2,135 Liberal Democrat Raja Nisar Hussain 829 Green Alice Hilary Jane McGregor 770 Liberal Democrat Candice Samantha Blackwell 744 Conservative Mohammed Safdar 733 Liberal Democrat Tad Jones 669 Conservative John Hutchinson 659 Conservative Kate Amy Truax 535 Elvis Turns Green Ian Alan Joseph Pickering 240 Labour hold Swing Labour hold Swing Labour hold Swing Turnout 40.1 Bestwood ward (3 seats) Party Candidate Votes % ±% Labour Brian Grocock 2,451 Labour Mick Wildgust 2,066 Labour David Smith 2,062 Conservative John Anthony Crofts 748 Conservative Felicity Marion Whiting Crofts 724 Conservative Wendy Manning 672 Liberal Democrat Chris Cook 497 Labour hold Swing Labour hold Swing Labour hold Swing Turnout 30.7 Bilborough ward (3 seats) Party Candidate Votes % ±% Labour Derek John Cresswell 2,573 Labour Malcolm Arthur Wood 2,407 Labour Marcia Watson 2,288 Conservative Ian Culley 824 Conservative Husham Sharif Chattar 780 Conservative Vera Cross 763 Liberal Democrat John Christopher Calvert 421 BNP Bob Brindley 381 BNP Bob Coyne 379 Labour hold Swing Labour hold Swing Labour hold Swing Turnout 34.7 Bridge ward (2 seats) Party Candidate Votes % ±% Labour Nicola Clare Heaton 1,613 Labour Ian MacLennan 1,470 Liberal Democrat Saghir Akhtar 1,121 Liberal Democrat Scott Ashley Walker 843 Conservative Peter Alistair Beynon 365 Conservative Jeanna Parton 345 Labour gain from Liberal Democrat Swing Labour hold Swing Turnout 35.6 Bulwell ward (3 seats) Party Candidate Votes % ±% Labour Ginny Klein 2,234 Labour John Alan Hartshorne 2,067 Labour Jackie Morris 1,968 Conservative Stuart Michael Myles-Wilson 666 Conservative Barry William Carr 658 UKIP Trevor Rose 581 Conservative Tiffany Kate Trenner-Lyle 567 UKIP Irenea Marriott 390 UKIP Lee Waters 344 Labour hold Swing Labour hold Swing Labour hold Swing Turnout 31.9 Bulwell Forest ward (3 seats) Party Candidate Votes % ±% Labour Eunice Fay Campbell 2,956 Labour Alan Michael Clark 2,938 Labour Nick McDonald 2,714 Conservative Gerry Davie 1,402 Conservative Rachel Elizabeth Gama 1,259 Conservative Neale Mittenshaw-Hodge 1,122 UKIP Dave Marshall 336 UKIP Gemma Louise Wolfe 248 Trade Unionists and Socialists Against Cuts Charlie Taylor 212 UKIP Peter Zinn 194 Labour hold Swing Labour hold Swing Labour gain from Conservative Swing Turnout 46.2 Clifton North ward (3 seats) Party Candidate Votes % ±% Labour Lee Harold Jeffery 1,902 Conservative Roger David Steel 1,834 Conservative Timothy John Spencer 1,772 Conservative Andrew Mark Price 1,767 Labour Sam Webster 1,720 Labour Rizwan Araf 1,589 Labour gain from Conservative Swing Conservative hold Swing Conservative hold Swing Turnout 38.5 Clifton South ward (3 seats) Party Candidate Votes % ±% Labour Ian William Malcolm 2,274 Labour Christopher Gibson 1,980 Labour Jeannie Audrey Packer 1,950 Conservative Brendan Clarke-Smith 1,274 Conservative Carol Ann Woolley 1,235 Conservative Andrew James Peter Rule 1,079 Liberal Democrat Michael James Aston 267 Liberal Democrat Ahmed Insar 154 Labour hold Swing Labour hold Swing Labour hold Swing Turnout 35.8 Dales ward (3 seats) Party Candidate Votes % ±% Labour Gul Nawaz Khan 2,456 Labour David Mellen 2,327 Labour Kenneth Lawrence Williams 2,238 Liberal Democrat Ali Asghar 949 Conservative Sajad Hamed 815 Conservative Julie Elizabeth Orange 809 Conservative Stephanie Stewardson 726 Militant Elvis Anti-Tesco Popular Front David Laurence Bishop 322 Labour hold Swing Labour hold Swing Labour hold Swing Turnout 39.7 Dunkirk & Lenton ward (2 seats) Party Candidate Votes % ±% Labour Sarah Piper 1,061 Labour David Trimble 1,022 Conservative Emily Charlotte Burditt 328 Conservative Jamie Trott 255 Liberal Democrat Alisdair McGregor 241 Liberal Democrat Malik Naeem Shahbaz 190 Labour hold Swing Labour hold Swing Turnout 30.6 Leen Valley ward (2 seats) Party Candidate Votes % ±% Labour Glyn Jenkins 1,706 Labour Mohammed Saghir 1,566 Liberal Democrat Gary David Long 1,076 Liberal Democrat Alex Foster 1,011 Conservative David Peter Robert Gibson 612 Conservative Michael Ilyas 466 Labour gain from Liberal Democrat Swing Labour gain from Liberal Democrat Swing Turnout 47.5 Mapperley ward (3 seats) Party Candidate Votes % ±% Labour Emma Dewinton 2,358 Labour Rosemary Elizabeth Caroline Healy 2,059 Labour Thulani Molife 1,836 Conservative Bill Dennis 1,413 Conservative Jim Fields 1,304 Conservative Mohammed Maqsood 1,101 Green Anthony Stuart Hamilton 572 Liberal Democrat John Francis Hay 451 Liberal Democrat Dan Caseley 358 Liberal Democrat Dora Kostiuk 313 Labour hold Swing Labour hold Swing Turnout 38.4 Radford & Park ward (3 seats) Party Candidate Votes % ±% Labour Liaqat Ali 1,717 Labour Stephanie Linda Williams 1,710 Labour Mohammad Aslam 1,639 Conservative Ed Attenborough 940 Conservative Katya Lamb 932 Conservative Nick Packham 866 Green Tom West 509 Liberal Democrat Jennifer Anne Coggles 404 Liberal Democrat Michael Ian Thomas 336 Liberal Democrat Sulayman Salomon Jawara 274 Labour hold Swing Labour hold Swing Labour hold Swing Turnout 30.1 Sherwood ward (3 seats) Party Candidate Votes % ±% Labour Brian Parbutt 2,664 Labour Jane Urquhart 2,629 Labour Alex Ball 2,597 Conservative Ewan Lamont 1,239 Conservative Nick Max 1,096 Conservative Shaun Hartley 1,081 Green Lydia Rowan Davies-Bright 729 Green Phil Sainty 525 Green Birgit Angela Völlm 496 Liberal Democrat Ann Venning Bourke 436 Liberal Democrat Alison Rouse 334 Liberal Democrat Peter Charles Mendenhall 307 Labour hold Swing Labour hold Swing Labour hold Swing Turnout 45.8 St Ann's ward (3 seats) Party Candidate Votes % ±% Labour Jon Collins 2,074 Labour Sue Johnson 2,044 Labour David Liversidge 1,969 Conservative John Christopher Berlin Garrett 465 Conservative Lucy Elizabeth Smith 447 Conservative Olivia Charlotte Willett 400 Liberal Democrat Alexander James Matthews 322 Labour hold Swing Labour hold Swing Labour hold Swing Turnout 26.4 Wollaton East & Lenton Abbey ward (2 seats) Party Candidate Votes % ±% Labour Sally Ann Longford 981 Labour Stuart Fox 942 Liberal Democrat Dave Oldham 676 Liberal Democrat Tony Bernard Sutton 631 Conservative James Michael Spencer 551 Conservative Jane Upton 530 UKIP Chris Sneap 79 UKIP Andrew William Taylor 54 Labour gain from Liberal Democrat Swing Labour gain from Liberal Democrat Swing Turnout 29.3 Wollaton West ward (3 seats) Party Candidate Votes % ±% Conservative Georgina Jane Culley 2,870 Conservative Eileen Margaret Mary Morley 2,646 Conservative Stephen Neil Parton 2,593 Labour Adam George Spencer 2,018 Labour Linda Mary Woodings 1,938 Labour Shafiq Ahmed 1,753 Liberal Democrat Barbara Ann Pearce 770 Liberal Democrat John Henry Burr 601 Liberal Democrat Bill Smith 506 Conservative hold Swing Conservative hold Swing Conservative hold Swing Turnout 51.7 See also
- United Kingdom local elections, 2011
- United Kingdom Alternative Vote referendum, 2011
References
- ^ Nottingham Post Councillor leaves the Labour Party
- ^ Press Association Local council declaration times in order of time
- ^ Nottingham City Council Local Election result Nottingham City Council
(2010 ←)  United Kingdom local elections, 2011 (→ 2012)
Metropolitan boroughs Barnsley · Birmingham · Bolton · Bradford · Bury · Calderdale · Coventry · Doncaster · Dudley · Gateshead · Kirklees · Knowsley · Leeds · Liverpool · Manchester · Newcastle upon Tyne · North Tyneside · Oldham · Rochdale · Rotherham · Salford · Sandwell · Sefton · Sheffield · Solihull · South Tyneside · St Helens · Stockport · Sunderland · Tameside · Trafford · Wakefield · Walsall · Wigan · Wirral · WolverhamptonUnitary authorities Bath and North East Somerset · Blackburn with Darwen · Blackpool · Bournemouth · Bracknell Forest · Brighton & Hove · Bristol · Cheshire East · Cheshire West & Chester · Darlington · Derby · East Riding of Yorkshire · Halton · Hartlepool · Herefordshire · Kingston upon Hull · Leicester · Luton · Medway · Middlesbrough · Milton Keynes · North East Lincolnshire · North Lincolnshire · North Somerset · Nottingham · Peterborough · Plymouth · Poole · Portsmouth · Reading · Redcar and Cleveland · Rutland · Slough · South Gloucestershire · Southampton · Southend-on-Sea · Stockton-on-Tees · Stoke-on-Trent · Swindon · Telford and Wrekin · Thurrock · Torbay · Warrington · West Berkshire · Windsor and Maidenhead · Wokingham · YorkDistrict councils Allerdale · Amber Valley · Arun · Ashfield · Ashford · Aylesbury Vale · Babergh · Barrow-in-Furness · Basildon · Basingstoke and Deane · Bassetlaw · Blaby · Boston · Braintree · Breckland · Brentwood · Broadland · Bromsgrove · Broxbourne · Broxtowe · Burnley · Cambridge · Cannock Chase · Canterbury · Carlisle · Castle Point · Charnwood · Chelmsford · Cherwell · Chesterfield · Chichester · Chiltern · Christchurch · Chorley · Colchester · Copeland · Corby · Cotswold · Craven · Crawley · Dacorum · Dartford · Daventry · Derbyshire Dales · Dover · Eastbourne · East Cambridgeshire · East Devon · East Dorset · East Hampshire · East Hertfordshire · Eastleigh · East Lindsey · East Northamptonshire · East Staffordshire · Eden · Elmbridge · Epping Forest · Epsom and Ewell · Erewash · Exeter · Fenland · Forest Heath · Forest of Dean · Fylde · Gedling · Gloucester · Gravesham · Guildford · Great Yarmouth · Hambleton · Harborough · Harlow · Harrogate · Hart · Havant · Hertsmere · High Peak · Hinckley and Bosworth · Horsham · Huntingdonshire · Hyndburn · Ipswich · Kettering · King's Lynn and West Norfolk · Lancaster · Lewes · Lincoln · Lichfield · Maidstone · Maldon · Malvern Hills · Mansfield · Melton · Mendip · Mid Devon · Mid Suffolk · Mid Sussex · Mole Valley · New Forest · Newark and Sherwood · Newcastle-under-Lyme · North Devon · North Dorset · North East Derbyshire · North Hertfordshire · North Kesteven · North Norfolk · North Warwickshire · North West Leicestershire · Northampton · Norwich · Oadby and Wigston · Pendle · Preston · Purbeck · Redditch · Reigate and Banstead · Ribble Valley · Richmondshire · Rochford · Rossendale · Rother · Rugby · Runnymede · Rushcliffe · Rushmoor · Ryedale · Scarborough · Sedgemoor · Selby · Sevenoaks · Shepway · South Cambridgeshire · South Derbyshire · South Hams · South Holland · South Kesteven · South Lakeland · South Norfolk · South Northamptonshire · South Oxfordshire · South Ribble · South Somerset · South Staffordshire · Spelthorne · St Albans · St Edmundsbury · Stafford · Staffordshire Moorlands · Stevenage · Stratford-on-Avon · Stroud · Suffolk Coastal · Surrey Heath · Swale · Swale · Tamworth · Tandridge · Taunton Deane · Teignbridge · Tendring · Test Valley · Tewkesbury · Thanet · Three Rivers · Tonbridge and Malling · Torridge · Tunbridge Wells · Uttlesford · Vale of White Horse · Warwick · Watford · Waveney · Waverley · Wealden · Wellingborough · Welwyn Hatfield · West Devon · West Dorset · West Lancashire · West Lindsey · West Oxfordshire · West Somerset · Weymouth and Portland · Winchester · Woking · Worcester · Worthing · Wychavon · Wycombe · Wyre · Wyre ForestMayoral elections Categories:- Politics of Nottingham
- English local elections, 2011


Wikimedia Foundation. 2010.