- Optical mapping
-
Optical mapping[1] is a technique for constructing ordered, genome-wide, high-resolution restriction maps from single, stained molecules of DNA, called "optical maps". By mapping the location of restriction enzyme sites along the unknown DNA of an organism, the spectrum of resulting DNA fragments collectively serve as a unique "fingerprint" or "barcode" for that sequence. Originally developed by Dr. David C. Schwartz and his lab at NYU in the 1990s [2] this method has since been integral to the assembly process of many large-scale sequencing projects for both microbial and eukaryotic genomes.
Contents
Technology
 The optical mapping workflow.
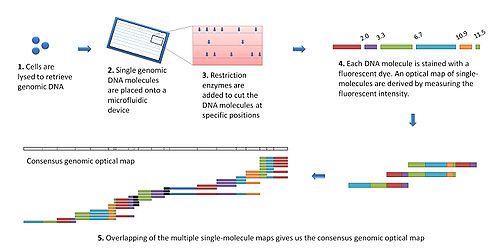
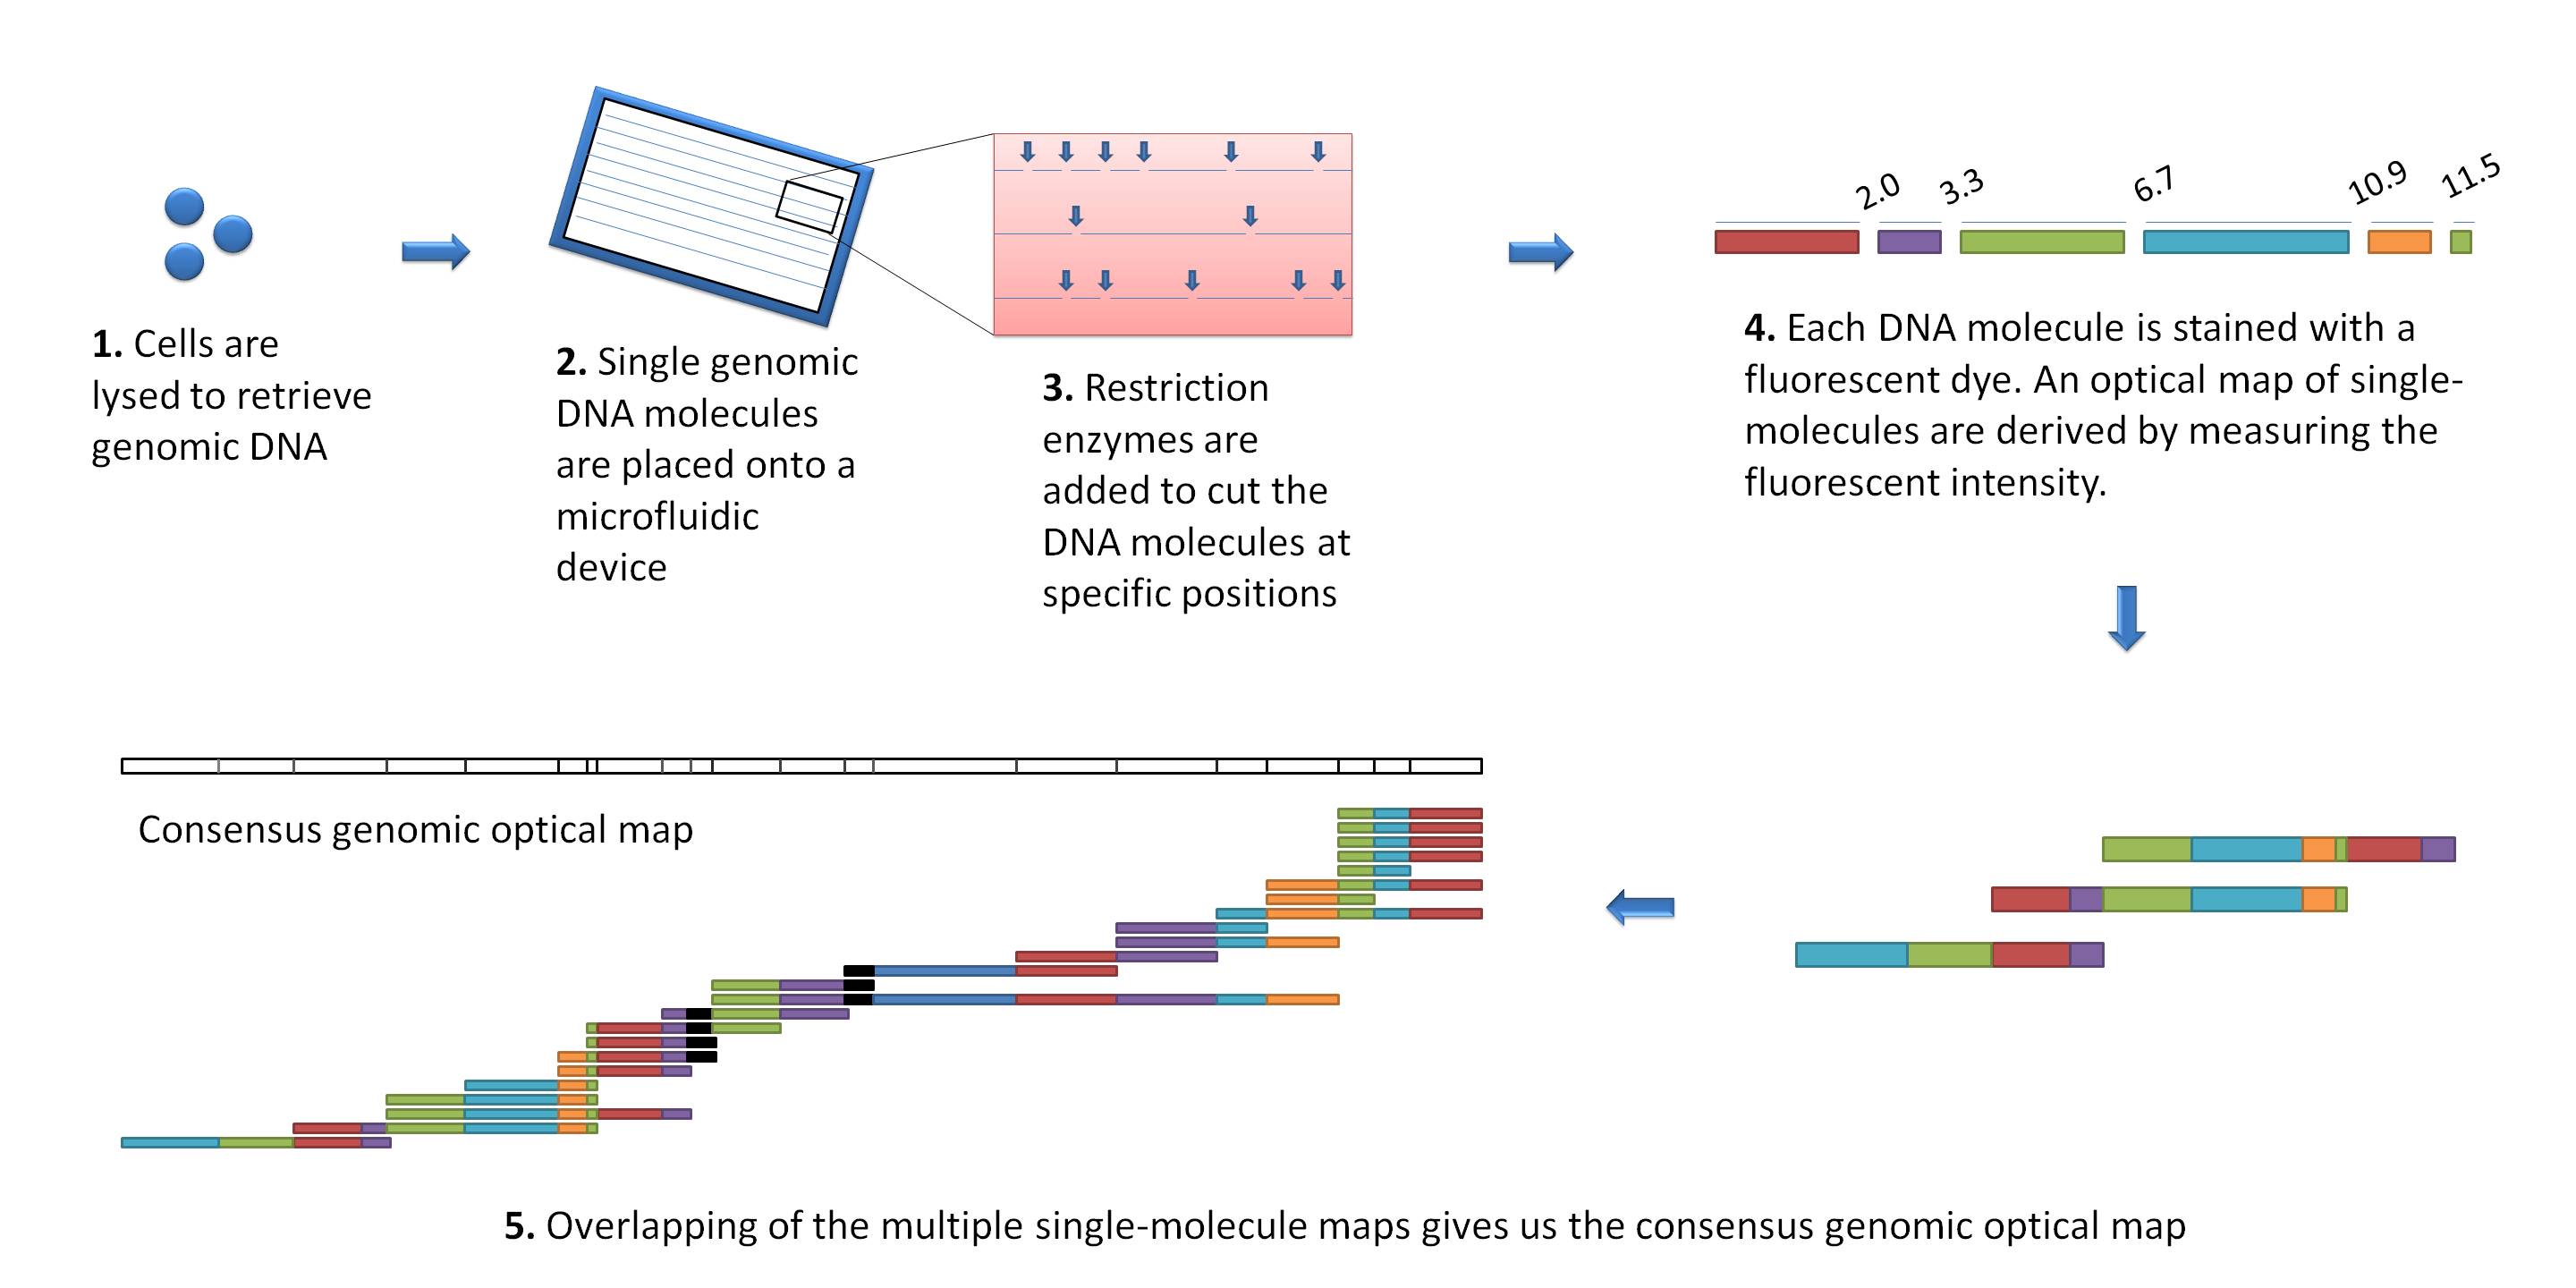
The modern optical mapping platform works as follows[3]
- Genomic DNA is obtained from lysed cells, and randomly sheared to produce a "library" of large genomic molecules for optical mapping.
- A single molecule of DNA is stretched (or elongated) and held in place on a slide under a fluorescent microscope due to charge interactions.
- DNA molecule is digested by added restriction enzymes, which cleave at specific digestion sites. The resulting molecule fragment remain attached to the surface. The fragment ends at the cleavage site are drawn back (due to elasticity of linearized DNA), leaving gaps which are identifiable under the microscope as gaps.
- DNA fragments stained with intercalating dye is visualized by fluorescence microscopy and are sized by measuring the integrated fluorescence intensity. This produces an optical map of single molecules.
- Individual optical maps are combined to produce a consensus, genomic optical map.
History of Optical Mapping Platform
Early system
DNA molecules were fixed on molten agarose developed between a cover slip and a microscope slide. Restriction enzyme was pre-mixed with the molten agarose before DNA placement and cleavage was triggered by addition of magnesium.
Using charged surfaces
Rather than being immobilized within a gel matrix, DNA molecules were held in place by electrostatic interactions on a positively-charged surface. Resolution improved such that fragments from ~30kb to as small as 800bp could sized.
Automated system
This involved the development and integration of an automated spotting system to spot multiple single molecules on a slide (like a microarray) for parallel enzymatic processing, automated floresence microscopy for image acquisition, image procession vision to handle images, algorithms for optical map construction, cluster computing for processing large amounts of data
High-throughput system using microfluidics
Observing that microarrays spotted with single molecules did not work well for large genomic DNA molecules, microfluidic devices using soft lithography possessing a series of parallel microchannels was developed.
Next-generation system using nanocoding technology
An improvement on optical mapping, called "Nanocoding"[4], has potential to boost throughput by trapping elongated DNA molecules in nanoconfinements.
Comparisons
Other mapping techniques
The advantage of OM over traditional mapping techniques is that it preserves the order of the DNA fragment, whereas the order needs to be reconstructed using restriction mapping. In addition, since maps are constructed directly from genomic DNA molecules, cloning or PCR artifacts are avoided. However, each OM process is still affected by false positive and negative sites because not all restriction sites are cleaved in each molecule and some sites may be incorrectly cut. In practice, multiple optical maps are created from molecules of the same genomic region, and an algorithm is used to determine the best consensus map.[5]
Other genome analysis methods
There are a variety of approaches to identifying large-scale genomic variations (such as indels, duplications, inversions, translocations) between genomes. Other categories of methods include using microarrays, pulsed-field gel electrophoresis, cytogenetics and paired-end tags.
Uses
Initially, the optical mapping system has been used to construct whole-genome restriction maps of bacteria, parasites, and fungi.[6][7][8]. It has also been used to scaffold and validate bacterial genomes[9]. To serve as scaffolds for assembly, assembled sequence contigs can be scanned for restriction sites in silico using known sequence data and aligning them to the assembled genomic optical map. Commercial company, Opgen has provided optical mappings for microbial genomes. For larger eukaryotic genomes, only the David C. Schwartz lab (now at Madison-Wisconsin) has produced optical maps for mouse[10], human[11], rice[12], and maize[13].
Optical Sequencing
Optical sequencing is a single molecule DNA sequencing technique that follows sequence-by-synthesis and uses optical mapping technology[14][15]. Similar to other single molecular sequencing approaches such as SMRT sequencing, this technique analyzes a single DNA molecule, rather than amplify the initial sample and sequence multiple copies of the DNA. During synthesis, fluorochrome-labeled nucleotides are incorporated through the use of DNA polymerases and tracked by fluorescence microscopy. This technique was originally proposed by David C. Schwartz and Arvind Ramanathan in 2003.
Optical Sequencing Cycle
The following is an overview of each cycle in the optical sequencing process.[16].
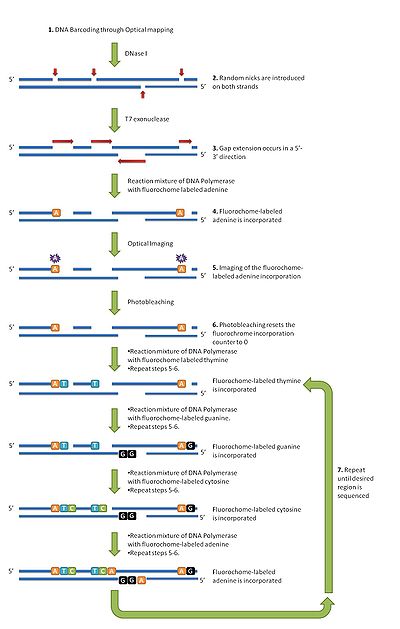 The optical sequencing cycle.
Step 1: DNA Barcoding
Cells are lysed to release genomic DNA. These DNA molecules are untangled, placed onto optical mapping surface containing microfluidic channels and the DNA is allowed to flow through the channels. These molecules are then barcoded by restriction enzymes to allow for genomic localization through the technique of optical mapping. See the above section on "Technology" for those steps.Step 2: Template Nicking
DNase I is added to randomly nick the mounted DNA molecules. A wash is then performed to remove the DNase I. The mean number of nicks that occur per template is dependent on the concentration of DNase I as well as the incubation time.Step 3: Gap Formaton
T7 exonuclease is added which uses the nicks in the DNA molecules to expand the gaps in a 5'-3' direction. Amount of T7 exonuclease must be carefully controlled to avoid overly high levels of double-stranded breaks.Step 4: Fluorochrome incorporation
DNA polymerase is used to incorporate fluorochrome-labelled nucleotides (FdNTPs) into the multiple gapped sites along each DNA molecule. During each cycle, the reaction mixture contains a single type of FdNTP and allows for multiple additions of that nucleotide type. Various washes are then performed to remove unincorporated fdNTPs in preparation for imaging and the next cycle of FdNTP addition.Step 5: Imaging
This step counts the number of incorporated fluorochrome-labeled nucleotides at the gap regions using fluorescence microscopy.Step 6: Photobleaching
The laser illumination that is used to excite the fluorochrome is also used here to destroy the fluorochrome signal. This essentially resets the fluorochrome counter, and prepares the counter for the next cycle. This step is a unique aspect of optical sequencing as it does not actually remove the fluorochrome label of the nucleotide after its incorporation. not removing the fluorochrome label makes sequencing more economical, but it results in the need to incorporate fluorochrome labels consecutively which can result in problems due to the bulkiness of the labels.Step 7: Repeat steps 4-6
Steps 4-6 are repeated with step 4 using a reaction mixture that contains a different fluorochrome-labeled nucleotide (FdNTP) each time. This is repeated until the desired region is sequenced.Optimization Strategies
Selection of an appropriate DNA polymerase is critical to the efficiency of the base addition step and must meet several criteria:
- Ability to efficiently incorporate FdNTP at consecutive positions
- Lack of 3'-5' exonuclease and proofreading activity to prevent the removal newly incorporated FdNTP
- High fidelity to minimize mis-incorporations
- Good activity on templates which are mounted to surfaces (eg. optical mapping surface)
In addition, different polymerase preference for different fluorochromes, linker length on fluorochrome-nucleotides, and buffer compositions are also important factors to be considered to optimize the base addition process and maximize number of consecutive FdNTP incorporations.
Advantages
Single-molecule analysis
Since minimal DNA sample required, time-consuming and costly amplification step is avoided to streamline sample preparation process.Large DNA molecule templates (~500 kb) vs. Short DNA molecule templates (< 1kb) While most next generation sequencing technologies aim of massive amounts of smalls sequence reads, these small sequence reads make de novo sequencing efforts and genome repeat regions difficult to comprehend. Optical sequencing uses large DNA molecule templates (~500 kb) for sequencing and these offers several advantages over small templates:
- These large DNA templates can be "DNA barcoded" to determine their genomic localization with confidence. Therefore, any sequence reads that are taken from the large template can be mapped onto the genome with a high degree of confidence. More importantly, sequence reads from high repeat regions can placed with a greater degree of confidence where as the short reads suffer from mapping uncertainty in high repeat regions. Special algorithms and software such as optical mapping and nanocoding have been developed to align single-molecule barcodes with a reference genome.
- Multiple sequence reads from the same large template molecule. These multiple sequence reads reduce the complexity of de novo assembly, disambiguate genomic rearrangement regions, and "intrinsically free from any assembly errors."[16]
- Molecular barcoding of large DNA molecular templates with sequence acquisition provides broad and specific genomic analyses
Disadvantages
- Single molecule DNA sequencing requires a high level of precision to match the confidence from the redundant read coverage provided by current next-generation sequencing technologies.
- Nicks on both strands at similar positions resulting in low template during sequence-by-synthesis.
- Fluorochrome-labeled nucleotides are not removed after incorporation and because of these bulky labels, multiple incorporation might be difficult.
Cracker Team
The Cracker team is a Taiwanese-based research team, led by engineer Chung Fan-Chiou, that uses fluorescence-based optical genome sequencing technology in combination with nanopore methodology. They are currently part of Archon X Prize for Genomics competition. There approach relies on a novel optical design technique called sequencing on top [sTOP]:[17]
A single-molecule reaction site is placed immediately on top of a multi-junction photodiode, producing an independently operable nanosequencer. Our resulting chip spans an array of millions of such nanosequencers, all operating simultaneously and each one generating data independently from its neighbors. The direct processing of light signals within the chip itself is key to the uniqueness and advantages of our technology. That is, our chip will generate data with higher levels of throughput and accuracy than technologies currently available on the market or that we know are under development. Our chip presents also the unique advantages of a low cost of manufacturing and portability. No specific production equipment is required other than that necessary to manufacture silicon chips for computer use.
Their technique does not rely on any optical microscopes, or the capturing of numerous images. Additionally, where current optical detection systems are limited in the number of observable reactions, the sTOP chip can handle the millions of nanosequencing information happening at the same time.
Their aim is to have a prototype by 2012 and be commercially available by 2015.
External links
References
- ^ Zhou, Shiguo; Jill Herscheleb, David C. Schwartz (2007). A Single Molecule System for Whole Genome Analysis. New high throughput technologies for DNA sequencing and genomics. 2. Elsevier. pp. 269–304.
- ^ Schwartz, D. C., et al. "Ordered Restriction Maps of Saccharomyces Cerevisiae Chromosomes Constructed by Optical Mapping." Science (New York, N.Y.) 262.5130 (1993): 110-4.
- ^ Dimalanta, E.T. et al. A microfluidic system for large DNA molecule arrays. Anal. Chem. 76 (2004): 5293-5301.
- ^ Jo, K., et al. "A Single-Molecule Barcoding System using Nanoslits for DNA Analysis." Proceedings of the National Academy of Sciences of the United States of America 104.8 (2007): 2673-8.
- ^ Valouev, A., Schwartz, D., Zhou, S., and Waterman, M.S. "An algorithm for assembly of ordered restriction maps from single DNA molecules." RECOMB '98: Proceedings of the National Academy of Sciences of the United States of America 103 (2006): 15770-15775.
- ^ Lai, Z., et al. "A Shotgun Optical Map of the Entire Plasmodium Falciparum Genome." Nature genetics 23.3 (1999): 309-13.
- ^ Lim, A., et al. "Shotgun Optical Maps of the Whole Escherichia Coli O157:H7 Genome." Genome research 11.9 (2001): 1584-93.
- ^ Lin, J., et al. "Whole-Genome Shotgun Optical Mapping of Deinococcus Radiodurans." Science (New York, N.Y.) 285.5433 (1999): 1558-62.
- ^ Nagarajan, N., et al. "Scaffolding and validation of bacterial genome assemblies using optical restriction maps." Bioinformatics 24.10 (2008):1229-35.
- ^ Church, D.M. et al. Lineage-specific biology revealed by a finished genome assembly of the mouse. PLoS Biology, 7.5 (2009):e1000112.
- ^ Kidd, J.M. et al. Mapping and sequencing of structural variation from eight human genomes. Nature 453 (2008): 56-64.
- ^ Zhou, S. et al.Validation of rice genome sequence by Optical Mapping. BMC Genomics 8 (2007): 278.
- ^ Zhou, S. et al. A single molecule scaffold for the maize genome. PLoS Genetics, 5.11(2009): epub.
- ^ Ramanathan, A., et al. "An Integrative Approach for the Optical Sequencing of Single DNA Molecules." Analytical Biochemistry 330.2 (2004): 227-41.
- ^ Ramanathan, A., Paper, L., and Schwartz, D.C. "High-Density Polymerase-Mediated Incorporation of Fluorochrome-Labeled Nucleotides." Analytical Biochemistry 337.1 (2005): 1-11.
- ^ a b Zhou, S., Paper, L., and Schwartz, D.C. "Optical Sequencing: Acquisition from Mapped Single-Molecule Templates." Next-Generation Genome Sequencing: Towards Personalized Medicine. Ed. Michal Janitz. 1st ed.Wiley-VCH, 2008. 133-151.
- ^ Podolak, E. "Q & A: Hubert Renauld Talks about Cracker, Taiwan's New Genome Sequencing Team."
Categories:

Wikimedia Foundation. 2010.