- Nova Scotia general election, 2006
-
Nova Scotia general election, 2006 
2003 ←
membersJune 13, 2006
members→ 2009
members52 seats of the Nova Scotia House of Assembly
27 seats were needed for a majorityFirst party Second party Third party 

Leader Rodney MacDonald Darrell Dexter Francis MacKenzie Party Progressive Conservative New Democrat Liberal Leader's seat Inverness Cole Harbour Bedford (Lost) Last election 25 15 12 Seats won 23 20 9 Seat change -2 +5 -3 Popular vote 160,119 140,128 94,872 Percentage 39.57% 34.63% 23.44% Swing +3.33% +3.52% -7.99%
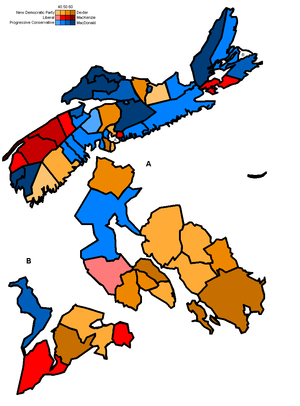
Riding map of Nova Scotia showing winning parties.
Premier before election
Rodney MacDonald
Progressive ConservativeElected Premier
Rodney MacDonald
Progressive ConservativeThe 37th Nova Scotia general election was held on June 13, 2006 to elect members of the 60th House of Assembly of the Province of Nova Scotia, Canada.
Premier Rodney MacDonald, who led a Progressive Conservative minority government in the legislature, called for the election on May 13, 2006, hoping for a majority government to better advance his agenda and a clear mandate for himself as he had not yet fought an election as leader.
Ultimately, MacDonald was returned to power leading another, slightly smaller, minority government against a strengthened New Democratic Party sitting as the Official Opposition and a weakened Liberal Party. Liberal leader Francis MacKenzie was defeated in his riding of Bedford.
Contents
Timeline
- September 29, 2005 - Premier John Hamm, leader of the Progressive Conservative minority government, announces his intent to resign as soon as the party chooses a new leader.
- February 11, 2006 - Rodney MacDonald is elected to replace Hamm as leader.
- February 24, 2006 - MacDonald becomes Premier and his cabinet is sworn in.
- May 9, 2006 - MacDonald's government introduces an "election-style" budget in the legislature.[1]
- May 13, 2006 - MacDonald asks Lieutenant Governor Myra Freeman to call an election. Upon his advice, Freeman sets the date for June 13, 2006.
- June 13, 2006:
- 20:00 ADT - CBC projects a PC government
- 20:14 ADT - CBC projects a PC minority government
- 20:20 ADT - The riding of Bedford is called for the Tories, defeating Liberal leader Francis MacKenzie.
- 20:35 ADT - In delivering his concession speech, Francis MacKenzie announced that it was "the end of the road," and that he planned to meet with the Liberal President within a week.
- 21:33 ADT - CBC officially declares a PC minority government on their website[2]
Results
The Progressive Conservatives gained several points in the popular vote, but made a net loss of two seats, with losses to the NDP partially countered by the PCs doubling their representation on MacDonald's native Cape Breton Island at the expense of the Liberals. The gap between the Liberals and NDP also significantly increased, in both the popular vote and seat count; while the Liberals and NDP had previously been nearly even, the NDP gained a significant advantage on the Liberals and moved into position as the primary opposition to the governing PCs.
Results by party
Party Party leader # of
candidatesSeats Popular vote 2003 Dissolution Elected % Change # % Change Progressive Conservative Rodney MacDonald 52 25 25 23 -8.0% 160,119 39.57% +3.33% New Democratic Darrell Dexter 52 15 15 20 +33.3% 140,128 34.63% +3.52% Liberal Francis MacKenzie 51 12 10 9 -10.0% 94,872 23.44% -7.99% Green Nick Wright 52 * - - - 9,411 2.33% * Independents 3 0 1 - -100% 153 0.04% Vacant 1 Total 210 52 52 52 404,683 * The Greens did not contest the 2003 election.
Results by region
Party name HRM C.B. Valley S. Shore Fundy Central Total Parties winning seats in the legislature: Progressive Conservative Seats: 3 4 3 5 5 3 23 Popular vote: 31.22% 42.62% 36.14% 49.08% 54.06% 42.90% 39.59% New Democratic Party Seats: 13 2 - 2 1 2 20 Popular vote: 46.57% 25.58% 23.44% 32.29% 26.49% 34.44% 34.50% Liberal Seats: 2 3 4 - - - 9 Popular vote: 19.29% 29.80% 38.35% 16.46% 16.70% 21.03% 23.56% Parties not winning seats in the legislature: Green Popular vote: 2.92% 1.83% 2.07% 2.16% 2.72% 1.58% 2.31% Independents Popular vote: - 0.17% - - 0.03% 0.05% 0.04% Total seats: 18 9 7 7 6 5 52 Opinion polls
Polling firm Dates Link Prog. Cons. New Democratic Liberal Corporate Research Associates June 5, 2006 HTML 38% 36% 20% Corporate Research Associates May 23, 2006 HTML 34% 27% 30% Corporate Research Associates February 2006 HTML 36% 29% 27% Corporate Research Associates November 2005 HTML 35% 32% 28% Corporate Research Associates August 2005 HTML 31% 32% 26% Corporate Research Associates May 2005 HTML 36% 30% 27% Corporate Research Associates March 2005 HTML 38% 24% 30% Corporate Research Associates December 2004 HTML 35% 28% 30% Corporate Research Associates September 2004 HTML 29% 30% 31% Corporate Research Associates May 2004 HTML 28% 33% 30% Corporate Research Associates February 2004 HTML 31% 30% 28% Corporate Research Associates November 2003 HTML 28% 32% 29% Election 2003 August 5, 2003 PDF 36.32% 31.00% 31.47% Riding results
- bold denotes a cabinet minister or party leader
- † denotes an incumbent not seeking re-election
Valley
Electoral District Candidates Incumbent PC NDP Liberal Green Other Annapolis Blair Hannam
2041 - (24.57%)Calum MacKenzie
1391 - (16.75%)Stephen McNeil
4668 - (56.20%)Ken McGowan
206 - (2.48%)Stephen McNeil Clare Arnold LeBlanc
1622 - (28.08%)Paul Comeau
1269 - (21.97%)Wayne Gaudet
2803 - (48.53%)Diane Doucet-Bean
82 - (1.42%)Wayne Gaudet Digby—Annapolis Jimmy MacAlpine
2178 - (36.42%)Andrew Oliver
663 - (11.13%)Harold Theriault
3029 - (50.91%)Namron Bean
92 - (1.54%)Harold Theriault, Jr. Hants West Chuck Porter
2974 - (34.60%)Sean Bennett
2486 - (28.97%)Paula Lunn
2921 - (34.08%)Sam Schurman
201 - (2.34%)Ron Russell† Kings North Mark Parent
4138 - (50.07%)Jim Morton
2171 - (26.40%)Madonna Spinazola
1758 - (21.18%)Christopher Alders
195 - (2.35%)Mark Parent Kings South David Morse
3832 - (42.37%)David Mangle
3130 - (35.01%)Ray Savage
1753 - (20.10%)Steven McGowan
226 - (2.53%)David Morse Kings West John Prall
2801 - (33.18%)Greg Hubbert
1590 - (18.83%)Leo Glavine
3940 - (46.67%)Nistal Prem de Boer
112 - (1.33%)Leo Glavine South Shore
Electoral District Candidates Incumbent PC NDP Liberal Green Other Argyle Chris d'Entremont
3158 - (67.65%)Charles Muise
531 - (11.38%)Christian Surette
913 - (19.56%)Patricia Saunders
66 - (1.41%)Chris d'Entremont Chester-St. Margaret's Judy Streatch
3950 - (42.67%)Jane Matheson
2838 - (30.60%)Rick Fraughton
2192 - (23.68%)Joanne MacKinnon
282 - (3.05%)Judy Streatch Lunenburg Michael Baker
3969 - (49.40%)Chris Heide
2790 - (33.22%)Rick Welsford
1200 - (14.94%)Stuart Simpson
196 - (2.44%)Michael Baker Lunenburg West Carolyn Bolivar-Getson
3637 - (43.21%)Bill Smith
3299 - (39.19%)Martin Bell
1324 - (15.73%)Brendan MacNeill
157 - (1.87%)Carolyn Bolivar-Getson Queens Kerry Morash
2998 - (48.59%)Vicki Conrad
3054 - (49.48%)Margaret Whitney
119 - (1.93%)Kerry Morash Shelburne Eddie Nickerson
2373 - (35.00%)Sterling Belliveau
2438 - (36.27%)Kirk Cox
1790 - (26.63%)Derek Jones
141 - (2.10%)Cecil O'Donnell† Yarmouth Richard Hurlburt
5170 - (64.30%)John Deveau
1667 - (20.73%)Dolores Atwood
1051 - (13.07%)Matt Granger
152 - (1.89%)Richard Hurlburt Fundy
Electoral District Candidates Incumbent PC NDP Liberal Green Other Colchester-Musquodoboit Valley Brooke Taylor
4790 - (63.85%)Gary Burrill
1891 - (25.21%)Carolyn Matthews
707 - (8.76%)Leona MacLeod
164 - (2.19%)Brooke Taylor Colchester North Karen Casey
3899 - (50.96%)Rob Assels
1511 - (20.21%)Bob Taylor
1979 - (26.47%)Judy Davis
176 - (2.35%)Bill Langille † Cumberland North Ernest Fage
4640 - (62.64%)Kim Cail
1085 - (14.65%)Bruce Alan Fage
1480 - (19.98%)Darryl Whetter
202 - (2.73%)Ernest Fage Cumberland South Murray Scott
5087 - (76.76%)Andrew Kernohan
753 - (11.37%)Mary Dee MacPherson
691 - (10.29%)James Dessart
92 - (1.39%)David Raymond Amos
13 - (0.2%)Murray Scott Hants East Wayne Fiander
2715 - (30.62%)John MacDonell
4712 - (53.13%)Malcolm MacKay
1237 - (13.95%)Michael Hartlan
204 - (2.30%)John MacDonell Truro-Bible Hill Jamie Muir
3711 - (47.27%)Jim Harpell
2220 - (28.64%)Ron Chisholm
1679 - (21.32%)Barton Cutten
217 - (2.76%)Jamie Muir Central Halifax
Electoral District Candidates Incumbent PC NDP Liberal Green Other Halifax Chebucto Sean Phillips
1720 - (22.09%)Howard Epstein
4216 - (54.15%)Peter Verner
1481 - (19.02%)Christopher Harborne
369 - (4.74%)Howard Epstein Halifax Citadel Bill Black
2721 - (37.49%)Leonard Preyra
2932 - (42.03%)Devin Maxwell
1182 - (16.25%)Nick Wright
307 - (4.23%)Vacant Halifax Clayton Park Mary Ann McGrath
2450 - (26.86%)Linda Power
3060 - (33.33%)Diana Whalen
3404 - (37.32%)Sheila Richardson
228 - (2.50%)Diana Whalen Halifax Fairview Bruce MacCharles
1653 - (23.13%)Graham Steele
4162 - (58.51%)Cecil MacDougall
1029 - (14.80%)Kris MacLellan
254 - (3.56%)Graham Steele Halifax Needham Andrew Black
1287 - (18.17%)Maureen MacDonald
4431 - (60.62%)Errol Gaum
1233 - (16.66%)Amanda Myers
349 - (4.55%)Maureen MacDonald Suburban Halifax
Electoral District Candidates Incumbent PC NDP Liberal Green Other Bedford Len Goucher
4090 - (42.22%)John Buckland
2019 - (20.84%)Francis MacKenzie
3286 - (33.92%)Mary McLaughlan
292 - (3.01%)Peter G. Christie † Halifax Atlantic Bruce Cooke
2690 - (32.08%)Michèle Raymond
4144 - (49.51%)Jim Hoskins
1281 - (15.28%)Rebecca Mosher
262 - (3.12%)Michele Raymond Hammonds Plains-Upper Sackville Barry Barnet
3704 - (42.02%)Mat Whynott
3188 - (36.05%)Pam Streeter
1766 - (20.03%)Scott Cleghorn
167 - (1.89%)Barry Barnet Sackville-Cobequid Steve Craig
2499 - (30.42%)Dave Wilson
4475 - (54.50%)David Major
1055 - (12.80%)Elizabeth Nicolson
187 - (2.28%)Dave Wilson Timberlea-Prospect Jaunita Cirtwell
2034 - (24.16%)Bill Estabrooks
5316 - (63.15%)Lisa Mullin
851 - (10.11%)Thomas Trappenberg
217 - (2.58%)Bill Estabrooks Waverley-Fall River-Beaver Bank Gary Hines
3275 - (40.17%)Percy Paris
3782 - (46.39%)Thomas Deal
909 - (11.15%)William Lang
186 - (2.28%)Gary Hines Dartmouth/Cole Harbour/Eastern Shore
Electoral District Candidates Incumbent PC NDP Liberal Green Other Cole Harbour Sheila McKeand
1527 - (20.63%)Darrell Dexter
5264 - (61.46%)Stephen Beehan
1851 - (15.54%)Michael McFadden
206 - (2.38%)Darrell Dexter Cole Harbour-Eastern Passage Don McIver
1194 - (18.93%)Kevin Deveaux
4086 - (64.40%)Brian Churchill
903 - (14.23%)Beverly Woodfield
155 -(2.44%)Kevin Deveaux Dartmouth East Jim Cormier
2942 - (33.27%)Joan Massey
3822 - (43.22%)Tracey Devereaux
1842 - (20.83%)Elizabeth Perry
238 - (2.69%)Joan Massey Dartmouth North Troy Myers
1895 - (27.46%)Trevor Zinck
3384 - (49.47%)Ian Murray
1365 - (19.78%)Alex Donaldson
227 - (3.29%)Jerry Pye† Dartmouth South-Portland Valley Tim Olive
3043 - (32.52%)Marilyn More
4493 - (48.05%)Brian Hiltz
1509 - (16.14%)Daniel Melvin
338 - (3.29%)Marilyn More Eastern Shore Bill Dooks
3232 - (45.93%)Sidney Prest
2871 - (40.80%)Judith Cabrita
746 - (10.60%)Elizabeth van Dreunen
188 - (2.67%)Bill Dooks Preston Dwayne Provo
1610 - (36.83%)Douglas Sparks
843 - (19.17% )Keith Colwell
1853 - (42.13%)David Farrell
82 - (1.86%)Keith Colwell Central Nova
Electoral District Candidates Incumbent PC NDP Liberal Green Other Antigonish Angus MacIsaac
4662 - (48.28%)Andrew MacDonald
1480 - (19.06%)Danny MacIsaac
2987 - (30.80%)Judy Dowden
179 - (1.87%)Angus MacIsaac Guysborough-Sheet Harbour Ron Chisholm
2765 - (40.83%)Jim Boudreau
2540 - (37.51%)David Horton
1378 - (20.36%)Marike Finaly-de Monchy
88 - (1.30%)Ronnie Chisholm Pictou Centre Pat Dunn
3901 - (52.54%)Danny MacGillivray
2344 - (31.70%)Troy MacCulloch
1057 - (14.24%)Sir Reginalr Walter the 3rd
93 - (1.25%)Dennis Tate
20 - (0.27%)John Hamm† Pictou East Sue Uhren
2654 - (35.31%)Clarrie MacKinnon
2761 - (36.73%)Dan Walsh
2000 - (26.61%)John A. Clark
102 - (1.36%)Jim DeWolfe† Pictou West Ronald Baillie
2584 - (33.99%)Charlie Parker
4173 - (54.89%)Sandy MacKay
698 - (9.18%)Douglas Corbett
147 - (1.93%)Charlie Parker Cape Breton
Electoral District Candidates Incumbent PC NDP Liberal Green Other Cape Breton Centre Darren Bruckschwaiger
2274 - (28.44%)Frank Corbett
3482 - (43.65%)Laura Lee MacDonald
2154 - (26.92%)Frances Oomen
79 - (0.99%)Frank Corbett Cape Breton North Cecil Clarke
4285 - (50.71%)Russell MacDonald
2195 - (25.83%)Fred Tilley
1868 - (21.99%)Mark Doucet
125 - (1.47%)Cecil Clarke Cape Breton Nova Todd Marsman
855 - (12.07%)Gordie Gosse
4315 - (60.92%)Mel Crowe
1794 - (25.33%)Chris Milburn
119 - (1.68%)Gordie Gosse Cape Breton South Scott Boyd
3260 - (32.36%)Jamie Crane
2160 - (21.43%)Manning MacDonald
4383 - (43.50%)Stephen Doucet
273 - (2.71%)Manning MacDonald Cape Breton West Alfie MacLeod
4738 - (53.76%)Terry Crawley
1344 - (15.28%)Dave LeBlanc
2479 - (28.28%)Michael Milburn
236 - (2.68%)Russell MacKinnon† Glace Bay Mark Bettens
2074 - (26.85%)Myrtle Campbell
2234 - (28.93%)David Wilson
3327 - (43.08%)Todd Pettigrew
88 - (1.14%)David Wilson Inverness Rodney MacDonald
7992 - (70.47%)Tim Murphy
1438 - (12.77%)Mary MacLennan
1748 - (15.49%)John Gibson
146 - (1.27%)Rodney MacDonald Richmond John Greene
2268 - (40.45%)Mary Pat Cude
529 - (9.43%)Michel Samson
2722 - (48.55%)Noreen Hartlen
88 - (1.57%)Michel Samson Victoria-The Lakes Keith Bain
3001 - (47.48%)Joan O'Liari
755 - (11.94%)Gerald Sampson
2272 - (35.94%)Michelle Smith
173 - (2.74%)Stemer MacLeod
120 - (1.90%)Gerald Sampson Shifts in control
Progressive Conservative to NDP
Electoral District Candidates Incumbent PC NDP Pictou East 2003 Jim DeWolfe 2006 Clarrie MacKinnon Jim DeWolfe † Queens 2003 Kerry Morash 2006 Vicki Conrad Kerry Morash Shelburne 2003 Cecil O'Donnell 2006 Sterling Belliveau Cecil O'Donnell † Waverley—Fall River—Beaver Bank 2003 Gary Hines 2006 Percy Paris Gary Hines Liberal to NDP
Electoral District Candidates Incumbent Liberal NDP Halifax Citadel 2003 Danny Graham 2006 Leonard Preyra Vacant Liberal to Progressive Conservative
Electoral District Candidates Incumbent Liberal PC Cape Breton West 2003 Russell MacKinnon 2006 Alfie MacLeod Russell MacKinnon † Victoria—The Lakes 2003 Gerald Sampson 2006 Keith Bain Gerald Sampson By-elections since the general election
Cole Harbour-Eastern Passage (Resignation of Kevin Deveaux), October 2, 2007:
By-election: Cole Harbour-Eastern Passage Party Candidate Votes % ±% NDP Becky Kent 2,459 44.39 -20.08 PC Mike Eddy 1,863 33.63 +14.79 Liberal Kelly Rambeau 958 17.30 +3.05 Green Beverley Skaalrud-Woodfield 259 4.68 +2.24 Total 5,539 100% Notes
References
- Government of Nova Scotia. "Election Summary From 1867 - 2006" (PDF). Elections Statistics. Elections Nova Scotia. http://electionsnovascotia.ns.ca/results/ele_summary.pdf. Retrieved 2006-12-02.
External links
 Elections and referendums in Nova Scotia
General elections Referendums 1929 · 2004 Elections in Canada
Most recent Future elections Lists Electoral districts - Federal
- BC
- AB
- SK
- MB
- ON
- QC
- NB
- NS
- PE
- NL
- YU
- NT
- NU
 The Politics of Canada portal
Politics of Nova Scotia The Crown Sovereign • Queen Elizabeth II
Lieutenant-Governor Premier Opposition Leader House of Assembly Current members • Past General AssembliesSpeaker of the Assembly Political parties Elections Current issues: Other provinces and territories Categories:- 2006 elections in Canada
- Elections in Nova Scotia


Wikimedia Foundation. 2010.