- Mercator projection
-
 Mercator projection of the world between 82°S and 82°N.
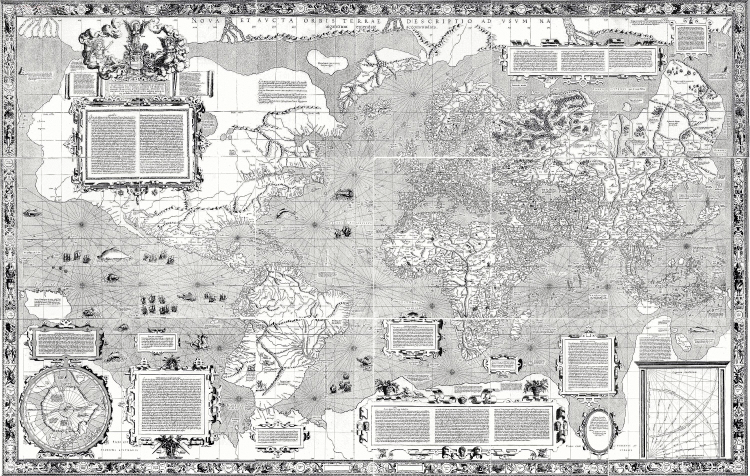
 Mercator world map Nova et Aucta Orbis Terrae Descriptio ad Usum Navigantium Emendata (1569)
The Mercator projection is a cylindrical map projection presented by the Belgian geographer and cartographer Gerardus Mercator, in 1569. It became the standard map projection for nautical purposes because of its ability to represent lines of constant course, known as rhumb lines or loxodromes, as straight segments. While the linear scale is constant in all directions around any point, thus preserving the angles and the shapes of small objects (which makes the projection conformal), the Mercator projection distorts the size and shape of large objects, as the scale increases from the Equator to the poles, where it becomes infinite.
Contents
Properties and historical details
Mercator's 1569 edition was a large planisphere measuring 202 by 124 cm, printed in eighteen separate sheets. As in all cylindrical projections, parallels and meridians are straight and perpendicular to each other. In accomplishing this, the unavoidable east-west stretching of the map, which increases as distance away from the equator increases, is accompanied by a corresponding north-south stretching, so that at every point location, the east-west scale is the same as the north-south scale, making the projection conformal. A Mercator map can never fully show the polar areas, since linear scale becomes infinitely high at the poles. Being a conformal projection, angles are preserved around all locations. However scale varies from place to place, distorting the size of geographical objects and conveying a distorted idea of the overall geometry of the planet. At latitudes greater than 70° north or south, the Mercator projection is practically unusable.
All lines of constant bearing (rhumb lines or loxodromes — those making constant angles with the meridians), are represented by straight segments on a Mercator map. This is precisely the type of route usually employed by ships at sea, where compasses are used to indicate geographical directions and to steer the ships. The two properties, conformality and straight rhumb lines, make this projection uniquely suited to marine navigation: courses and bearings are measured using wind roses or protractors, and the corresponding directions are easily transferred from point to point, on the map, with the help of a parallel ruler or a pair of navigational protractor triangles.
The name and explanations given by Mercator to his world map (Nova et Aucta Orbis Terrae Descriptio ad Usum Navigantium Emendata: "new and augmented description of Earth corrected for the use of sailors") show that it was expressly conceived for the use of marine navigation. Although the method of construction is not explained by the author, Mercator probably used a graphical method, transferring some rhumb lines previously plotted on a globe to a square graticule, and then adjusting the spacing between parallels so that those lines became straight, making the same angle with the meridians as in the globe.
The development of the Mercator projection represented a major breakthrough in the nautical cartography of the 16th century. However, it was much ahead of its time, since the old navigational and surveying techniques were not compatible with its use in navigation. Two main problems prevented its immediate application: the impossibility of determining the longitude at sea with adequate accuracy and the fact that magnetic directions, instead of geographical directions, were used in navigation. Only in the middle of the 18th century, after the marine chronometer was invented and the spatial distribution of magnetic declination was known, could the Mercator projection be fully adopted by navigators.
Several authors are associated with the development of Mercator projection:
- German Erhard Etzlaub (c. 1460–1532), who had engraved miniature "compass maps" (about 10×8 cm) of Europe and parts of Africa, latitudes 67°–0°, to allow adjustment of his portable pocket-size sundials, was for decades declared to have designed "a projection identical to Mercator’s".
- Portuguese mathematician and cosmographer Pedro Nunes (1502–1578), who first described the loxodrome and its use in marine navigation, and suggested the construction of several large-scale nautical charts in the cylindrical equidistant projection to represent the world with minimum angle distortion (1537).
- English mathematician Edward Wright (c. 1558–1615), who formalized the mathematics of Mercator projection (1599), and published accurate tables for its construction (1599, 1610).
- English mathematicians Thomas Harriot (1560–1621) and Henry Bond (c.1600–1678) who, independently (c. 1600 and 1645), associated the Mercator projection with its modern logarithmic formula, later deduced by calculus.
Mathematics of the projection
 Relation between vertical position on the map (horizontal in the graph) and latitude (vertical in the graph). This is the graph of the Gudermannian function.
Mathematically, the Mercator projection is completely characterized by the fact that bearings on the globe are everywhere equal to bearings on the map; for example, north on the globe is always upward on the map, and for any angle θ°, the direction that is θ° east of north on the globe is everywhere θ° clockwise from upward on the map.
That necessarily implies that meridians of longitude are vertical on the map, and therefore all parallels of latitude are equally long on the map, even though on the globe, parallels of latitude that are farther from the equator are shorter. This stretching in a horizontal direction then necessitates stretching in a vertical direction in order that bearings not be distorted. Consequently the scale is different at locations remote from the equator from what appears at the equator.
Specifically, the length of the parallel at θ° latitude (either north or south) is cos θ° times the length of the equator. The scale at θ° latitude is therefore multiplied by 1/cos θ° = sec θ°.
The following equations determine the x and y coordinates of a point on a Mercator map from its latitude φ and longitude λ. The number λ0 is the longitude for x=0. R is the radius of the sphere of the Earth (6378.1 km) at the scale of the map as drawn, and φ and λ are given in radians.
This is the integral of the secant function, and is the inverse of the Gudermannian function:
The scale is proportional to the secant of the latitude φ, getting arbitrarily large near the poles, where φ = ±90°. Moreover, as seen from the formulas, the pole's y is plus or minus infinity.
The scaling factor for distances measured along lines of constant latitude φ is sec(φ) – this gives a scaling factor that is 1 at the equator (φ = 0) and approaches infinity near the poles (φ = ±90 degrees). The vertical distance on the map between two points with the same longitude is more complex and depends on their respective latitudes – it is:
Derivation of the projection
 The Mercator projection is a cylindrical projection.
Assume a spherical Earth. (It is actually slightly flattened, but for small-scale maps the difference is immaterial. For more precision, interpose conformal latitude.) We seek a transform of longitude-latitude (λ, φ) to Cartesian (x, y) that is "a cylinder tangent to the equator" (i.e. x = λ) and conformal, so that:
From x = λ we get
giving
Thus y is a function only of φ with
 . By reasoning explained in detail at Integral of the secant function, this implies:
It is convenient to map φ = 0 to y = 0, so take C = 0.
Uses
 The Mercator projection portrays Greenland as larger than Australia; in actuality, Australia is more than three and a half times larger than Greenland.
As on all map projections, shapes or sizes are distortions of the true layout of the Earth's surface. The Mercator projection exaggerates areas far from the equator. For example:
- Greenland takes as much area on the map as Africa, when in fact Africa's area is approximately 14 times greater than Greenland.
- Alaska takes as much area on the map as Brazil, when Brazil's area is actually more than 5 times that of Alaska.
- Finland appears with a greater north-south extent than India, although India's is greater.
- Antarctica appears as the biggest continent, although it is actually the fifth in terms of area.
Although the Mercator projection is still used commonly for navigation, due to its unique properties, cartographers agree that it is not suited to general reference world maps due to its distortion of land area. Mercator himself used the equal-area sinusoidal projection to show relative areas. As a result of these criticisms, modern atlases no longer use the Mercator projection for world maps or for areas distant from the equator, preferring other cylindrical projections, or forms of equal-area projection. The Mercator projection is still commonly used for areas near the equator, however, where distortion is minimal.
Arno Peters stirred controversy when he proposed what is now usually called the Gall–Peters projection as the alternative to the Mercator. The projection is a specific parameterization of the cylindrical equal-area projection. A 1989 resolution by seven North American geographical groups decried the use of all rectangular-coordinate world maps, including the Mercator and Gall–Peters.[1]
Many major online street mapping services (Bing Maps, Google Maps, MapQuest, Yahoo Maps, and others) use a variant of the Mercator projection for their map images[2]. Despite its obvious scale variation at small scales, the projection is well-suited as an interactive world map that can be zoomed seamlessly to large-scale (local) maps, where there is relatively little distortion due to the projection's near-conformality.
The major online street mapping services tiling systems display most of the world at the lowest zoom level as a single square image, excluding the polar regions. Since the Mercator coordinate x varies over 2π, the other coordinate is limited to −π ≤ y ≤ π. Because
the corresponding latitude extrema are φ = ±85.05113°. Latitude values outside this range are mapped using a different relationship that doesn't diverge at φ = ±90°.
See also
- Cartography
- Transverse Mercator projection
- Universal Transverse Mercator coordinate system
- Cassini projection
- Dymaxion map
- Equirectangular projection
- Gall–Peters projection with resolution regarding the use of rectangular world maps
- Gnomonic projection
- Jordan Transverse Mercator
- Lambert conformal conic projection (used extensively in aviation)
- Map projection
- Mollweide projection
- Nautical chart
- Robinson projection
- Reversed map
- Tissot's indicatrix
- Winkel Tripel projection
Notes
- ^ American Cartographer. 1989. 16(3): 222–223.
- ^ http://groups.google.com/group/Google-Maps-API/msg/8222b18e7921f6e6
References
- Snyder, John P. (1987). Map Projections—A Working Manual. U.S. Geological Survey Professional Paper 1395. United States Government Printing Office, Washington, D.C. This paper can be downloaded from USGS pages.
- Monmonier, Mark (2004). Rhumb Lines and Map Wars. Chicago: The University of Chicago Press.
- Needham, Joseph (1986). Science and Civilization in China: Volume 3; Mathematics and the Sciences of the Heavens and the Earth. Taipei: Caves Books Ltd.
- Needham, Joseph (1986). Science and Civilization in China: Volume 4, Physics and Physical Technology, Part 3, Civil Engineering and Nautics. Taipei: Caves Books Ltd.
- Google Maps Coordinates
External links
- Ad maiorem Gerardi Mercatoris gloriam – contains high-resolution images of the 1569 world map by Mercator.
- Table of examples and properties of all common projections, from radicalcartography.net.
- An interactive Java Applet to study the metric deformations of the Mercator Projection.
- Web Mercator: Non-Conformal, Non-Mercator (Noel Zinn, Hydrometronics LLC)
Categories:- Cartographic projections
- Conformal mapping


Wikimedia Foundation. 2010.