- Cooling curve
-
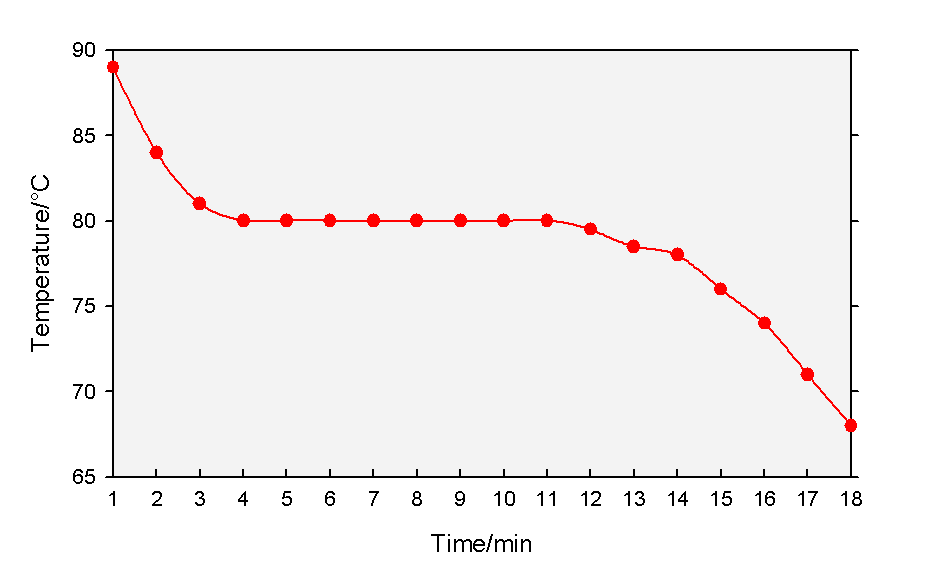
 A cooling curve of naphthalene from liquid to solid.
A cooling curve is a line graph that represents the change of phase of matter, typically from a gas to a solid or a liquid to a solid. The independent variable (X-axis) is time and the dependent variable (Y-axis) is temperature.[1] Below is an example of a cooling curve used in castings.
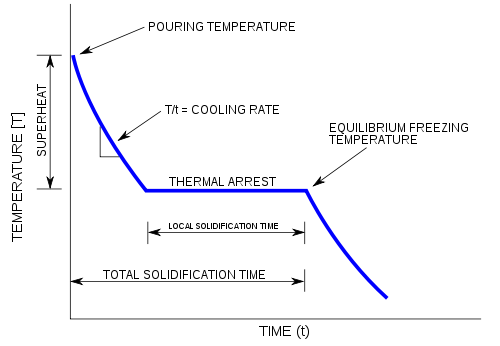
The initial point of the graph is the starting temperature of the matter, here noted as the "pouring temperature". When the phase change occurs there is a "thermal arrest", that is the temperature stays constant. This is because the matter has more internal energy as a liquid or gas than in the state that it is cooling to. The amount of energy required for a phase change is known as latent heat. The "cooling rate" is the slope of the cooling curve at any point.
In the part of the curve where the temperature decreases, the kinetic energy also decreases while the potential energy stays the same. However, at the phase transition, where the curve is flat, the kinetic energy stays the same while the potential energy decreases.[citation needed]
References
- ^ Garland, Nibler, and Shoemaker. Experiments in Physical Chemistry (7th ed.)
States of matter Low energy High energy Other states Colloid · Glass · Liquid crystal · Magnetically ordered (Antiferromagnet, Ferrimagnet, Ferromagnet) · String-net liquid · SuperglassTransitions Boiling · Boiling point · Critical line · Critical point · Crystallization · Deposition · Evaporation · Flash evaporation · Freezing · Lambda point · Melting · Melting point · Regelation · Saturated fluid · Sublimation · Supercooling · Triple pointQuantities Enthalpy of fusion · Enthalpy of sublimation · Enthalpy of vaporization · Latent heat · Latent internal energy · Trouton's constant · Trouton's ratio · VolatilityConcepts Binodal · Compressed fluid · Cooling curve · Equation of state · Leidenfrost effect · Mpemba effect · Order and disorder (physics) · Spinodal · Superconductivity · Superheated vapor · Superheating · Thermo-dielectric effectCategories:

Wikimedia Foundation. 2010.