- Nautical chart
-
A nautical chart is a graphic representation of a maritime area and adjacent coastal regions. Depending on the scale of the chart, it may show depths of water and heights of land (topographic map), natural features of the seabed, details of the coastline, navigational hazards, locations of natural and man-made aids to navigation, information on tides and currents, local details of the Earth's magnetic field, and man-made structures such as harbours, buildings, and bridges. Nautical charts are essential tools for marine navigation; many countries require vessels, especially commercial ships, to carry them. Nautical charting may take the form of charts printed on paper or computerised electronic navigational charts. Recent technologies have made available paper charts which are printed "on demand" with cartographic data that has been downloaded to the commercial printing company as recently as the night before printing. With each daily download, critical data such as Local Notice to Mariners is added to the on-demand chart files so that these charts will be 100% up to date at the time of printing.

Contents
Sources and publication of nautical charts
Nautical charts are based on hydrographic surveys. As surveying is laborious and time-consuming, hydrographic data for many areas of sea may be dated and not always reliable. Depths are measured in a variety of ways. Historically the sounding line was used. In modern times, echo sounding is used for measuring the seabed in the open sea. When measuring the safe depth of water over an entire obstruction, such as a shipwreck, the minimum depth is checked by sweeping the area with a length of horizontal wire. This ensures that difficult to find projections, such as masts, do not present a danger to vessels navigating over the obstruction.
Nautical charts are issued by the national hydrographic offices in many countries. These charts are considered "official" in contrast to those made by commercial publishers. Many hydrographic offices provide regular, sometimes weekly, manual updates of their charts through their sales agents. Individual hydrographic offices produce national chart series and international chart series. Coordinated by the International Hydrographic Organization, the international chart series is a worldwide system of charts ("INT" chart series), which is being developed with the goal of unifying as many chart systems as possible.
There are also commercially published charts, some of which may carry additional information of particular interest, e.g. for yacht skippers.
Free nautical charts
An ocean mapping site with free charts, and a social network for sea lovers</ref> is a worldwide ocean mapping site, a mobile app, and a social network for sea lovers, offering free NOAA/United States, New Zealand/Pacific Ocean and Brazil charts. BlooSee leverages the power of the community to complement official nautical chart data with content generated by sailors, surfers, divers, kayakers, fisherman, NGO's, merchants, and other ocean communities. BlooSee's charts and data are layered over the satellite imagery of Google Maps/Google Earth.
Marine GeoGarage[1] is the first nautical chart web portal in the Cloud. The website allows to freely view seamless georeferenced nautical raster chart layers issued from different Hydrographic Services (NOAA US, Linz NZ , DNH Brazil) upon Google Maps imagery.
Additional free features are available for the user (voyage planning, waypoint and route monitoring with transfer to GPS, bearing and distance calculations).OpenSeaMap.org (OSeaM)[2] is a free nautical chart. It's a worldwide Wiki-project and part of OpenStreetMap. Everybody can contribute his nautical knowledges about estuary, harbours and Marina, as geografic chart informations and as textdata in a linked Wiki-port pilot book. OpenSeaMap covers worldwide all seas and the inland waterways. The chart shows lights, buoys, harbour informations and a lot of other nautical geo-data. The chart displays also weather informations like wind, air pressure, wave hight on a detailed worldwide weather chart including a weather forecast for three days.
TeamSurv[3] creates charts using crowd sourced data. Boats log GPS and depth sounder information (plus compass heading and sea surface temperature when available) as they go about their nortmal activities, and upload the data to the server where the data undergoes quality checks and is corrected for tide height, speed of sound and other factors before being used to create a chart. Data can be collected using a hardware logger or through a number of software packages, and is open to all. Processed data can be viewed at the teamsurv.eu web site, overlaid on top of Google Maps.
 OpenSeaMap - the free nautical chart
The US National Oceanic and Atmospheric Administration is now offering complete detailed nautical charts for free download for home printing for the entire US coast. The charts are continuously updated. This should improve the safety at sea, while reducing costs for mariners. Note, however, that these print-at-home charts will typically not offer the detail that "full size" NOAA charts do.
The UK Hydrographic Office (UKHO)is widely recognised as the leading authority and publishes the series of British Admiralty charts and supplies 70% of the chart market, electronic and paper.
Chart correction
The nature of a waterway depicted by a chart may change, and artificial aids to navigation may be altered at short notice. Therefore, old or uncorrected charts should never be used for navigation. Every producer of nautical charts also provides a system to inform mariners of changes that affect the chart. In the United States, chart corrections and notifications of new editions are provided by various governmental agencies by way of Notice to Mariners, Local Notice to Mariners, Summary of Corrections, and Broadcast Notice to Mariners. In the U.S., NOAA also has a printing partner who prints the "POD" (print on demand) NOAA charts, and they contain the very latest corrections and notifications at the time of printing. Radio broadcasts give advance notice of urgent corrections.
A good way to keep track of corrections is with a Chart and Publication Correction Record Card system. Using this system, the navigator does not immediately update every chart in the portfolio when a new Notice to Mariners arrives, instead creating a card for every chart and noting the correction on this card. When the time comes to use the chart, he pulls the chart and chart's card, and makes the indicated corrections on the chart. This system ensures that every chart is properly corrected prior to use. A prudent mariner should obtain a new chart if he or she has not kept track of corrections and his chart is more than several months old.
Various Digital Notices to Mariners systems are available on the market such as Digitrace (http://www.marinepress.com/mpc/index.html), Voyager (www.tgnsvoyager.com), ChartCo (www.http://www.chartco.com/) to correct British Admiralty charts as well as NOAA charts. These systems provides only vessels relevant corrections via e-mail or web downloads reducing time needed to sort our correction for each chart. Also, tracings to assist corrections are provided at the same time.
The Canadian Coast Guard also produces the Notice to Mariners publication which informs mariners of important navigational safety matters affecting Canadian Waters. This electronic publication is published on a monthly basis and can be downloaded from the Notices to Mariners (NOTMAR) Web site. The information in the Notice to Mariners is formatted to simplify the correction of paper charts and navigational publications.
Various and diverse methods exist for the correction of electronic navigational charts.
Limitations
In 1973 the cargo ship MV Muirfield (a merchant vessel named after Muirfield, Scotland) struck an unknown object in waters charted at a depth of greater than 5,000 metres (16,404 ft), resulting in extensive damage to her keel.[4] In 1983, HMAS Moresby, a Royal Australian Navy survey ship, surveyed the area where Muirfield was damaged, and charted in detail this previously unsuspected hazard to navigation, the Muirfield Seamount.
The dramatic accidental discovery of the Muirfield Seamount is often cited as an example of limitations in the vertical datum accuracy of some offshore areas as represented on nautical charts, especially on small-scale charts. A similar incident involving a passenger ship occurred in 1992 when the Cunard liner RMS Queen Elizabeth 2 struck a submerged rock off Block Island in the Atlantic Ocean.[5] More recently, in 2005 the submarine USS San Francisco (SSN-711) ran into an uncharted seamount about 560 kilometers (350 statute miles) south of Guam at a speed of 35 knots (40.3 mph; 64.8 km/h), sustaining serious damage and killing one seaman.
Map projection, positions, and bearings
 A pre-Mercator nautical chart of 1571, from Portuguese cartographer Fernão Vaz Dourado (c. 1520-c.1580). It belongs to the so-called plane chart model, where observed latitudes and magnetic directions are plotted directly into the plane, with a constant scale, as if the Earth's surface were a flat plane (Portuguese National Archives of Torre do Tombo, Lisbon)
The Mercator projection is almost universally used in nautical charts. There are however some exceptions for very large or small scales where projections such as the gnomonic projection may be used. Since the Mercator projection is conformal, that is, bearings in the chart are identical to the corresponding angles in nature, bearings may be measured from the chart to be used at sea or plotted on the chart from measurements taken at sea.
Positions of places shown on the chart can be measured from the longitude and latitude scales on the borders of the chart, relative to a map datum such as WGS 84.
A bearing is the angle between the line joining the two points of interest and the line from one of the points to the north, such as a ship’s course or a compass reading to a landmark. On nautical charts, the top of the chart is always true north, rather than magnetic north, towards which a magnetic compass points. Most charts include a compass rose depicting the variation between magnetic and true north.
Electronic and paper charts
 Portion of an electronic chart of the Bering Strait
Conventional nautical charts are printed on large sheets of paper at a variety of scales. Mariners will generally carry many charts to provide sufficient detail for the areas they might need to visit. Electronic navigational charts, which use computer software and electronic databases to provide navigation information, can augment or in some cases replace paper charts, though many mariners carry paper charts as a backup in case the electronic charting system fails.
Labeling nautical charts
 Automatically labeled nautical chart
Nautical charts must be labeled with navigational and depth information. There are a few software solutions in the market that do label placement automatically for any kind of map or chart. For more information visit the Wikipedia article on Automatic label placement.
Details on a nautical chart
Pilotage information
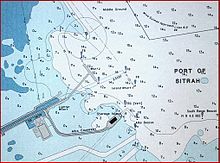
 Detail of a United States NOAA chart, showing a harbour area
The chart uses symbols to provide pilotage information about the nature and position of features useful to navigators, such as sea bed information, sea marks and landmarks. Some symbols describe the sea bed with information such as its depth, materials as well as possible hazards such as shipwrecks. Other symbols show the position and characteristics of buoys, lights, lighthouses, coastal and land features and structures that are useful for position fixing.
Colours distinguish between man-made features, dry land, sea bed that dries with the tide and seabed that is permanently underwater and indicate water depth.
Depths and Heights
 Use of colour in British Admiralty charts
Depths which have been measured are indicated by the numbers shown on the chart. Depths on charts published in most parts of the world use metres. Older charts, as well as those published by the United States government, may use feet or fathoms. Depth contour lines show the shape of underwater relief. Coloured areas of the sea emphasise shallow water and dangerous underwater obstructions. Depths are measured from the chart datum, which is related to the local sea level. The chart datum varies according to the standard used by each National Hydrographic Office.In general, the move is towards using Lowest Astronomical Tide (LAT), the lowest tide predicted in the full tidal cycle, but in non-tidal areas and some tidal areas Mean Sea Level (MSL) is used.
Heights eg a lighthouse, are generally given relative to Mean High Water Springs,(MHWS). Vertical clearances eg below a bridge or cable are given relative to Highest Astronomical Tide (HAT). The chart will indicate what datum is in use.
The use of HAT for heights, and LAT for depths, means that the mariner can quickly look at the chart to ensure that they have sufficient clearance to pass any obstruction, though they may have to calculate height of tide to ensure their safety.
Tidal information
Tidal races and other strong currents have special chart symbols. Tidal flow information may be shown on charts using tidal diamonds, indicating the speed and bearing of the tidal flow during each hour of the tidal cycle.
See also
- Aeronautical chart
- Automatic label placement
- Admiralty chart
- European Atlas of the Seas
Further reading
- Calder, Nigel (2008). How to Read a Nautical Chart. McGraw-Hill Professional. ISBN 978-0-07-159287-1.
References
- ^ http://marine.geogarage.com/routes
- ^ http://www.OpenSeaMap.org
- ^ http://www.teamsurv.eu
- ^ Calder, Nigel. How to Read a Navigational Chart: A Complete Guide to the Symbols, Abbreviations, and Data Displayed on Nautical Charts. International Marine/Ragged Mountain Press, 2002.
- ^ British Admiralty. The Mariner's Handbook. 1999 edition, page 23.
External links
- Online version of Chart No.1 with "Symbols, Abbreviations and Terms" used in nautical charts
- Nautical Charts - chapter from the online edition of Nathaniel Bowditch's American Practical Navigator
- Nautical chart of the Eastern Approaches to the Solent
- Portolan Chart of Gabriel de Vallseca, 1439
- Guides to Nautical Chart Symbols
- Nautical chart of New York Harbor
- Nautical chart symbols for aids to navigation
General References American Practical Navigator
Nautical Charts Chart correctionLights and Buoys Geographic Information Celestial Navigation Tidal Information Radio Information Periodicals Categories:- Hydrography
- Infographics
- Map types
- Navigation


Wikimedia Foundation. 2010.