- Demographics of Sri Lanka
-
This article is about the demographic features of the population of Sri Lanka, including population density, ethnicity, education level, health of the populace, economic status, religious affiliations and other aspects of the population.
Sri Lanka is an island in the Indian Ocean also called Ceylon and many other names. It is about 28 kilometers (18 mi.) off the southeastern coast of India with a population of about 20 million. Density is highest in the southwest where Colombo, the country's main port and industrial center, is located. The net population growth is about 0,7%. Sri Lanka is ethnically, linguistically, and religiously diverse.
Contents
People
Sinhalese, an Indo-Aryan group make up 73.8% of the population (according to 1981 census) and are concentrated in the densely populated southwest and central parts of the Island. The Sri Lanka Tamils, a Dravidian group, live predominantly in the northeast of the island forming the largest minority group at 12.6% (according to the 1981 census) of the population. The Sri Lankan population after 1981 census are based on estimations given that large areas of northern Sri Lanka were under LTTE control and that large numbers of Tamils have fled abroad. See Sri Lankan Tamil diaspora.
There are also Indian Tamils who form distinct ethnic group which comprises 5.1% of the population. The British brought them to Sri Lanka in the 19th century as tea and rubber plantation workers, and they remain concentrated in the "tea country" of south-central Sri Lanka. In accordance with a 1964 agreement with India, Sri Lanka granted citizenship to 230,000 "stateless" Indian Tamils in 1988. Under the pact, India granted citizenship to the remainder, some 200,000 of whom now live in India. Another 75,000 Indian Tamils, who themselves or whose parents once applied for Indian citizenship, now wish to remain in Sri Lanka. The government has stated these Tamils will not be forced to return to India, although they are not technically citizens of Sri Lanka.
The Moors, who descend from Arab traders that settled in Sri Lanka, form the third largest ethnic group at 7.2% of the population. They are mostly concentrated in urban areas in the southern parts of the island with substantial populations in the Central and Eastern provinces. During times of Portuguese colonization, Moors were persecuted, and many forced to retreat to the central highlands and the eastern coast.
Smaller minorities include the Malays who descent from South East Asian settlers, and the Burghers, who are descendants of European colonists, principally from Portugal, the Netherlands and the UK.
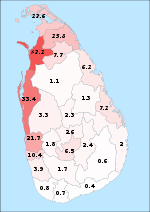
Some one edited this and the numbers are wrong. Please visit Sri Lanka government web site for correct informationSinhalese [%] Native Tamils [%] Tamils of Indian origin [%] Moors [%] Burghers [%] 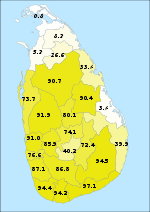
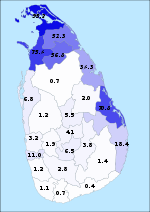
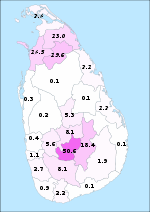
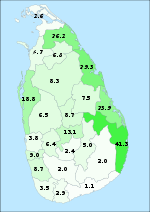
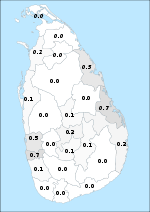
Major ethnic groups in Sri Lanka. The percentages shown are from 2001 or 1981 (cursive) census.[1] Population of Sri Lanka by ethnic group 1881 to 2001
Year Sinhalese Sri Lankan Tamil1 Indian Tamil1 Sri Lankan Moor Others Total No. % No. % No. % No. % No. % No. % 1881 Census 1,846,600 66.91% 687,200 24.90% 184,500 6.69% 41,400 1.50% 2,759,700 100.00% 1891 Census 2,041,200 67.86% 723,900 24.07% 197,200 6.56% 45,500 1.51% 3,007,800 100.00% 1901 Census 2,330,800 65.36% 951,700 26.69% 228,000 6.39% 55,500 1.56% 3,566,000 100.00% 1911 Census 2,715,500 66.13% 528,000 12.86% 531,000 12.93% 233,900 5.70% 98,000 2.39% 4,106,400 100.00% 1921 Census 3,016,200 67.05% 517,300 11.50% 602,700 13.40% 251,900 5.60% 110,600 2.46% 4,498,600 100.00% 1931 Estimate 3,473,000 65.45% 598,900 11.29% 818,500 15.43% 289,600 5.46% 126,000 2.37% 5,306,000 100.00% 1946 Census 4,620,500 69.41% 733,700 11.02% 780,600 11.73% 373,600 5.61% 148,900 2.24% 6,657,300 100.00% 1953 Census 5,616,700 69.36% 884,700 10.93% 974,100 12.03% 464,000 5.73% 158,400 1.96% 8,097,900 100.00% 1963 Census 7,512,900 71.00% 1,164,700 11.01% 1,123,000 10.61% 626,800 5.92% 154,600 1.46% 10,582,000 100.00% 1971 Census 9,131,300 71.96% 1,424,000 11.22% 1,174,900 9.26% 828,300 6.53% 131,400 1.04% 12,689,900 100.00% 1981 Census 10,979,400 73.95% 1,886,900 12.71% 818,700 5.51% 1,046,900 7.05% 114,900 0.77% 14,846,800 100.00% 1989 Estimate 12,437,000 73.92% 2,124,000 12.62% 873,000 5.19% 1,249,000 7.42% 142,000 0.84% 16,825,000 100.00% 2001 Census2 Sources:[2][3] 1 Indian Tamils were only classified as a separate ethnic group from 1911 onwards. Prior to this they were included with Sri Lankan Tamils. 2 2001 Census was only carried out in 18 of the 25 districts. Inclusion of data would be misleading.
Religion
Main article: Religion in Sri LankaMost Sinhalese are Buddhist; most Tamils are Hindu. The Malays and Moors are Muslim. Sizable minorities of both Sinhalese and Tamils are Christians, most of whom are Roman Catholic. The Burgher population is mostly Roman Catholic or Presbyterian. The Veddahs have Animist and Buddhist practices. The 1978 constitution, while assuring freedom of religion, grants primacy to Buddhism.
Buddhism [70%] Hinduism [15%] Islam [7.5%] Christianity [7.5%] 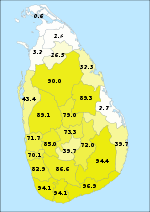
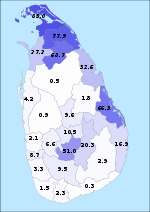
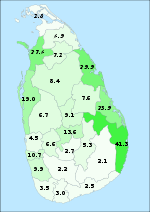
Distribution of the four major denominations in Sri Lanka. The percentages shown are from 2001 census except where the numbers are cursive, which are from 1981 census. Population movements have occurred after 1981, but accurate statistics do not exist for these districts.[1] Population of Sri Lanka by religion 1881 to 2001
Year Buddhist Hindu Muslim Christian Others Total No. % No. % No. % No. % No. % No. % 1881 Census 1,698,100 61.53% 593,600 21.51% 197,800 7.17% 268,000 9.71% 2,300 0.08% 2,759,800 100.00% 1891 Census 1,877,000 62.40% 615,900 20.48% 212,000 7.05% 302,100 10.04% 800 0.03% 3,007,800 100.00% 1901 Census 2,141,400 60.06% 826,800 23.19% 246,100 6.90% 349,200 9.79% 2,500 0.07% 3,566,000 100.00% 1911 Census 2,474,200 60.25% 938,300 22.85% 283,600 6.91% 409,200 9.96% 1,100 0.03% 4,106,400 100.00% 1921 Census 2,769,800 61.57% 982,100 21.83% 302,500 6.72% 443,400 9.86% 800 0.02% 4,498,600 100.00% 1931 Estimate 3,266,600 61.55% 1,166,900 21.99% 354,200 6.67% 518,100 9.76% 1,100 0.02% 5,306,900 100.00% 1946 Census 4,294,900 64.51% 1,320,400 19.83% 436,600 6.56% 603,200 9.06% 2,200 0.03% 6,657,300 100.00% 1953 Census 5,209,400 64.33% 1,610,500 19.89% 541,500 6.69% 724,400 8.95% 12,100 0.15% 8,097,900 100.00% 1963 Census 7,003,300 66.18% 1,958,400 18.51% 724,000 6.84% 884,900 8.36% 11,400 0.11% 10,582,000 100.00% 1971 Census 8,536,800 67.27% 2,238,600 17.64% 901,700 7.11% 1,004,300 7.91% 8,400 0.07% 12,689,800 100.00% 1981 Census 10,288,300 69.30% 2,297,800 15.48% 1,121,700 7.56% 1,130,600 7.62% 8,300 0.06% 14,846,700 100.00% 2001 Census1 Source:[4] 1 2001 Census was only carried out in 18 of the 25 districts. Inclusion of data would be misleading.
Languages
 Tamil script (left) and Sinhala script (right) on a political poster
Sinhala, an Indo-European language, is the native tongue of the Sinhalese. Tamils speak Tamil, a Dravidian language. The Moors speak an Arab-Tamil dialect, consisting of a large number of Arabic words while The Malays speak Sri Lanka Malay. Many of the Burghers speak Sri Lankan Indo-Portuguese although its use has declined and all speak Sinhala. The Veddahs speak a language closely related to Sinhala. Use of English has declined since independence, but it continues to be spoken by many in the middle and upper middle classes, particularly in Colombo. The government is seeking to reverse the decline in the use of English, mainly for economic but also for political reasons. Both Sinhala and Tamil are official languages.
CIA World Factbook demographic statistics
The following demographic statistics are from the CIA World Factbook, unless otherwise indicated.
 Demographics of Sri Lanka, Data of FAO, year 2005 ; Number of inhabitants in thousands.
Population
21,513,990
note: since the outbreak of hostilities between the government and armed Tamil separatists in the mid-1980s, several hundred thousand Tamil civilians have fled the island and more than 200,000 Tamils have sought refuge in the West (July 2010 est.)Age structure
0–14 years: 26% (male 2,605,251; female 2,490,416)
15–64 years: 67% (male 6,285,118; female 6,606,196)
65 years and over: 7% (male 602,470,000; female 649,124,000) (2000 est.)
0-14 years: 23.9% (male 2,594,815/female 2,493,002)
15-64 years: 68% (male 7,089,307/female 7,418,123)
65 years and over: 8.1% (male 803,172/female 926,372) (2010 est.)Population growth rate
0.89% (2000 est.) not 0.86% (2010 est.)
Birth rate
16.79 births/1,000 population (2000 est.)
15.88 births/1,000 population (2010 est.)
Death rate
6.43 deaths/1,000 population (2000 est.)
6.2 deaths/1,000 population (2010 est.)
Net migration rate
-1.05 migrant(s)/1,000 population (2010 est.)
Sex ratio
at birth: 1.05 male(s)/female
under 15 years: 1.05 male(s)/female
15–64 years: 0.95 male(s)/female
65 years and over: 0.93 male(s)/female
total population: 0.97 male(s)/female (2000 est.)Infant mortality rate
16.51 deaths/1,000 live births (2000 est.)
18.14 deaths/1,000 live births (2010 est.)
Life expectancy at birth
total population: 75.3 years
male: 73.22 years
female: 77.47 years (2010 est.)Total fertility rate
1.98 children born/woman (2000 est.)
1.96 children born/woman (2010 est.)
Nationality
noun: Sri Lankan(s)
adjective: Sri LankanEthnic group
Sinhalese 73.8%, Sri Lankan Tamil 13.9%, Sri Lankan Moors 7.2%, Indian Tamil 4.6%, Others Burgher, Sri Lankan Malay, and Veddah 0.5%,
These figures are based on the 2001 census which was only carried out partially in the Northern and Eastern provinces, where the majority of Sri Lankan Tamils live. Therefore the Sri Lankan Tamil percentage is grossly understated. The Sri Lankan government estimates that the Tamils (Sri Lankan and Indian) account for 18% of the population.[5]
Religions
Buddhism 69.1%, Islam 7.6%, Hinduism 7.1%, Christianity 6.2%, unspecified 10% (2001 census provisional data)
Languages
Sinhala (official and national language) 74%, Tamil (official and national language) 18%
note: English is commonly used in government and is spoken competently by about 40% of the populationLiteracy
definition: age 15 and over can read and write
total population: 90.7%
male: 92.3%
female: 89.1% (2001 est.)See also
- Health in Sri Lanka
- Sri Lanka
References
- ^ a b Department of Census and Statistics
- ^ Population by ethnic group, census years, Statistical Abstract 2008, Department of Census & Statistics
- ^ Estimated mid year population by ethnic group, 1980 - 1989, Statistical Abstract 2008, Department of Census & Statistics
- ^ Population by religion, census years, Statistical Abstract 2008, Department of Census & Statistics
- ^ "Sri Lanka Facts". Government of Sri Lanka Official Web Portal. http://www.gov.lk/info/index.asp?mi=19&xp=0&xi=52&o=0&t=. Retrieved 22 August 2009.[dead link]
External links
Ethnic groups in Asia Sovereign
states- Afghanistan
- Armenia
- Azerbaijan
- Bahrain
- Bangladesh
- Bhutan
- Brunei
- Burma (Myanmar)
- Cambodia
- People's Republic of China
- Cyprus
- East Timor (Timor-Leste)
- Egypt
- Georgia
- India
- Indonesia
- Iran
- Iraq
- Israel
- Japan
- Jordan
- Kazakhstan
- North Korea
- South Korea
- Kuwait
- Kyrgyzstan
- Laos
- Lebanon
- Malaysia
- Maldives
- Mongolia
- Nepal
- Oman
- Pakistan
- Philippines
- Qatar
- Russia
- Saudi Arabia
- Singapore
- Sri Lanka
- Syria
- Tajikistan
- Thailand
- Turkey
- Turkmenistan
- United Arab Emirates
- Uzbekistan
- Vietnam
- Yemen
States with limited
recognition- Abkhazia
- Nagorno-Karabakh
- Northern Cyprus
- Palestine
- Republic of China (Taiwan)
- South Ossetia
Dependencies and
other territories- Christmas Island
- Cocos (Keeling) Islands
- Hong Kong
- Macau
Categories:


Wikimedia Foundation. 2010.