- Demographics of Switzerland
-
This article is about the demographic features of the population of Switzerland, including population density, ethnicity, education level, health of the populace, economic status, religious affiliations and other aspects of the population.
Switzerland has a population of 7.8 million as of 2010. Its population has quadrupled over the period 1800 to 1990 (average doubling time 95 years). Population growth was steepest in the period after World War II (1.4% per annum during 1950-1970, doubling time 50 years), it slowed down during the 1970s to 1980s and has since again picked up to 1% during the 2000s (doubling time 70 years).
More than 75% of the population live in the central plain, which stretches between the Alps and the Jura Mountains and from Geneva in the southwest to the Rhine River and Lake Constance in the northeast. Resident foreigners and temporary foreign workers make up about 20% of the population.
Encompassing the Central Alps, Switzerland sits at the crossroads of several major European cultures. Its population includes a two-thirds majority of Alemannic German speakers and a one-quarter Latin minority (French, Italian and Romansh), see linguistic geography of Switzerland. 10% of the population natively speak an immigrant language.
Switzerland consistently ranks high on quality of life indices, including per capita income, concentration of computer and internet usage per capita, insurance coverage per individual, and health care rates. For these and many other reasons, such as the four languages, it serves as an excellent test market for businesses hoping to introduce new products into Europe.
 The population of Switzerland 1970-2005. Data from Swiss Federal Statistical Office 2005; number of inhabitants in thousands.
Contents
Census
The Federal Population Census (German: Eidgenössische Volkszählung, French: Recensement fédéral de la population, Italian: Censimento federale della popolazione, Romansh: Dumbraziun federala dal pievel) has been carried out every 10 years starting in 1850.[1] The census was initiated by Federal Councillor Stefano Franscini, who evaluated the data of the first census all by himself after Parliament failed to provide the necessary funds.[2] The census is now being conducted by the Swiss Federal Statistical Office, which makes most results available on its website.
Collected data includes population data (citizenship, place of residence, place of birth, position in household, number of children, religion, languages, education, profession, place of work, etc.), household data (number of individuals living in the household, etc.), accommodation data (surface area, amount of rent paid, etc.) and building data (geocoordinates, time of construction, number of floors, etc.). Participation is compulsory and reached 99.87% of the population in 2000.[3]
Starting in 2010, the census will cease to be conducted through written questionnaires distributed nationwide. Instead, data in existing population registers will be used. That data will be supplemented with a biannual questionnaire sample of 200,000 people as well as regular microcensuses.[4] The motivation for this change was financial, as the full census created costs for the federation of the order of CHF 100 million. The change was criticized by experts as degrading the statistical basis for numerous applications in demographic planning.[5]
Population
Total of registered residents (numbers relate to 31 December):[6][7]
year total male female Swiss foreign 2009 7,785,800 3,830,600 (49.2% ) 3,955,200 {50.8% } 6,071,800 (78.0% ) 1,714,000 (22.0% ) 2008 7,701,900 3,786,700 (49.2% ) 3,915,200 (50.8% ) 6,032,100 (78.3% ) 1,669,700 (21.7% ) 2007 7,593,500 3,727,000 (49.1% ) 3,866,500 (50.9% ) 5,991,400 (78.9% ) 1,602,100 (21.1% ) 2006 7,508,700 3,679,400 (49.0% ) 3,829,400 (51.0% ) 5,954,200 (79.3% ) 1,554,500 (20.7% ) 2005 7,459,100 3,652,500 (49.0% ) 3,806,600 (51.0% ) 5,917,200 (79.3% ) 1,541,900 (20.7% ) 2004 7,415,100 3,628,700 (48.9% ) 3,786,400 (51.1% ) 5,890,400 (79.4% ) 1,524,700 (20.6% ) 2003 7,364,100 3,601,500 (48.9% ) 3,762,600 (51.1% ) 5,863,200 (79.6% ) 1,500,900 (20.4% ) 2002 7,313,900 3,575,000 (48.9% ) 3,738,800 (51.1% ) 5,836,900 (79.8% ) 1,477,000 (20.2% ) 2001 7,255,700 3,544,300 (48.8% ) 3,711,300 (51.2% ) 5,808,100 (80.0% ) 1,447,600 (20.0% ) 2000 7,204,100 3,519,700 (48.9% ) 3,684,400 (51.1% ) 5,779,700 (80.2% ) 1,424,400 (19.8% ) 1990 6,750,700 3,298,300 (48.9% ) 3,452,400 (51.1% ) 5,623,600 (83.3% ) 1,127,100 (16.7% ) 1980 6,335,200 3,082,000 (48.6% ) 3,253,300 (51.4% ) 5,421,700 (85.6% ) 913,500 (14.4% ) 1970 6,193,100 3,025,300 (48.8% ) 3,167,700 (51.1% ) 5,191,200 (83.8% ) 1,001,900 (16.2% ) 1960–1970 5,429,061 - - - - (10,8% ) 1950–1960 4,714,992 - - - - (6,1% ) 1941–1950 4,265,703 - - - - (5,2% ) 1930–1941 4,066,400 - - - - (8,7% ) 1920–1930 3,880,320 - - - - (10,4% ) 1910–1920 3,753,293 - - - - (14,7% ) 1900–1910 3,315,443 - - - - (11,6% ) 1888–1900 2,917,754 - - - - (7,8% ) 1880–1888 2,831,787 - - - - (7,4% ) 1870–1880 2,655,001 - - - - (5,7% ) 1860–1870 2,510,494 - - - - (4,6% ) 1850–1860 2,392,740 - - - - (2,9% ) 1837–1850 2,190,258 - - - - (- ) 1798–1837 1,664,832 - - - - (- ) Growth rate
During the 19th and 20th centuries, population growth rate has been at 0.7% to 0.8%, with a doubling time of ca. 90 years. In the later 20th century, the growth rate has fallen below 0.7% (1980s: 0.64%; 1990s: 0.65%), and in the 2000s it has risen again slightly (2000–2006: 0.69%), mostly due to immigration. In 2007 the population grew at a much higher 1.1% rate, again mostly due to immigration. For 2008, the population grew 1.6%, a level not seen since the early 1960s.[8]
Total fertility rate[9]
- 1.46 children born/woman (total)
- 1.33 children born/Swiss woman
- 1.86 children born/non-Swiss woman
Vital statistics since 1900[10][11]
Average population (x 1000) Live births Deaths Natural change Crude birth rate (per 1000) Crude death rate (per 1000) Natural change (per 1000) 1900 3 300 94 316 63 606 30 710 28.6 19.3 9.3 1901 3 341 97 028 60 018 37 010 29.0 18.0 11.1 1902 3 384 96 480 57 702 38 778 28.5 17.1 11.5 1903 3 428 93 824 59 626 34 198 27.4 17.4 10.0 1904 3 472 94 867 60 857 34 010 27.3 17.5 9.8 1905 3 516 94 653 61 800 32 853 26.9 17.6 9.3 1906 3 560 95 595 59 204 36 391 26.9 16.6 10.2 1907 3 604 94 508 59 252 35 256 26.2 16.4 9.8 1908 3 647 96 245 57 697 38 548 26.4 15.8 10.6 1909 3 691 94 112 59 416 34 696 25.5 16.1 9.4 1910 3 735 93 514 56 498 37 016 25.0 15.1 9.9 1911 3 776 91 320 59 619 31 701 24.2 15.8 8.4 1912 3 819 92 196 54 102 38 094 24.1 14.2 10.0 1913 3 864 89 757 55 427 34 330 23.2 14.3 8.9 1914 3 897 87 330 53 629 33 701 22.4 13.8 8.6 1915 3 883 75 545 51 524 24 021 19.5 13.3 6.2 1916 3 883 73 660 50 623 23 037 19.0 13.0 5.9 1917 3 888 72 065 53 306 18 759 18.5 13.7 4.8 1918 3 880 72 658 75 034 -2 376 18.7 19.3 -0.6 1919 3 869 72 125 54 932 17 193 18.6 14.2 4.4 1920 3 877 81 190 55 992 25 198 20.9 14.4 6.5 1921 3 876 80 808 49 518 31 290 20.8 12.8 8.1 1922 3 874 76 290 50 292 25 998 19.7 13.0 6.7 1923 3 883 75 551 45 983 29 568 19.5 11.8 7.6 1924 3 896 73 508 48 988 24 520 18.9 12.6 6.3 1925 3 910 72 570 47 877 24 693 18.6 12.2 6.3 1926 3 932 72 118 46 452 25 666 18.3 11.8 6.5 1927 3 956 69 533 49 202 20 331 17.6 12.4 5.1 1928 3 988 69 594 48 063 21 531 17.4 12.1 5.4 1929 4 022 69 006 50 438 18 568 17.2 12.5 4.6 1930 4 051 69 855 46 939 22 916 17.2 11.6 5.7 1931 4 080 68 249 49 414 18 835 16.7 12.1 4.6 1932 4 102 68 650 49 911 18 739 16.7 12.2 4.6 1933 4 122 67 509 47 181 20 328 16.4 11.4 4.9 1934 4 140 67 277 46 806 20 471 16.3 11.3 4.9 1935 4 155 66 378 50 233 16 145 16.0 12.1 3.9 1936 4 168 64 966 47 650 17 316 15.6 11.4 4.2 1937 4 180 62 480 47 274 15 206 14.9 11.3 3.6 1938 4 192 63 790 48 576 15 214 15.2 11.6 3.6 1939 4 206 63 837 49 484 14 353 15.2 11.8 3.4 1940 4 226 64 115 50 759 13 356 15.2 12.0 3.2 1941 4 254 71 926 47 336 24 590 16.9 11.1 5.8 1942 4 286 78 875 46 928 31 947 18.4 10.9 7.5 1943 4 323 83 049 47 409 35 640 19.2 11.0 8.2 1944 4 364 85 627 52 336 33 291 19.6 12.0 7.6 1945 4 412 88 522 51 086 37 436 20.1 11.6 8.5 1946 4 467 89 126 50 276 38 850 20.0 11.3 8.7 1947 4 524 87 724 51 384 36 340 19.4 11.4 8.0 1948 4 582 87 763 49 679 38 084 19.2 10.8 8.3 1949 4 639 85 308 49 497 35 811 18.4 10.7 7.7 1950 4 694 84 776 47 372 37 404 18.1 10.1 8.0 1951 4 749 81 903 49 952 31 951 17.2 10.5 6.7 1952 4 815 83 549 47 624 35 925 17.4 9.9 7.5 1953 4 878 83 029 49 684 33 345 17.0 10.2 6.8 1954 4 929 83 741 49 113 34 628 17.0 10.0 7.0 1955 4 980 85 331 50 366 34 965 17.1 10.1 7.0 1956 5 045 87 912 51 573 36 339 17.4 10.2 7.2 1957 5 126 90 823 51 066 39 757 17.7 10.0 7.8 1958 5 199 91 421 49 281 42 140 17.6 9.5 8.1 1959 5 259 92 973 50 077 42 896 17.7 9.5 8.2 1960 5 362 94 372 52 094 42 278 17.6 9.7 7.9 1961 5 434 99 238 51 004 48 234 18.3 9.4 8.9 1962 5 574 104 322 55 125 49 197 18.7 9.9 8.8 1963 5 694 109 993 56 989 53 004 19.3 10.0 9.3 1964 5 789 112 890 53 609 59 281 19.5 9.3 10.2 1965 5 856 111 835 55 547 56 288 19.1 9.5 9.6 1966 5 918 109 738 55 804 53 934 18.5 9.4 9.1 1967 5 992 107 417 55 142 52 275 17.9 9.2 8.7 1968 6 068 105 130 57 342 47 788 17.3 9.4 7.9 1969 6 136 102 520 58 002 44 518 16.7 9.5 7.3 1970 6 181 99 216 57 091 42 125 16.1 9.2 6.8 1971 6 213 96 261 57 856 38 405 15.5 9.3 6.2 1972 6 261 91 342 56 489 34 853 14.6 9.0 5.6 1973 6 307 87 518 56 990 30 528 13.9 9.0 4.8 1974 6 341 84 507 56 403 28 104 13.3 8.9 4.4 1975 6 339 78 464 55 924 22 540 12.4 8.8 3.6 1976 6 303 74 199 57 095 17 104 11.8 9.1 2.7 1977 6 281 72 829 55 658 17 171 11.6 8.9 2.7 1978 6 281 71 375 57 718 13 657 11.4 9.2 2.2 1979 6 294 71 986 57 454 14 532 11.4 9.1 2.3 1980 6 319 73 661 59 097 14 564 11.7 9.4 2.3 1981 6 354 73 747 59 763 13 984 11.6 9.4 2.2 1982 6 391 74 916 59 204 15 712 11.7 9.3 2.5 1983 6 419 73 659 60 756 12 903 11.5 9.5 2.0 1984 6 442 74 710 58 602 16 108 11.6 9.1 2.5 1985 6 470 74 684 59 583 15 101 11.5 9.2 2.3 1986 6 504 76 320 60 105 16 215 11.7 9.2 2.5 1987 6 545 76 505 59 511 16 994 11.7 9.1 2.6 1988 6 593 80 345 60 648 19 697 12.2 9.2 3.0 1989 6 647 81 180 60 882 20 298 12.2 9.2 3.1 1990 6 712 83 939 63 739 20 200 12.5 9.5 3.0 1991 6 800 86 200 62 634 23 566 12.7 9.2 3.5 1992 6 875 86 910 62 302 24 608 12.6 9.1 3.6 1993 6 938 83 762 62 512 21 250 12.1 9.0 3.1 1994 6 994 82 980 61 987 20 993 11.9 8.9 3.0 1995 7 041 82 203 63 387 18 816 11.7 9.0 2.7 1996 7 072 83 007 62 637 20 370 11.7 8.9 2.9 1997 7 089 79 485 59 967 19 518 11.2 8.5 2.8 1998 7 110 78 949 62 569 16 380 11.1 8.8 2.3 1999 7 144 78 408 62 503 15 905 11.0 8.7 2.2 2000 7 184 78 458 62 528 15 930 10.9 8.7 2.2 2001 7 230 73 509 61 287 12 222 10.2 8.5 1.7 2002 7 285 72 372 61 768 10 604 9.9 8.5 1.5 2003 7 339 71 848 63 070 8 778 9.8 8.6 1.2 2004 7 390 73 082 60 180 12 902 9.9 8.1 1.7 2005 7 437 72 903 61 124 11 779 9.8 8.2 1.6 2006 7 484 73 371 60 283 13 088 9.8 8.1 1.7 2007 7 551 74 494 61 089 13 405 9.9 8.1 1.8 2008 7 648 76 691 61 233 15 458 10.0 8.0 2.0 2009 7 742 78 286 62 476 15 810 10.1 8.1 2.0 2010 (p) 7 823 80 000 62 500 17 500 10.2 8.0 2.2 p=preliminary
Age structure
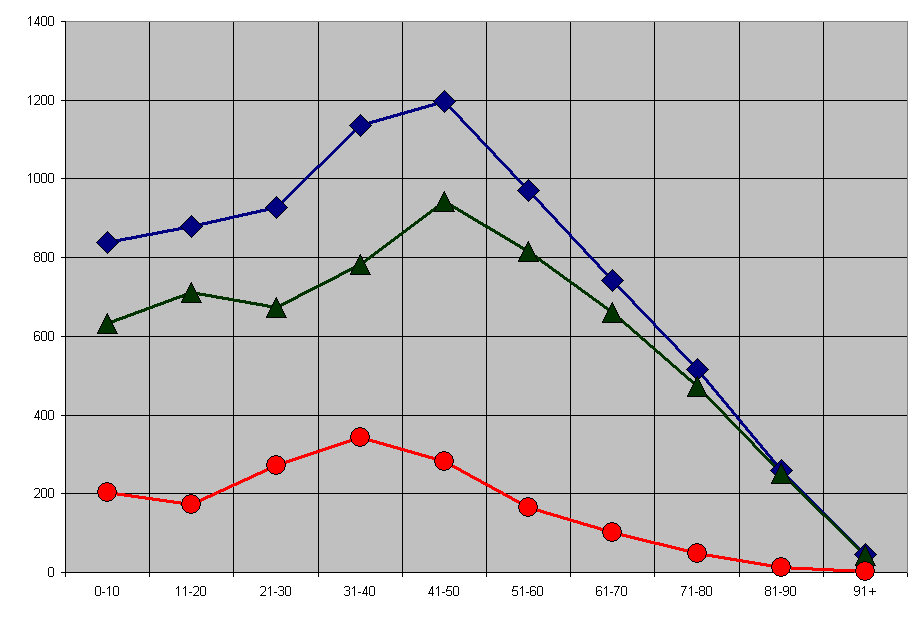
 Age Structure 2007. Blue diamonds represent total population in thousands, green triangles represent Swiss Citizens in thousands, and red circles represent foreign population in thousands.
age total(in thousands) percent Swiss (in thousands) foreign (in thousands) 0-10 838.4 11.0% 633.6 202.3 (24%) 11-20 879.6 11.6% 712.0 172.2 (19%) 21-30 926.8 12.2% 674.0 272.7 (29%) 31-40 1,136.8 15.0% 782.9 342.7 (19%) 41-50 1,197.4 15.8% 942.1 282.4 (29%) 51-60 970.1 12.8% 814.9 164.1 (17%) 61-70 740.8 9.8% 661.5 102.4 (14%) 71-80 515.0 6.8% 473.2 47.9 (9%) 81-90 258.2 3.4% 252.6 13.5 (5%) 91+ 45.6 0.6% 44.4 1.9 (4%) Data: Swiss Federal Statistics Office[12]
As population growth curbs, the percentage of elderly people increases. In July 2006, the Swiss Federal Office of Statistics published a projection estimating that by 2050, one in three adult Swiss will be of retirement age (as opposed to one in five in 2005). Total population was projected to stagnate in 2036 at around 8.1 million and fall slightly to 8 million in 2050. The predicted age structure for 2050 is:
- 0-20 years: 1,4 million (18%)
- 20-64 years: 4,4 million (55%)
- 65 and over: 2,2 million (27%)
Sex ratio
age males (in thousands) females (in thousands) ratio (male/female) at birth 38.1 36.2 1.05 0-15 651.8 615.6 1.06 16-64 2,551.0 2,530.0 1.01 65+ 524.3 720.9 0.73 total 3,727.0 3,866.5 0.96 Data: Swiss Federal Statistics Office[12] 2007
Life expectancy at birth
According to statistics released by the federal government in 2008, life expectancy stands at 79.7 years for men and 84.4 years for women, for an overall average of 82.1 years for the populace as a whole.[13]
Nationality
Further information: Swiss people and Immigration to SwitzerlandThe number of registered resident foreigners was 1,001,887 (16.17%) in 1970. This amount decreased to 904,337 (14.34%) in 1979, and has increased steadily since that time, passing the 20% mark during 2001 and rising to 1,524,663 (20.56%) in 2004. The number of Swiss citizens thus numbered about 5.9 million in that year.
In 2007, 1.45 million resident foreigners (85.4%, or 19.1% of the total population[14]), had European citizenship (Italian: 295,507; German: 224,324; citizens of Serbia and Montenegro: 196,078; Portuguese: 193,299; French: 83,129; Turkish: 75,382; Spanish: 66,519, Macedonian: 60,509; Bosnian: 41,654; Croatian: 38,144; Austrian: 36,155; British: 32,207). ; 109,113 residents were from Asia; 69,010 from the Americas; 66,599 from Africa; and 3,777 from Oceania.[15]
In 2004, 35,700 people acquired Swiss citizenship according to Swiss nationality law, a figure slightly larger than that of the previous year (35,424), and four times larger than the 1990 figure (8,658). About a third of those naturalized are from a successor state of Former Yugoslavia: 7,900 Serbia-Montenegro, 2,400 Bosnia-Herzegowina, 2,000 Macedonia, 1,600 Croatia. 4,200 were from Italy, 3,600 from Turkey, 1,600 from Sri Lanka, 1,200 from Portugal, and 1,200 from France.[16]
The yearly rate of naturalization has quintupled over the 1990s and 2000s, from roughly 9,000 to 45,000. Relative to the population of resident foreigners, this amounts to an increase from 8‰ in 1990 to 27‰ in 2007, or relative to the number of Swiss citizens from 1.6‰ in 1990 to 7.3‰ in 2007. The following table shows the historical development of the rate of naturalization.[17]
year naturalizations fraction of resident foreigners fraction of citizens 1990 8,660 7.6‰ 1.6‰ 1991 8,760 ‰ ‰ 1992 11,100 ‰ ‰ 1993 12,900 ‰ ‰ 1994 13,700 ‰ ‰ 1995 16,800 ‰ ‰ 1996 19,200 ‰ ‰ 1997 19,200 ‰ ‰ 1998 21,300 ‰ ‰ 1999 20,300 ‰ ‰ 2000 28,700 ‰ ‰ 2001 27,600 ‰ ‰ 2002 36,500 ‰ ‰ 2003 35,400 ‰ ‰ 2004 35,700 23.4‰ 6.0‰ 2005 38,400 25.7‰ 6.4‰ 2006 46,700 30.9‰ 7.8‰ 2007 43,900 27.4‰ 7.3‰ 2008 44,400 28‰ In recent decades, many Portuguese and Ukrainians from Ukraine represent large immigrant communities in the country[citation needed]. Tamil refugees fleeing from war in Sri Lanka are the largest number of Asians, while Albanians and other former Yugoslavians continue to grow in number. Switzerland is also the second largest European country in number of acceptance of Iraqi refugees fleeing from the violence in Iraq since 2003, but behind Great Britain, Germany and Sweden in the number of Iraqis taken residence for a European country.
In 2004, 623,100 Swiss citizens (8.9%) lived abroad, the largest group in France (166,200), followed by the USA (71,400) and Germany (70,500). (see Swiss diaspora).
Religions
Main article: Religion in Switzerland Distribution of denominations in Switzerland in 2008 (green: Protestant, red: Catholic)
In 2000, 5.78 million residents (79.2%, compared to 93.8% in 1980) were Christian (Roman Catholic 41.8%, Protestant 35.3%, Orthodox 1.8%). 809,800 (11.1%, compared to 3.8% in 1980) were without any religious affiliation. 310,800 (4.3%) were Muslim (compared to 0.9% in 1980), 17,900 (0.2%) were Jewish. These numbers are based on membership in a congregation, not on direct statements of belief. The 2005 Eurobarometer poll[18] found 48% of Swiss residents to be theist, 39% expressing belief in "some sort of spirit or life force", 9% atheist and 4 % said that they "don't know".
Languages
Main article: Languages of SwitzerlandThe four national languages of Switzerland are German, French, Italian and Romansh. Native speakers number about 64% (4.6 million) for German (mostly Swiss German dialects), 20% (1.5 million, mostly Swiss French, but including some Franco-Provençal dialects) for French, 7% (0.5 million, mostly Swiss Italian, but including Insubric dialects) for Italian and less than 0.5% (35,000) for Romansh.
The non-official language with the largest group of native speakers is Serbo-Croatian with 103,000 speakers in 2000, followed by Albanian with 95,000, Portuguese with 89,500, Spanish with 77,500, English with 73,000, Macedonian 61,300,[20] and a total of 173,000 speakers of other languages, amounting to roughly 10% of the population with a native language not among the four official languages.[21]
Education
Main article: Education in SwitzerlandAlmost all Swiss are literate. Switzerland's 13 institutes of higher learning enrolled 99,600 students in the academic year of 2001-02. About 25% of the adult population hold a diploma of higher learning. According to the CIA World Factbook data for 2003, 99% of the Swiss population aged 15 and over could read and write, with the rate being identical for both sexes.[22]
During the 2008/09 school year there were 1,502,257 students in the entire Swiss educational system. In kindergarten or pre-school, there were 152,919 students (48.6% female). These students were taught by 13,592 teachers (96.0% female) in 4,949 schools, of which 301 were private schools. There were 777,394 students (48.6% female) in the obligatory schools, which include primary and lower secondary schools. These students were taught by 74,501 teachers (66.3% female) in 6,083 schools, of which 614 were private. The upper secondary school system had 337,145 students (46.9% female). They were taught by 13,900 teachers (42.3% female) in 730 schools, of which 240 were private. The tertiary education system had 234,799 students (49.7% female). They were taught by 37,546 teachers (32.8% female) in 367 schools.[23]
Delinquency
Main article: Crime in SwitzerlandFurther information: Gun crime in SwitzerlandThe police registered a total of 553,421 criminal offences in 2009, including 51 killings and 185 attempted murders. There were 666 cases of rape. In the same year, 94,574 adults (85% of them male, 47.4% of them Swiss citizens) were convicted under criminal law. 57.3% of convictions were for traffic offences.[24]
In the same year, 15,064 minors (78.3% of them male, 68.2% of them of Swiss nationality, 76.3% aged between 15 and 18) were convicted.[25]
The number of convictions in the last five years is given in the following table.[26] Each class of crime references the relevant section of the Swiss penal code (Strafgesetzbuch, abbreviated StGB) or the Swiss traffic laws (Strassenverkehrsgesetz, abbr. SVG).
Year Total Convictions Homicide
(Art. 111,112,113,116 StGB)Serious Bodily Injury
(Art. 122 StGB)Minor Bodily Injury
(Art. 123 StGB)Sexual Contact with Children
(Art. 187 StGB)Rape
(Art. 190 StGB)Theft
(Art. 139 StGB)Robbery
(Art. 140 StGB)Receiving Stolen Goods
(Art. 160 StGB)Embezzlement
(Art. 138 StGB)Fraud
(Art. 146 StGB)Narcotics Possession Major Violation of Traffic Laws
(Art. 90 SVG)Drunk Driving
(Art. 91 Abs. 1 Satz 2 SVG)2005 85,605 93 94 2,459 413 109 6,557 489 1,262 910 1,484 2,846 22,163 15,776 2006 90,592 95 105 2,523 382 131 6,569 553 1,196 880 1,521 2,616 21,599 18,439 2007 84,665 93 88 2,248 380 135 5,979 522 922 807 1,607 2,462 21,431 17,355 2008 93,024 95 133 2,635 415 133 6,345 522 905 848 1,665 2,606 25,339 17,836 2009 94,574 84 118 2,578 366 108 6,947 514 924 820 1,506 2,708 25,434 16,708 See also
- List of Swiss people
- Switzerland
- Immigration to Europe
- List of countries by immigrant population
- Politics of Switzerland
- Poverty in Switzerland
- Metropolitan areas in Switzerland
- Albanians in Switzerland
- Italian immigration to Switzerland
References
- ^ with the exceptinos of the censuses of 1888 and 1941.
- ^ History of the Federal Population Census, Swiss Federal Statistical Office, accessed October 2007
- ^ Overview of the Federal Population Census, Swiss Federal Statistical Office, accessed October 2007
- ^ enacted in a law in 2008, SR 431.112
- ^ Swiss Parlament discussion dated 06.10.2005 (German)
- ^ Swiss Federal Statistics Office (2009). "Struktur der ständigen Wohnbevölkerung" (Microsoft Excel). http://www.bfs.admin.ch/bfs/portal/de/index/themen/01/02/blank/key/frauen_und_maenner.html. Retrieved 2010-08-25.
- ^ Head-König, Anne-Lise in Population in German, French and Italian in the online Historical Dictionary of Switzerland.
- ^ "Resident Population in Switzerland 2008" (Press release). Swiss Federal Statistical Office. 27 August 2009. http://www.bfs.admin.ch/bfs/portal/en/index/news/medienmitteilungen.Document.123841.pdf. Retrieved 28 January 2009. (English)
- ^ Swiss Federal Statistics Office
- ^ United Nations Demographic Yearbooks
- ^ Statistik Schweiz
- ^ a b Swiss Federal Statistics Office (2008). "Ständige Wohnbevölkerung nach Alter und Geschlecht" (Microsoft Excel). http://www.bfs.admin.ch/bfs/portal/de/index/themen/01/02/blank/key/frauen_und_maenner.html. Retrieved 2009-01-05.
- ^ Swiss Federal Statistical Office press release #0351-0907-20 dated 2-7-2009 (French)
- ^ Ausländerinnen und Ausländer in der Schweiz - Bericht 2008 (German) (1196 KiB), Swiss Federal Statistical Office, pages 12, 72.
- ^ Ausländerinnen und Ausländer in der Schweiz - Bericht 2008 (German) (1196 KiB), Swiss Federal Statistical Office, page 72.
- ^ Swiss Federal Statistics Office
- ^ [1]Federal Office of Statistics
- ^ available at EU Public Opinion Survey
- ^ Swiss Federal Statistical Office, Federal Population Census 2000
- ^ Swiss Federal Statistics Office-Languages
- ^ Lüdi, Georges; Werlen, Iwar. Recensement Fédéral de la Population 2000 – Le Paysage Linguistique en Suisse. Neuchâtel, avril 2005: Office fédéral de la statistique. Accessed from Encyclopédie statistique de la Suisse on 5 January 2006.
- ^ CIA - The World Factbook -- Switzerland
- ^ Swiss Federal Statistical Office Ueberblick - Schulstufen (German) accessed 15 November 2010
- ^ Swiss Federal Statistical Office Verurteilungen (Erwachsene) - Daten, Indikatoren - Demographische Merkmale der Verurteilten (German) accessed 14 November 2010
- ^ Swiss Federal Statistical Office Jugendstrafurteile - Daten, Indikatoren (German) accessed 15 November 2010
- ^ Swiss Federal Statistical Office Verurteilungen für Verbrechen und Vergehen nach ausgewählten Straftaten (German) accessed 15 November 2010
External links
Demographics of Europe Sovereign
states- Albania
- Andorra
- Armenia
- Austria
- Azerbaijan
- Belarus
- Belgium
- Bosnia and Herzegovina
- Bulgaria
- Croatia
- Cyprus
- Czech Republic
- Denmark
- Estonia
- Finland
- France
- Georgia
- Germany
- Greece
- Hungary
- Iceland
- Ireland
- Italy
- Kazakhstan
- Latvia
- Liechtenstein
- Lithuania
- Luxembourg
- Macedonia
- Malta
- Moldova
- Monaco
- Montenegro
- Netherlands
- Norway
- Poland
- Portugal
- Romania
- Russia
- San Marino
- Serbia
- Slovakia
- Slovenia
- Spain
- Sweden
- Switzerland
- Turkey
- Ukraine
- United Kingdom
- (England
- Northern Ireland
- Scotland
- Wales)
- Vatican City
States with limited
recognition- Abkhazia
- Kosovo
- Nagorno-Karabakh
- Northern Cyprus
- South Ossetia
- Transnistria
Dependencies
and other territories- Åland
- Faroe Islands
- Gibraltar
- Guernsey
- Jan Mayen
- Jersey
- Isle of Man
- Svalbard
Other entities - European Union
 Switzerland topics
History Early History · Old Confederacy · Reformation · Early Modern Switzerland · Napoleonic era · Restauration · During the World Wars · Modern historyLaw Constitution · Civil Code · Law enforcement · Nationality law · Copyright law · Gun politics · Human rights · LGBT rightsPolitics Geography AreasTopicsCantons · Cities · Extreme points · Lakes · Islands · Rivers · Glaciers · Mountains · Mountain passes · CartographyEconomy SIX Swiss Exchange · Berne eXchange · Swiss franc · Banking (list) · Swiss National Bank · Companies · Energy · Science and technology · Taxation · Tourism · Transport · TelecommunicationsMilitary Demographics Culture Symbols Categories:- Swiss society
- Demographics of Switzerland


Wikimedia Foundation. 2010.