- Northern Ireland general election, 1945
-
Northern Ireland general election, 1945 
1938 ←
members14 June 1945 → 1949
membersAll 52 seats to the Northern Ireland House of Commons
27 seats were needed for a majorityFirst party Second party Third party 
Leader Basil Brooke T. J. Campbell Paddy Agnew Party Ulster Unionist Nationalist (NI) Labour (NI) Leader since 1 May 1943 18 January 1934 1938 Leader's seat Lisnaskea Belfast Central South Armagh (defeated) Last election 39 seats (56.8%) 8 seats (4.9%) 1 seat (5.7%) Seats won 33 9 2 Seat change  6
6 1 1
1 1Popular vote 180,342 32,546 66,053 Percentage 50.4% 9.1% 18.5% Swing 6.4% 4.2% 12.8%
Percentage of seats gained by each of the party.
Prime Minister before election
Elected Prime Minister
Northern Ireland 1921–72 
This article is part of the series:
Politics and government of
Northern Ireland 1921–72
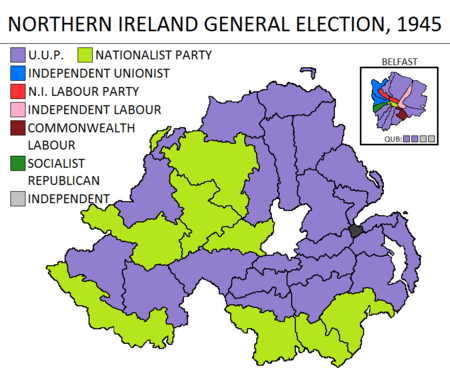
The Northern Ireland general election, 1945 was held on 14 June 1945. Like all other elections to the Parliament of Northern Ireland, it returned a large Ulster Unionist Party majority.
Contents
Results
Northern Ireland General Election 1945 Candidates Votes Party Standing Elected Gained Unseated Net % of total % No. Net % Ulster Unionist 41 33 0 6 - 6 63.5 50.4 180,342 -6.4 Labour (NI) 15 2 2 1 + 1 3.8 18.5 66,053 +12.8 Nationalist (NI) 11 9 3 2 + 1 19.2 9.1 32,546 +4.2 Commonwealth Labour 6 1 1 0 + 1 1.9 7.8 28,079 +7.8 Independent Unionist 5 2 1 1 0 3.8 5.0 17,906 -1.8 Communist (NI) 3 0 0 0 0 3.5 12,456 +3.5 Independent Labour 2 1 0 0 0 1.9 2.8 9,872 +1.1 Socialist Republican 2 1 1 0 + 1 1.9 1.5 5,497 +1.5 Federation of Labour 1 0 0 0 0 1.1 3,912 +1.1 Independent 2 2 2 0 + 2 3.8 0.3 1,219 -1.9 Electorate: 845,964 (509,098 in contested seats); Turnout: 70.3% (357,882).
Votes summary
Seats summary
See also
References
Elections and referendums in Northern Ireland Elections Local government elections 1973 · 1977 · 1981 · 1985 · 1989 · 1993 · 1997 · 2001 · 2005 · 2011Referendums Categories:- General elections in Northern Ireland
- 1945 elections in the United Kingdom
- 1945 in Northern Ireland


Wikimedia Foundation. 2010.