- Nickel Belt
-
For the provincial electoral district, see Nickel Belt (provincial electoral district).
Nickel Belt  Ontario electoral district
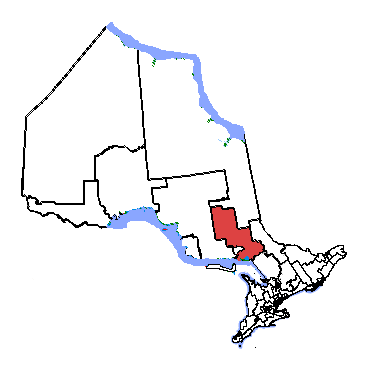
Nickel Belt in relation to other Ontario electoral districts Federal electoral district Legislature House of Commons MP
Claude Gravelle
NDPDistrict created 1952 First contested 1953 Last contested 2008 District webpage profile, map Demographics Population (2006) 89,377 Electors (2011) 71,107 Area (km²) 34,160 Pop. density (per km²) 2.6 Census divisions Greater Sudbury, Sudbury District plus small portions of Timiskaming, Manitoulin, Nipissing and Parry Sound Census subdivisions Biscotasing, Cartier, French River, Gogama, Greater Sudbury, Killarney, Markstay-Warren, St. Charles, West Nipissing, Whitefish Lake Nickel Belt is one of two federal electoral districts serving the Greater City of Sudbury.
Nickel Belt has been represented in the Canadian House of Commons since 1953.
It consists of:
- the part of the Territorial District of Timiskaming lying west of the townships of Fallon and Cleaver;
- the Territorial District of Sudbury, excluding:
- the part lying west of and including the townships of Shenango, Lemoine, Carty, Pinogami, Biggs, Rollo, Swayze, Cunningham, Blamey, Shipley, Singapore, Burr and Edighoffer;
- the part lying south and west of a line and including the townships of Acheson, Venturi and Ermatinger and Totten, west of and excluding the City of Greater Sudbury, and west of and including the Township of Roosevelt;
- the northeast part of the City of Greater Sudbury;
- the Town of Killarney (in the territorial district of Manitoulin and Parry Sound);
- the unorganized territory lying on the north shore of Georgian Bay and east of the town of Killarney in the Territorial District of Manitoulin; and
- the Town of West Nipissing (in the Territorial District of Nipissing).
Contents
History
The riding of Nickel Belt was created in 1952 from parts of Algoma East, Algoma—Manitoulin, Nipissing, Parry Sound—Muskoka, Sudbury and Timiskaming—Cochrane ridings. It has traditionally included much of the Sudbury District and small parts of the Algoma, Nipissing and Timiskaming Districts, along with all but the urban core of Greater Sudbury.
It consisted initially of parts of the territorial districts of Sudbury and Algoma, and excluding the city of Sudbury, town of Copper Cliff, and the township of McKim. In 1966, it was redefined to consist of parts of the territorial districts of Sudbury excluding the City of Sudbury and the Town of Copper Cliff, and the northeast part of the territorial district of Manitoulin.
In 1976, it was redefined to consist of the southern part of Regional Municipality of Sudbury, the southeast part of the Territorial District of Sudbury, and the part of the Territorial District of Manitoulin including and lying east of the Townships of Killarney, and Rutherford and George Island.
In 1987, it was redefined to consist of the southern part of the Regional Municipality of Sudbury; the geographic townships of Cartier, Cascaden, Foy, Hart, Harty, Hess and Moncrieff and that part of the geographic Township of Trill not within the Town of Walden in the Territorial District of Sudbury; Wahnapitei Indian Reserve No. 11; and Whitefish Lake Indian Reserve No. 6.
In 1996, it was redefined to consist of:
- the part of the Territorial District of Timiskaming lying west of the eastern limit of the geographic townships of Douglas and Geikie;
- the Territorial District of Sudbury excluding:
- the part lying west of the eastern boundary of the townships of Shenango, Lemoine, Carty, Pinogami, Biggs, Rollo, Swayze, Cunningham, Blamey, Shipley, Singapore, Burr and Edighoffer;
- the part lying south and west of and including the townships of Acheson, Venturi, Ermatinger, Totten and west of but excluding the Regional Municipality of Sudbury, and west of but including the Townships of Foster and Curtin.
- the part lying east of a line and including the Townships of Stull, Valin, Cotton, Beresford and Creelman, east of and excluding the Regional Municipality of Sudbury and the Township of Hawley, east of and excluding the Townships of Hendrie and Hoskin, east of and excluding the Townships of Cosby, Mason and Martland;
- the part of Regional Municipality of Sudbury south of a line drawn from east to west along Highway 69, south along Long Lake Road, and west along the north boundary of the Township of Broder.
In 2003, it was given its current boundaries as described above.
Members of Parliament
This riding has elected the following Members of Parliament:
Parliament Years Member Party Algoma East, Algoma—Manitoulin, Nipissing,
Parry Sound—Muskoka, Sudbury and Timiskaming—Cochrane prior to 195222nd 1953–1957 Léoda Gauthier Liberal 23rd 1957–1958 24th 1958–1962 Osias Godin Liberal 25th 1962–1963 26th 1963–1965 27th 1965–1968 Norman Fawcett New Democratic 28th 1968–1972 Gaetan Serré Liberal 29th 1972–1974 John Rodriguez New Democratic 30th 1974–1979 31st 1979–1980 32nd 1980–1984 Judy Erola Liberal 33rd 1984–1988 John Rodriguez New Democratic 34th 1988–1993 35th 1993–1997 Raymond Bonin Liberal 36th 1997–2000 37th 2000–2004 38th 2004–2006 39th 2006–2008 40th 2008–2011 Claude Gravelle New Democratic 41st 2011–present Election results
Canadian federal election, 2011 Party Candidate Votes % ±% Expenditures New Democrat Claude Gravelle 24,566 54.97 +8.43 - Conservative Lynne Reynolds 12,503 27.98 +6.28 - Liberal Joe Cormier 6,382 14.28 -12.02 - Green Christine Guillot 1,252 2.80 -2.23 - Marxist–Leninist Steve Rutchinski 59 0.13 -0.03 Total valid votes/Expense limit 44,688 100.00 - Total rejected ballots 171 0.38 -0.09 Turnout 44,859 62.60 Eligible voters 71,659 Canadian federal election, 2008 Party Candidate Votes % ±% Expenditures New Democrat Claude Gravelle 19,021 46.54 +7.94 $63,497 Liberal Louise Portelance 10,748 26.30 -16.90 $61,589 Conservative Ian McCracken 8,869 21.70 +9.00 Green Fred Twilley 2,056 5.03 +2.93 $2,065 Independent Yves Villeneuve 112 0.27 Marxist–Leninist Steve Rutchinski 66 0.16 +0.06 Total valid votes/Expense limit 40,872 100.00 $94,270 Total rejected ballots 193 0.47 Turnout 41,065 New Democratic Party gain from Liberal Swing +12.42 Canadian federal election, 2006 Party Candidate Votes % ±% Expenditures Liberal Ray Bonin 19,775 43.20 +0.79 $64,036 New Democrat Claude Gravelle 17,668 38.60 +4.10 $75,188 Conservative Margaret Schwartzentruber 5,822 12.70 -6.12 $10,196 Progressive Canadian Mathieu Péron 1,044 2.30 Green Mark McAllister 975 2.10 -0.44 Marijuana Michel D. Ethier 421 0.90 -0.16 Marxist–Leninist Steve Rutchinski 42 0.10 -0.03 $68 Total valid votes/Expense limit 45,747 100.00 $87,252 Canadian federal election, 2004 Party Candidate Votes % ±% Expenditures Liberal Ray Bonin 17,188 42.41 -13.16 $44,339 New Democrat Claude Gravelle 13,980 34.50 +13.34 $32,073 Conservative Mike Dupont 7,628 18.82 -4.45 $59,250 Green Steve Lafleur 1,031 2.54 Marijuana Michel D. Ethier 430 1.06 Independent Don Lavallee 217 0.54 $2,875 Marxist–Leninist Steve Rutchinski 51 0.13 $435 Total valid votes/Expense limit 40,525 100.00 $84,953 Note: Conservative vote is compared to the total of the Canadian Alliance vote and Progressive Conservative vote in 2000 election.
Canadian federal election, 2000 Party Candidate Votes % ±% Expenditures Liberal Ray Bonin 19,187 55.57 +6.72 $42,569 New Democrat Sandy Bass 7,304 21.16 -12.32 $61,722 Canadian Alliance Neil Martin 6,369 18.45 6.49 $13,072 Progressive Conservative Reg Couldridge 1,665 4.82 0.40 $2,739 Total valid votes/Expense limit 34,525 100.00 $68,755 Note: Canadian Alliance vote is compared to the Reform vote in 1997 election.
Canadian federal election, 1997 Party Candidate Votes % ±% Expenditures Liberal Ray Bonin 19,489 48.85 -8.34 $43,205 New Democrat Elie Martel 13,355 33.48 +10.37 $62,794 Reform Neil Martin 4,771 11.96 -0.74 $13,794 Progressive Conservative Reg Couldridge 1,763 4.42 -1.01 $5,596 Canadian Action Don Scott 369 0.92 $1,181 Natural Law Mitchell Hibbs 145 0.36 -0.03 Total valid votes/Expense limit 39,892 100.00 $65,400 1993 federal election : Nickel Belt edit Party Candidate Votes % +/- Expenditures Liberal Ray Bonin 25,237 57.19 +33.62 $42,807 New Democratic Party (x)John Rodriguez 10,197 23.11 -21.62 $52,551 Reform Janice Weitzel 5,604 12.70 $4,156 Progressive Conservative Ian Munro 2,395 5.43 -15.32 $4,808 National Brian Woods 346 0.78 $0 Natural Law Daniel Jolicoeur 173 0.39 $533 Non-Affiliated Ernie Ashick 122 0.27 $571 Abolitionist Cindy A. Burton 53 0.12 $0 Total valid votes 44,127 100.00 Total rejected ballots 329 Turnout 44,456 70.71 -5.47 Electors on the lists 62,869 Source: Thirty-fifth General Election, 1993: Official Voting Results, Published by the Chief Electoral Officer of Canada. Financial figures taken from official contributions and expenses provided by Elections Canada.
1988 federal election : Nickel Belt edit Party Candidate Votes % +/- Expenditures New Democratic Party (x)John Rodriguez 17,418 44.73 +6.13 $39,240 Liberal Pierre Legros 9,178 23.57 -5.98 $36,271 Progressive Conservative Richard Berthiaume 8,080 20.75 -10.45 $35,830 Confederation of Regions Billie Christiansen 4,066 10.44 $9,695 Rhinoceros Keith J. Claven 202 0.52 -0.13 $330 Total valid votes 38,944 100.00 Total rejected ballots 147 Turnout 39,091 76.18 Electors on the lists 51,312 Note: Percentage change numbers are not factored for redistribution.
1984 federal election : Nickel Belt edit Party Candidate Votes % +/- New Democratic Party John Rodriguez 17,141 38.60 -3.46 Progressive Conservative Gord Slade 13,857 31.20 +21.00 Liberal (x)Judy Erola 13,124 29.55 -17.97 Rhinoceros Derek Aardvark Orford 288 0.65 Total valid votes 44,410 100.00 Total rejected ballots 250 0.01 Turnout 44,660 79.55 +4.37 Electors on the lists 56,139 1980 federal election : Nickel Belt edit Party Candidate Votes % +/- Liberal Judy Erola 19,805 47.52 +8.97 New Democratic Party (x)John Rodriguez 17,529 42.06 -1.31 Progressive Conservative Dennis Tappenden 4,250 10.20 -7.63 Marxist-Leninist David Starbuck 89 0.21 -0.04 Total valid votes 41,673 100.00 Total rejected ballots 119 Turnout 41,792 75.18 -1.90 Electors on the lists 55,587 1979 federal election : Nickel Belt edit Party Candidate Votes % +/- New Democratic Party (x)John Rodriguez 17,772 43.37 -6.41 Liberal Judy Erola 15,799 38.55 +0.65 Progressive Conservative Harwood Nesbitt 7,308 17.83 +5.51 Marxist-Leninist David Starbuck 103 0.25 Total valid votes 40,982 100.00 Total rejected ballots 115 Turnout 41,097 77.08 -0.28 Electors on the lists 53,320 Note: Percentage change numbers are not factored for redistribution.
1974 federal election : Nickel Belt edit Party Candidate Votes % +/- New Democratic Party (x)John Rodriguez 17,668 49.78 +3.75 Liberal Gil Mayer 13,451 37.90 -1.79 Progressive Conservative Ralph Connor 4,371 12.32 -0.20 Total valid votes 35,490 100.00 Total rejected ballots 97 Turnout 35,587 77.36 -1.65 Electors on the lists 46,001 1972 federal election : Nickel Belt edit Party Candidate Votes % +/- New Democratic Party John Rodriguez 14,033 46.03 +8.46 Liberal (x)Gaetan Serré 12,101 39.69 -5.41 Progressive Conservative Bernie White 3,817 12.52 -4.81 Social Credit Donat Breault 534 1.75 Total valid votes 30,485 100.00 Total rejected ballots 4,718 Turnout 35,203 79.01 Electors on the lists 44,556 Note: The number of rejected ballots is not a misprint. Gaetan Serré initally called for these ballots to be reviewed, but withdrew his request on November 14, 1972 after viewing a sample. Source: "Review cancelled", Globe and Mail, 14 November 1972, 8. Source for results: Official Voting Results, Office of the Chief Electoral Officer (Canada), 1972.
Canadian federal election, 1968 Party Candidate Votes % ±% Liberal Gaetan Serré 11,551 45.10 +5.64 New Democrat Norman Fawcett 9,621 37.57 -3.75 Progressive Conservative Cecil Fielding 4,439 17.33 +19.23 Total valid votes 25,611 100.00 Canadian federal election, 1965 Party Candidate Votes % ±% New Democrat Norman Fawcett 10,863 41.32 +22.84 Liberal Osias Godin 10,374 39.46 -5.72 Progressive Conservative Roger Landry 5,055 19.23 -5.25 Total valid votes 26,292 100.00 Canadian federal election, 1963 Party Candidate Votes % ±% Liberal Osias Godin 13,414 45.18 -11.74 Progressive Conservative John MacLean 7,268 24.48 -4.54 New Democrat Carl Maitland Griffith 5,486 18.48 +7.80 Social Credit Oscar Degarie 3,524 11.87 +8.48 Total valid votes 29,692 100.00 Canadian federal election, 1962 Party Candidate Votes % ±% Liberal Osias Godin 16,440 56.92 +9.82 Progressive Conservative Don Gillis 8,381 29.02 -4.94 New Democrat Philippe Deaken 3,085 10.68 -8.26 Social Credit Oscar Degarie 978 3.39 Total valid votes 28,884 100.00 Note: NDP vote is compared to CCF vote in 1958 election.
Canadian federal election, 1958 Party Candidate Votes % ±% Liberal Osias Godin 11,866 47.10 +4.50 Progressive Conservative Anthony Falzetta 8,556 33.96 -2.22 Co-operative Commonwealth Harold Prescott 4,772 18.94 -2.29 Total valid votes 25,194 100.00 Canadian federal election, 1957 Party Candidate Votes % ±% Liberal Léoda Gauthier 8,819 42.60 -15.97 Progressive Conservative Anthony Falzetta 7,490 36.18 +15.30 Co-operative Commonwealth Harold A. Prescott 4,395 21.23 +5.23 Total valid votes 20,704 100.00 Canadian federal election, 1953 Party Candidate Votes % Liberal Léoda Gauthier 8,821 58.56 Progressive Conservative Alistair MacLean 3,144 20.87 Co-operative Commonwealth Gilles Lefebvre 2,410 16.00 Labour-Progressive Harold Arthur Proctor 687 4.56 Total valid votes 15,062 100.00 See also
- List of Canadian federal electoral districts
- Past Canadian electoral districts
Sources
- Campaign expense data from Elections Canada
- Riding history from the Library of Parliament
- 2011 results from Elections Canada
New Democratic Algoma—Manitoulin—Kapuskasing • Nickel Belt • Sudbury • Thunder Bay—Rainy River • Thunder Bay—Superior North • Timmins—James Bay
Conservative Categories:- Ontario federal electoral districts
- Sudbury District, Ontario
- Belt regions
- Politics of Greater Sudbury
- West Nipissing

Wikimedia Foundation. 2010.