- Table (information)
-
"Tabular" redirects here. For the typewriter key, see tab key.For sortable tables in Wikipedia, see Help:Sorting
 An example table rendered in a web browser using HTML.
A table is a means of arranging data in rows and columns.
Production (tons) % of goal North 40 87 102% South 40 93 110% The use of tables is pervasive throughout all communication, research and data analysis. Tables appear in print media, handwritten notes, computer software, architectural ornamentation, traffic signs and many other places. The precise conventions and terminology for describing tables varies depending on the context. Further, tables differ significantly in variety, structure, flexibility, notation, representation and use.[1][2][3][4][5] In books and technical articles, tables are typically presented apart from the main text in numbered and captioned floating blocks.
Contents
Basic description
A table consists of an ordered arrangement of rows and columns. This is a simplified description of the most basic kind of table. Certain considerations follow from this simplified description:
- the term row has several common synonyms (e.g., record, k-tuple, n-tuple, vector);
- the term column has several common synonyms (e.g., field, parameter, property, attribute);
- a column is usually identified by a name;
- a column name can consist of a word, phrase or a numerical index;
- the intersection of a row and a column is a cell.
The elements of a table may be grouped, segmented, or arranged in many different ways, and even nested recursively. Additionally, a table may include metadata, annotations, header,[6] footer or other ancillary features.[5]
Simple table
The following illustrates a simple table with three columns and six rows. The first row is not counted, because it is only used to display the column names. This is traditionally called a "header row".
Age table First name Last name Age Shiva Naidu 24 Naresh Koyyada 25 Goutham Pulipati 22 Upendar sriram 22 Sharath Dont Know 22 Sai Pembarthi 22 Multi-dimensional table
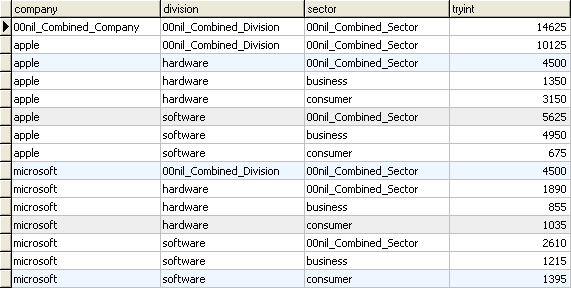
 An example of a table containing rows with summary information. The summary information consists of subtotals that are combined from previous rows within the same column.
The concept of dimension is also a part of basic terminology.[7] Any "simple" table can be represented as a "multi-dimensional" table by normalizing the data values into ordered hierarchies. A common example of such a table is a multiplication table.
Multiplication table × 1 2 3 1 1 2 3 2 2 4 6 3 3 6 9 NOTE: Multidimensional tables, 2-dimensional as in the example, are created under the condition the coordinates or combination of the basic headers (margins) give a unique value attached. This is an injective relation: each combination of the values of the headers row (row 0, for lack of a better term) and the headers column (column O for lack of a better term) is related to a unique value represented on the table:
- column 1 and row 1 will only correspond to the value 1 (and no other)
- column 1 and row 2 will only correspond to the value 2 (and no other), etc.
If the said condition is not present, it is required to insert extra columns or rows which increases the size of table with plenty of empty cells.
To illustrate how a simple table can be transformed into a multi-dimensional table, consider the following transformation of the Age table.
Modified Age Table (names only) + 1 2 3 Nancy Nancy Davolio Nancy Klondike Nancy Obesanjo Justin Justin Saunders Justin Timberland Justin Daviolio This is structurally identical to the multiplication table, except it uses concatenation instead of multiplication as the operator; and first name and last name instead of integers as the operands.
Wide and Narrow Tables
Tables can be described as wide or narrow in format. Wide format has a separate column for each data variable, a Narrow format will have one column for all the variable values and another column for the context of that value. See Wide and Narrow Data.
Generic representation
As a communication tool, a table allows a form of generalization of information from an unlimited number of different social or scientific contexts. It provides a familiar way to convey information that might otherwise not be obvious or readily understood.
For example, in the following diagram, two alternate representations of the same information are presented side by side. On the left is the NFPA 704 standard "fire diamond" with example values indicated and on the right is a simple table displaying the same values, along with additional information. Both representations convey essentially the same information, but the tabular representation is arguably more comprehensible to someone who is not familiar with the NFPA 704 standard. The tabular representation may not, however, be ideal for every circumstance (for example because of space limitations, or safety reasons).
Fire diamond Standard Representation Tabular Representation Risk levels of hazardous materials in this facility Health Risk Flammability Reactivity Special Level 3 Level 2 Level 1 Specific uses
There are several specific situations in which tables are routinely used as a matter of custom or formal convention.
Publishing
- Cross-reference (Table of contents)
Mathematics
- Arithmetic Multiplication table
- Logic Truth table
Natural sciences
- Chemistry (Periodic table)
- Oceanography (tide table)
Information technology
Tables are both supported by software applications and used in software development.
Software applications
Modern software applications give users the ability to generate, format, and edit tables and tabular data for a wide variety of uses, for example:
- word processing applications;
- spreadsheet applications;
- presentation software;
- tables specified in HTML or another markup language
Software development
Tables have uses in software development for both high-level specification and low-level implementation. Usage in software specification can encompass ad hoc inclusion of simple decision tables in textual documents through to the use of tabular specification methodologies, examples of which include SCR[8] and Statestep.[9] Proponents of tabular techniques, among whom David Parnas is prominent, emphasize their understandability, as well as the quality and cost advantages of a format allowing systematic inspection,[10] while corresponding shortcomings experienced with a graphical notation were cited in motivating the development of at least two tabular approaches.[9][11]
At a programming level, software may be implemented using constructs generally represented or understood as tabular, whether to store data (perhaps to memoize earlier results), for example, in arrays or hash tables, or control tables determining the flow of program execution in response to various events or inputs.
Historical relationship to furniture
In medieval counting houses, the tables were covered with a piece of checkered cloth, to count money. Exchequer is an archaic term for the English institution which accounted for money owed to the monarch. Thus the checkerboard tables of stacks of coins are a concrete realization of this information.
Notes and references
- ^ Fink, Arlene (2005). How to Conduct Surveys. Thousand Oaks: Sage Publications. ISBN 141291423X.
- ^ McNabb, David (2002). Research Methods in Public Administration and Nonprofit Management. Armonk: M.E. Sharpe. ISBN 0765609576.
- ^ Morgan, George (2004). Spss for Introductory Statistics. Hillsdale: Lawrence Erlbaum. ISBN 0805847898.
- ^ Robey, David (2000). Sound and Structure in the Divine Comedy. Oxford Oxfordshire: Oxford University Press. ISBN 0198184980.
- ^ a b Zielinski, Krzysztof (2006). Software Engineering: Evolution and Emerging Technologies. Amsterdam: IOS Press. ISBN 1586035592.
- ^ see e.g., Page header or Header (information technology)
- ^ The concept of "dimension" is often applied to tables in different contexts and with different meanings. For example, what is described as a "Simple Table" in this article is alternatively described as a "two dimensional array". This is distinct from "multi-dimensional table" as presented in this article.
- ^ Heitmeyer, Constance L. (2002). Software Cost Reduction. Washington D.C.: Naval Research Laboratory. http://oai.dtic.mil/oai/oai?verb=getRecord&metadataPrefix=html&identifier=ADA465161
- ^ a b Breen, Michael (2005). "Experience of using a lightweight formal specification method for a commercial embedded system product line". Requirements Engineering Journal 10 (2): 161–172. doi:10.1007/s00766-004-0209-1. http://mbreen.com/experience.pdf
- ^ Janicki, Ryszard; Parnas, David Lorge; Zucker, Jeffery (1997). "Tabular representations in relational documents". In Brink, C.; Kahl, W.; Schmidt, G.. Relational Methods in Computer Science. Springer Verlag. ISBN 3-211-82971-7
- ^ Leveson, Nancy G.; Heimdahl, Mats P. E.; Reese, Jon Damon (1999). "Designing Specification Languages for Process-Control Systems: Lessons Learned and Steps to the Future". Seventh ACM SIGSOFT Symposium on the Foundations on Software Engineering. doi:10.1145/318773.318937. http://www.umsec.umn.edu/sites/all/files/publications/draft4.pdf
See also
- Abstract data type
- Column (database)
- Information graphics
- Periodic table
- Reference table
- Row (database)
- Table (database)
- Table (HTML)
- Tensor
- Dependent variable
- Independent variable
[[zh:表格]67]
Categories:- Infographics
- Data modeling


Wikimedia Foundation. 2010.