- Northern Ireland Assembly election, 1998
-
Northern Ireland Assembly election, 1998 
1996 ←
members25 June 1998 → 2003
membersAll 108 seats to the Northern Ireland Assembly
55 seats needed for a majorityFirst party Second party Third party 


Leader David Trimble John Hume Ian Paisley Party Ulster Unionist SDLP Democratic Unionist Leader since 8 September 1995 28 November 1979 30 September 1971 Leader's seat Upper Bann Foyle North Antrim Last election 30 seats (24.2%) 21 seats (21.4%) 24 seats (18.8%) Seats won 28 24 20 Seat change  2
2 3 4
3 4Popular vote 172,225 177,963 145,917 Percentage 21.3% 22.0% 18.5% Swing 2.9% 0.6% 0.3%Fourth party Fifth party Sixth party 


Leader Gerry Adams John Alderdice Robert McCartney Party Sinn Féin Alliance UK Unionist Leader since 13 November 1983 3 October 1987 1995 Leader's seat Belfast West Belfast East North Down Last election 17 seats (15.5%) 7 seats (6.5%) 3 seats (3.7%) Seats won 18 6 5 Seat change 1 1 2Popular vote 142,858 52,636 36,541 Percentage 16.7% 5.6% 4.5% Swing 1.2% 0.9% 0.8%
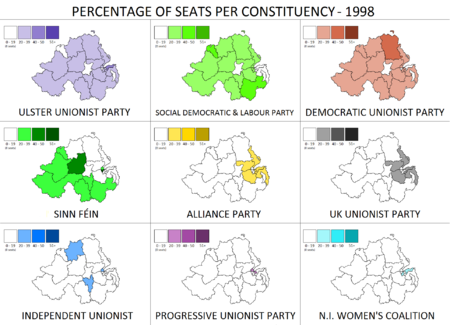
Percentage of seats gained by each of the party.
First Minister before election
New position
Elected First Minister
The first elections to the Northern Ireland Assembly were held on 25 June 1998. Six members were elected by Single Transferable Vote from each of Northern Ireland's eighteen Westminster Parliamentary constituencies, giving a total of 108 MLAs, or Members of the Legislative Assembly.
Northern Ireland 
This article is part of the series:
Politics and government of
Northern IrelandNI in the UKNI in the EU
Contents
Results
The result was (first preference votes only):

Party Leader Seats % of
seatsVotes % of
voteRank Ulster Unionist David Trimble 28 25.9% 172,225 21.28% 2 SDLP John Hume 24 22.2% 177,963 21.99% 1 Democratic Unionist Ian Paisley 20 18.5% 145,917 18.03% 3 Sinn Féin Gerry Adams 18 16.7% 142,858 17.65% 4 Alliance John Alderdice 6 5.6% 52,636 6.50% 5 UK Unionist Robert McCartney 5 4.6% 36,541 4.52% 6 Independent Unionist 3 2.8% 24,339 3.00% 7 Progressive Unionist Hugh Smyth 2 1.9% 20,634 2.55% 8 NI Women's Coalition Monica McWilliams 2 1.9% 13,019 1.61% 9 Ulster Democratic Gary McMichael 0 8,651 1.07% 10 Independent 0 5,392 0.69% * Labour Party NI Malachi Curran 0 2,729 0.34% 11 Workers' Party Tom French 0 1,989 0.25% 12 Conservative William Hague 0 1,835 0.23% 13 Ulster Independence Hugh Ross 0 1,227 0.15% 17 Natural Law James Anderson 0 832 0.10% 18 Socialist Party Joe Higgins 0 789 0.10% 19 Green (NI) 0 710 0.09% 20 Total 108 100.0% 786,132 100.0% All parties with over 500 votes listed. Electorate: 1,178,556; Turnout: 823,565 (69.88%); Spoiled votes: 13,248; Valid: 810,317.
- ¹ Independent candidates were ranked 14, 15 and 16; other independents won fewer than 500 votes.
Votes summary
Seats summary
Details
Although the SDLP won the most first preference votes, the Ulster Unionists won the most seats in the Assembly. This has been attributed[citation needed] to several reasons, including:
- Slightly different turnouts across the province, with the result that in the more staunchly unionist east fewer votes were required to elect an MLA than in the SDLP's heartlands in the west.
- The Ulster Unionists proved better at "vote balancing" whereby in the rounds of transfers their candidates were less likely to be eliminated earlier on.
- The Ulster Unionists proved better at attracting transfers from other parties (and due to the vote balancing mentioned above, were more likely to be in a position to benefit from this)
See also
Elections and referendums in Northern Ireland Elections Local government elections 1973 · 1977 · 1981 · 1985 · 1989 · 1993 · 1997 · 2001 · 2005 · 2011Referendums Categories:- 1998 elections in the United Kingdom
- Elections in Northern Ireland
- 1998 in Northern Ireland
- Northern Ireland Assembly


Wikimedia Foundation. 2010.