- Ohio's 5th congressional district
-
"OH-5" redirects here. OH-5 may also refer to Ohio State Route 5 or the skull OH 5.
Ohio's 5th congressional district 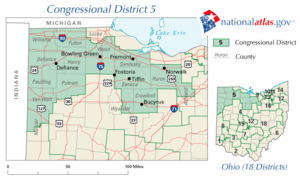
Current Representative Bob Latta (R–Bowling Green) Distribution 48.81% urban, 51.19% rural Population (2000) 630,730 Median income $41,701 Ethnicity 95.5% White, 1.1% Black, 0.5% Asian, 3.8% Hispanic, 0.2% Native American, 0.1% other Cook PVI R+9 Ohio's 5th congressional district is in northwestern and north central Ohio and borders Michigan and Indiana. The district is currently represented by Republican Bob Latta. Currently, all of Crawford, Defiance, Fulton, Henry, Huron, Paulding, Putnam, Sandusky, Seneca, Van Wert, Williams, and Wood Counties are included in this district. Portions of Ashland, Lucas, Mercer, and Wyandot Counties are also a part of the 5th District.
Contents
List of Largest Municipalities
All or part of twenty-one cities (whose population is greater than 5,000) are in the district.
The largest municipalities[1] represented in this district include:
- Bowling Green, population 29,636
- Tiffin, population 18,135
- Fremont, population 17,375
- Perrysburg, population 16,945
- Defiance, population 16,465
- Norwalk, population 16,238
- Fostoria(*), population 13,931
- Bucyrus, population 13,224
- Galion(*), population 11,341
- Van Wert, population 10,690
- Napoleon, population 9,318
- Bryan, population 8,333
- Bellevue(*), population 8,193
- Wauseon, population 7,091
- Willard, population 6,806
- Upper Sandusky(*), population 6,533
- Rossford, population 6,406
- Clyde, population 6,064
- Northwood, population 5,471
- Crestline(*), population 5,088
(*) Denotes that areas of the city are located in another Congressional District.
List of representatives
Representative Party Years Congress Electoral history District created March 4, 1813  James Kilbourne
Democratic-
RepublicanMarch 4, 1813 –
March 3, 181713
14First elected in 1812
[Data unknown/missing. You can help!] Philemon Beecher
Democratic-
RepublicanMarch 4, 1817 –
March 3, 182115
16First elected in 1816
Lost re-election Joseph Vance
Democratic-
RepublicanMarch 4, 1821 –
March 3, 182317 Elected in 1820
Redistricted to the 4th district John Wilson Campbell
Jacksonian
RepublicanMarch 4, 1823 –
March 3, 182518 Redistricted from the 2nd district
[Data unknown/missing. You can help!]Adams March 4, 1825 –
March 3, 182719 William RussellJacksonian March 4, 1827 –
March 3, 183320
21
22First elected in 1826
[Data unknown/missing. You can help!] Thomas L. Hamer
Jacksonian March 4, 1833 –
March 3, 183723
24First elected in 1832
[Data unknown/missing. You can help!]Democratic March 4, 1837 –
March 3, 183925 William DoanDemocratic March 4, 1839 –
March 3, 184326
27First elected in 1838
[Data unknown/missing. You can help!]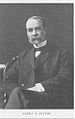 Emery D. Potter
Democratic March 4, 1843 –
March 3, 184528 Elected in 1842
[Data unknown/missing. You can help!] William SawyerDemocratic March 4, 1845 –
March 3, 184929
30First elected in 1844
[Data unknown/missing. You can help!] Emery D. PotterDemocratic March 4, 1849 –
March 3, 185131 Elected in 1848
[Data unknown/missing. You can help!]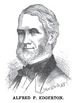 Alfred Edgerton
Democratic March 4, 1851 –
March 3, 185532
33First elected in 1850
[Data unknown/missing. You can help!]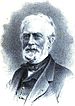 Richard Mott
Opposition March 4, 1855 –
March 3, 185734 First elected in 1854
[Data unknown/missing. You can help!]Republican March 4, 1857 –
March 3, 185935 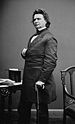 James Mitchell Ashley
Republican March 4, 1859 –
March 3, 186336
37First elected in 1858
Redistricted to the 10th district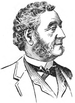 Francis Celeste Le Blond
Democratic March 4, 1863 –
March 3, 186738
39First elected in 1862
[Data unknown/missing. You can help!] William Mungen
Democratic March 4, 1867 –
March 3, 187140
41First elected in 1866
[Data unknown/missing. You can help!] Charles Nelson Lamison
Democratic March 4, 1871 –
March 3, 187542
43First elected in 1870
[Data unknown/missing. You can help!]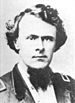 Americus Vespucius Rice
Democratic March 4, 1875 –
March 3, 187944
45First elected in 1874
[Data unknown/missing. You can help!]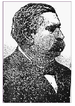 Benjamin Le Fevre
Democratic March 4, 1879 –
March 4, 188346
47Redistricted to the 4th district 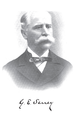 George E. Seney
Democratic March 4, 1883 –
March 3, 188548 Redistricted to the 7th district Benjamin Le FevreDemocratic March 4, 1885 –
March 3, 188749 Redistricted from the 4th district  George E. Seney
Democratic March 4, 1887 –
March 3, 189150
51Redistricted from the 7th district  Fernando C. Layton
Democratic March 4, 1891 –
March 3, 189352 Redistricted to the 4th district  Dennis D. Donovan
Democratic March 4, 1893 –
March 3, 189553 Redistricted from the 6th district Francis B. De WittRepublican March 4, 1895 –
March 3, 189754 Elected in 1894
[Data unknown/missing. You can help!]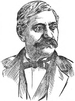 David Meekison
Democratic March 4, 1897 –
March 3, 190155
56First elected in 1896
[Data unknown/missing. You can help!] John S. Snook
Democratic March 4, 1901 –
March 3, 190557
58First elected in 1900
Retired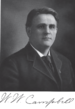 William W. Campbell
Republican March 4, 1905 –
March 3, 190759 Elected in 1904
[Data unknown/missing. You can help!] Timothy T. Ansberry
Democratic March 4, 1907 –
January 9, 191560
61
62
63First elected in 1906
Resigned when appointed to the Ohio Court of AppealsVacant January 9, 1915 –
March 4, 191563 Nelson E. MatthewsRepublican March 4, 1915 –
March 3, 191764 Elected in 1914
[Data unknown/missing. You can help!] John S. SnookDemocratic March 4, 1917 –
March 3, 191965 Elected in 1916
Retired Charles J. Thompson
Republican March 4, 1919 –
March 3, 193166
67
68
69
70
71First elected in 1918
[Data unknown/missing. You can help!] Frank C. KniffinDemocratic March 4, 1931 –
January 3, 193972
73
74
75First elected in 1900
Lost re-election Cliff ClevengerRepublican January 3, 1939 –
January 3, 195976
77
78
79
80
81
82
83
84
85First elected in 1938
Retired Del LattaRepublican January 3, 1959 –
January 3, 198986
87
88
89
91
92
93
94
95
96
97
98
99
100First elected in 1958
Retired Paul Gillmor
Republican January 3, 1989 –
September 5, 2007101
102
103
104
105
106
107
108
109
110First elected in 1988
DiedVacant September 5, 2007 –
December 11, 2007110  Bob Latta
Republican December 11, 2007 –
Present110
111
112First elected in a 2007 special election Election results
The following chart shows historic election results. Bold type indicates victor. Italic type indicates incumbent.
Year Democratic Republican Other 1812 District created following the 1810 Census. … 1920 Newt Bronson: 25,395 Charles J. Thompson: 40,381 1922 Frank C. Kniffin: 28,067 Charles J. Thompson: 31,700 1924 Frank C. Kniffin: 29,245 Charles J. Thompson: 31,045 1926 Frank C. Kniffin: 23,022 Charles J. Thompson: 23,638 1928 Frank C. Kniffin: 31,385 Charles J. Thompson: 36,096 1930 Frank C. Kniffin: 29,117 Charles J. Thompson: 27,497 1932 Frank C. Kniffin: 44,433 William L. Manahan: 29,605 1934 Frank C. Kniffin: 34,249 Davis B. Johnson: 27,423 1936 Frank C. Kniffin: 41,693 Stephan S. Beard: 33,212 Fred L. Hay: 3,663 1938 Frank C. Kniffin: 28,109 Cliff Clevenger: 37,027 1940 C. H. Armbruster: 31,063 Cliff Clevenger: 48,040 1942 Ferdinand E. Warren: 17,514 Cliff Clevenger: 30,667 1944 T. Walter Williams: 22,740 Cliff Clevenger: 48,490 1946 Willard Thomas: 20,163 Cliff Clevenger: 30,623 1948 Dan Batt: 32,076 Cliff Clevenger: 34,950 1950 Dan Batt: 26,689 Cliff Clevenger: 36,096 1952 Dan Batt: 42,104 Cliff Clevenger: 72,168 1954 Martin W. Feigert: 33,483 Cliff Clevenger: 49,265 1956 George E. Rafferty: 42,181 Cliff Clevenger: 69,774 1958 George E. Rafferty: 44,971 Delbert L. Latta: 52,612 1960 Tom T. McRitchie: 41,375 Delbert L. Latta: 85,175 1962 William T. Hunt: 29,114 Delbert L. Latta: 69,272 1964 Milford Landis: 41,621 Delbert L. Latta: 80,394 1966 John H. Shock: 26,503 Delbert L. Latta: 80,906 1968 Louis Richard Batzler: 45,884 Delbert L. Latta: 113,381 1970 Carl G. Sherer: 37,545 Delbert L. Latta: 92,577 1972 Bruce Edwards: 49,465 Delbert L. Latta: 132,032 1974 Bruce Edwards: 53,391 Delbert L. Latta: 89,161 1976 Bruce Edwards: 60,304 Delbert L. Latta: 124,910 1978 James R. Sherck: 51,071 Delbert L. Latta: 85,547 1980 James R. Sherck: 57,704 Delbert L. Latta: 137,003 1982 James R. Sherck: 70,120 Delbert L. Latta: 86,450 1984 James R. Sherck: 78,809 Delbert L. Latta: 132,582 1986 Tom Murray: 54,864 Delbert L. Latta: 102,016 1988 Tom Murray: 80,472 Paul E. Gillmor: 128,838 1990 P. Scott Mange: 41,693 Paul E. Gillmor: 113,615 John E. Jackson: 10,612 1992 Paul E. Gillmor: 187,860 1994 Jarrod Tudor: 49,335 Paul E. Gillmor: 135,879 1996 Annie Saunders: 81,170 Paul E. Gillmor: 145,892 David J. Schaffer (N): 11,461 1998 Susan Davenport Darrow: 61,926 Paul E. Gillmor: 123,979 2000 Dannie Edmon: 62,138 Paul E. Gillmor: 169,857 John F. Green (L): 5,464
David J. Schaffer (N): 5,8812002 Roger Anderson: 51,872 Paul E. Gillmor: 126,286 John F. Green: 10,096 2004 Robin Weirauch: 95,481 Paul E. Gillmor: 194,559 2006 Robin Weirauch: 95,955 Paul E. Gillmor : 126,898 2007* Robin Weirauch: 32,246 Robert E. Latta: 41,740 2008 George Mays: 105,840 Robert E. Latta: 188,905 [2] See also
References
- ^ U.S. Census Bureau, Census 2000.
- ^ Federal Elections 2008. Federal Elections Commission, Washington DC, July 2009
- Martis, Kenneth C. (1989). The Historical Atlas of Political Parties in the United States Congress. New York: Macmillan Publishing Company.
- Martis, Kenneth C. (1982). The Historical Atlas of United States Congressional Districts. New York: Macmillan Publishing Company.
- Congressional Biographical Directory of the United States 1774–present
Ohio's congressional districts All districts: Territory At-large 1 2 3 4 5 6 7 8 9 10 11 12 13 14 15 16 17 18 19 20 21 22 23 24
The At-large, 19th – 24th districts are obsolete.
See also: Ohio's past & present Representatives, Senators, and Delegations, 2010 elections, 2012 elections
All U.S. districts – Apportionment – Redistricting – Gerrymandering – MapsCategories:- Congressional districts of Ohio


Wikimedia Foundation. 2010.