- R (programming language)
-
R 
Paradigm(s) multi-paradigm: object-oriented, imperative, functional, procedural, reflective Appeared in 1993[1] Designed by Ross Ihaka and Robert Gentleman Developer R Development Core Team Stable release 2.14.0 (October 31, 2011) Preview release Through Subversion Typing discipline Dynamic Influenced by S, Scheme OS Cross-platform License GNU General Public License Website www.r-project.org  R Programming at Wikibooks
R is a programming language and software environment for statistical computing and graphics. The R language is widely used among statisticians for developing statistical software,[2][3] and R is widely used for statistical software development and data analysis.[3]
R is an implementation of the S programming language combined with lexical scoping semantics inspired by Scheme. S was created by John Chambers while at Bell Labs. R was created by Ross Ihaka and Robert Gentleman[4] at the University of Auckland, New Zealand, and now, R is developed by the R Development Core Team, of which Chambers is a member. R is named partly after the first names of the first two R authors (Robert Gentleman and Ross Ihaka), and partly as a play on the name of S.[5]
R is part of the GNU project.[6][7] Its source code is freely available under the GNU General Public License, and pre-compiled binary versions are provided for various operating systems. R uses a command line interface; however, several graphical user interfaces are available for use with R.
Contents
Statistical features
R provides a wide variety of statistical and graphical techniques, including linear and nonlinear modeling, classical statistical tests, time-series analysis, classification, clustering, and others. R is easily extensible through functions and extensions, and the R community is noted for its active contributions in terms of packages. There are some important differences, but much code written for S runs unaltered. Many of R's standard functions are written in R itself, which makes it easy for users to follow the algorithmic choices made. For computationally intensive tasks, C, C++, and Fortran code can be linked and called at run time. Advanced users can write C or Java[8] code to manipulate R objects directly.
R is highly extensible through the use of user-submitted packages for specific functions or specific areas of study. Due to its S heritage, R has stronger object-oriented programming facilities than most statistical computing languages. Extending R is also eased by its permissive lexical scoping rules.[9]
According to Rexer's Annual Data Miner Survey in 2010, R has become the data mining tool used by more data miners (43%) than any other.[10]
Another strength of R is static graphics, which can produce publication-quality graphs, including mathematical symbols. Dynamic and interactive graphics are available through additional packages such as RGL.[11]
R has its own LaTeX-like documentation format, which is used to supply comprehensive documentation, both on-line in a number of formats and in hard copy.
Programming features
R is an interpreted language typically used through a command line interpreter. If one types "2+2" at the command prompt and presses enter, the computer replies with "4".
> 2+2
[1] 4
Like many other languages, R supports matrix arithmetic. R's data structures include scalars, vectors, matrices, data frames (similar to tables in a relational database) and lists.[12] The R object system has been extended by package authors to define objects for regression models, time-series and geo-spatial coordinates.
R supports procedural programming with functions and, for some functions, object-oriented programming with generic functions. A generic function acts differently depending on the type of arguments it is passed. In other words the generic function dispatches the function (method) specific to that type of object. For example, R has a generic print() function that can print almost every type of object in R with a simple "print(objectname)" syntax.
Although R is mostly used by statisticians and other practitioners requiring an environment for statistical computation and software development, it can also be used as a general matrix calculation toolbox with performance benchmarks comparable to GNU Octave or MATLAB.[13]
Examples
Example 1
The following examples illustrate the basic syntax of the language and use of the command-line interface.
In R and S, the assignment operator is an arrow made from two characters "<-".
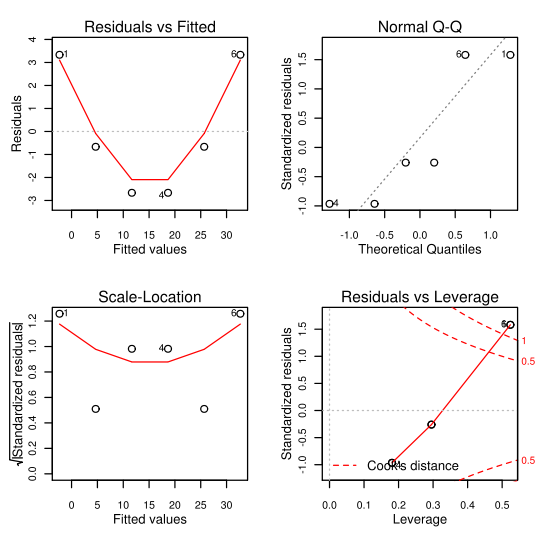
> x <- c(1,2,3,4,5,6)   # Create ordered collection (vector)
> y <- x^2              # Square the elements of x
> print(y)              # print (vector) y
[1]  1  4  9 16 25 36
> mean(y)               # Calculate average (arithmetic mean) of (vector) y; result is scalar
[1] 15.16667
> var(y)                # Calculate sample variance
[1] 178.9667
> lm_1 <- lm(y ~ x)     # Fit a linear regression model "y = f(x)" or "y = B0 + (B1 * x)"
                        # store the results as lm_1
> print(lm_1)           # Print the model from the (linear model object) lm_1

Call:
lm(formula = y ~ x)

Coefficients:
(Intercept)            x
     -9.333        7.000

> summary(lm_1)         # Compute and print statistics for the fit of the (linear model object) lm_1

Call:
lm(formula = y ~ x)

Residuals:
1       2       3       4       5       6
3.3333 -0.6667 -2.6667 -2.6667 -0.6667  3.3333

Coefficients:
Estimate Std. Error t value Pr(>|t|)
(Intercept)  -9.3333     2.8441  -3.282 0.030453 *
x             7.0000     0.7303   9.585 0.000662 ***
---
Signif. codes:  0 ‘***’ 0.001 ‘**’ 0.01 ‘*’ 0.05 ‘.’ 0.1 ‘ ’ 1

Residual standard error: 3.055 on 4 degrees of freedom
Multiple R-squared: 0.9583,  Adjusted R-squared: 0.9478
F-statistic: 91.88 on 1 and 4 DF,  p-value: 0.000662

> par(mfrow=c(2, 2))    # Request 2x2 plot layout
> plot(lm_1)       # Diagnostic plot of regression model
Example 2
Short R code calculating Mandelbrot set through the first 20 iterations of equation z = z² + c plotted for different complex constants c. This example demonstrates:
- use of community developed external libraries (called packages), in this case caTools package
- handling of complex numbers
- multidimensional arrays of numbers used as basic data type, see variables C, Z and X
library(caTools)         # external package providing write.gif function
jet.colors <- colorRampPalette(c("#00007F", "blue", "#007FFF", "cyan", "#7FFF7F",
                                 "yellow", "#FF7F00", "red", "#7F0000"))
m <- 1200                # define size
C <- complex( real=rep(seq(-1.8,0.6, length.out=m), each=m ),
              imag=rep(seq(-1.2,1.2, length.out=m), m ) )
C <- matrix(C,m,m)       # reshape as square matrix of complex numbers
Z <- 0                   # initialize Z to zero
X <- array(0, c(m,m,20)) # initialize output 3D array
for (k in 1:20) {        # loop with 20 iterations
  Z <- Z^2+C             # the central difference equation
  X[,,k] <- exp(-abs(Z)) # capture results
}
write.gif(X, "Mandelbrot.gif", col=jet.colors, delay=100)

Packages
The capabilities of R are extended through user-created packages, which allow specialized statistical techniques, graphical devices, import/export capabilities, reporting tools, etc. These packages are developed primarily in R, and sometimes in Java, C and Fortran. A core set of packages are included with the installation of R, with more than 4300 (as of March 2011[update]) available at the Comprehensive R Archive Network (CRAN), Bioconductor, and other repositories. [14]
The "Task Views" page (subject list) on the CRAN website lists the wide range of applications (Finance, Genetics, Machine Learning, Medical Imaging, Social Sciences and Spatial statistics) to which R has been applied and for which packages are available.
Other R package resources include Crantastic, a community site for rating and reviewing all CRAN packages, and also R-Forge, a central platform for the collaborative development of R packages, R-related software, and projects. It hosts many unpublished, beta packages, and development versions of CRAN packages.
The Bioconductor project provides R packages for the analysis of genomic data, such as Affymetrix and cDNA microarray object-oriented data handling and analysis tools, and has started to provide tools for analysis of data from next-generation high-throughput sequencing methods.
Reproducible research and automated report generation can be accomplished with packages such as Sweave and odfWeave that support execution of R code embedded within LaTeX, OpenDocument format and other markups[15].
Milestones
The full list of changes is maintained in the NEWS file. Some highlights are listed below.
- Version 0.16 – This is the last alpha version developed primarily by Ihaka and Gentleman. Much of the basic functionality from the "White Book" (see S history) was implemented. The mailing lists commenced on April 1, 1997.
- Version 0.49 – April 23, 1997 – This is the oldest available source release, and compiles on a limited number of Unix-like platforms. CRAN is started on this date, with 3 mirrors that initially hosted 12 packages. Alpha versions of R for Microsoft Windows and Mac OS are made available shortly after this version.
- Version 0.60 – December 5, 1997 – R becomes an official part of the GNU Project. The code is hosted and maintained on CVS.
- Version 1.0.0 – February 29, 2000 – Considered by its developers stable enough for production use.[16]
- Version 1.4.0 – S4 methods are introduced and the first version for Mac OS X is made available soon after.
- Version 2.0.0 – October 4, 2004 – Introduced lazy loading, which enables fast loading of data with minimal expense of system memory.
- Version 2.1.0 – Support for UTF-8 encoding, and the beginnings of internationalization and localization for different languages.
- Version 2.11.0 – April 22, 2010 – Support for Windows 64 bit systems.
- Version 2.13.0 – April 14, 2011 – Adding a new compiler function that allows speeding up functions by converting them to byte-code.
- Version 2.14.0 - October 31, 2011 - Added mandatory namespaces for packages. Added a new parallel package.
Interfaces
Graphical user interfaces
- RGUI – comes with the pre-compiled version of R
- Java Gui for R – cross-platform stand-alone R terminal and editor based on Java (also known as JGR)
- Deducer - GUI for menu driven data analysis (similar to SPSS/JMP/Minitab).
- Rattle GUI – cross-platform GUI based on RGtk2 and specifically designed for data mining
- R Commander – cross-platform menu-driven GUI based on tcltk (several plug-ins to Rcmdr are also available)
- RapidMiner [17] [18]
- RExcel – using R and Rcmdr from within Microsoft Excel
- Red-R – visual analysis interface that uses R for statistics
- RKWard – extensible GUI and IDE for R
- R AnalyticFlow - analysis flowcharts with R (freeware)
- RStudio - cross-platform open source IDE (which can also be run on a remote linux server)
- Weka[19] allows for the use of the data mining capabilities in Weka and statistical analysis in R.
Editors and IDEs
Text editors and Integrated development environments (IDEs) with some support for R include: Bluefish,[20] Crimson Editor, RStudio,[21] ConTEXT, Eclipse,[22] Emacs (Emacs Speaks Statistics), Vim, Tinn-R,[23] Geany, jEdit,[24] Kate,[25] R Productivity Environment (part of Revolution R Enterprise),[26] TextMate, gedit, SciTE, WinEdt (R Package RWinEdt), notepad++,[27].
Scripting languages
R functionality has been made accessible from several scripting languages such as Python (by the RPy[28] interface package), Perl (by the Statistics::R[29] module) and Ruby (with the rsruby[30] rubygem). Scripting in R itself is possible via littler[31] as well as via Rscript.
Comparison with SAS, SPSS and Stata
The general consensus is that R compares well with other popular statistical packages, such as SAS, SPSS and Stata[32]. In January 2009, the New York Times ran an article about R gaining acceptance among data analysts and presenting a potential threat for the market share occupied by commercial statistical packages, such as SAS.[33]
Commercial support for R
In 2007, Revolution Analytics was founded to provide commercial support for Revolution R, its distribution of R which also includes components developed by the company. Major additional components include: ParallelR[34], the R Productivity Environment IDE, [35] RevoScaleR (for big data analysis), [36] RevoDeployR[37], web services framework and the ability for reading and writing data in the SAS File Format.[38]
In Oct 2011, Oracle announced the Big Data Appliance, which integrates R, Apache Hadoop, Oracle Enterprise Linux, a NoSQL database with the Exadata hardware.[39] [40]
Other major commercial software systems supporting connections to R include: Spotfire,[41] SPSS,[42] STATISTICA,[43] Platform Symphony [44], SAS[45]
See also
- List of statistical packages
- Comparison of statistical packages
- List of numerical analysis software
- Comparison of numerical analysis software
- Free statistical software
- Sweave
- ggplot2
References
- ^ A Brief History R: Past and Future History, Ross Ihaka, Statistics Department, The University of Auckland, Auckland, New Zealand, available from the CRAN website
- ^ Fox, John and Andersen, Robert (January 2005) (PDF). Using the R Statistical Computing Environment to Teach Social Statistics Courses. Department of Sociology, McMaster University. http://www.unt.edu/rss/Teaching-with-R.pdf. Retrieved 2006-08-03.
- ^ a b Vance, Ashlee (2009-01-06). "Data Analysts Captivated by R's Power". New York Times. http://www.nytimes.com/2009/01/07/technology/business-computing/07program.html. Retrieved 2009-04-28. "R is also the name of a popular programming language used by a growing number of data analysts inside corporations and academia. It is becoming their lingua franca..."
- ^ "Robert Gentleman's home page". http://myprofile.cos.com/rgentleman. Retrieved 2009-07-20.
- ^ Kurt Hornik. The R FAQ: Why is R named R?. ISBN 3-900051-08-9. http://cran.r-project.org/doc/FAQ/R-FAQ.html#Why-is-R-named-R_003f. Retrieved 2008-01-29.
- ^ "Free Software Foundation (FSF) Free Software Directory: GNU R". http://directory.fsf.org/project/gnur/. Retrieved 2010-07-05.
- ^ "What is R?". http://www.r-project.org/about.html. Retrieved 2009-04-28.
- ^ Duncan Temple Lang, Calling R from Java, http://www.omegahat.org/RSJava/RFromJava.pdf, retrieved 2010-07-05
- ^ Jackman, Simon (Spring 2003). "R For the Political Methodologist" (PDF). The Political Methodologist (Political Methodology Section, American Political Science Association) 11 (1): 20–22. Archived from the original on 2006-07-21. http://web.archive.org/web/20060721143309/http://polmeth.wustl.edu/tpm/tpm_v11_n2.pdf. Retrieved 2006-08-03.
- ^ http://www.rexeranalytics.com/Data-Miner-Survey-Results-2010.html
- ^ "CRAN Task View: Graphic Displays & Dynamic Graphics & Graphic Devices & Visualization". The Comprehensive R Archive Network. http://cran.r-project.org/web/views/Graphics.html. Retrieved 2011-08-01.
- ^ Dalgaard, Peter (2002). Introductory Statistics with R. New York, Berlin, Heidelberg: Springer-Verlag. ISBN 0387954759X pages=10–18, 34.
- ^ "Speed comparison of various number crunching packages (version 2)". SciView. http://www.sciviews.org/benchmark. Retrieved 2007-11-03.
- ^ Robert A. Muenchen. "The Popularity of Data Analysis Software". http://sites.google.com/site/r4statistics/popularity.
- ^ http://cran.r-project.org/web/views/ReproducibleResearch.html
- ^ Peter Dalgaard. "R-1.0.0 is released". https://stat.ethz.ch/pipermail/r-announce/2000/000127.html. Retrieved 2009-06-06.
- ^ R Extension Presented on RCOMM 2010
- ^ "Data Mining / Analytic Tools Used Poll (May 2010)". http://www.kdnuggets.com/polls/2010/data-mining-analytics-tools.html.
- ^ "RWeka: An R Interface to Weka. R package version 0.3-17". Kurt Hornik, Achim Zeileis, Torsten Hothorn and Christian Buchta. http://CRAN.R-project.org/package=RWeka. Retrieved 2009.
- ^ Customizable syntax highlighting based on Perl Compatible regular expressions, with subpattern support and default patterns for..R, tenth bullet point, Bluefish Features, Bluefish website, retrieved 9 July 2008.
- ^ JJ Alaire and colleages. "RStudio: new IDE for R". http://www.rstudio.org. Retrieved 2011-08-04.
- ^ Stephan Wahlbrink. "StatET: Eclipse based IDE for R". http://www.walware.de/goto/statet. Retrieved 2009-09-26.
- ^ "Tinn-R Editor - GUI for R Language and Environment". Tinn-R Team. http://sourceforge.net/projects/tinn-r/. Retrieved 2010-11-07.
- ^ Jose Claudio Faria. "R syntax". http://community.jedit.org/?q=node/view/2339. Retrieved 2007-11-03.
- ^ "Syntax Highlighting". Kate Development Team. Archived from the original on 2008-07-07. http://web.archive.org/web/20080707062903/http://www.kate-editor.org/downloads/syntax_highlighting. Retrieved 2008-07-09.
- ^ "R Productivity Environment". Revolution Analytics. http://www.revolutionanalytics.com/products/enterprise-productivity.php. Retrieved 2011-09-03.
- ^ "NppToR: R in Notepad++". sourceforge.net. http://sourceforge.net/projects/npptor/. Retrieved 2010-07-11.
- ^ RPy home page
- ^ Statistics::R page on CPAN
- ^ RSRuby rubyforge project
- ^ littler web site
- ^ Comparison of R to SAS, Stata and SPSS
- ^ Vance, Ashlee (2009-01-07). "Data Analysts Captivated by R's Power". The New York Times. http://www.nytimes.com/2009/01/07/technology/business-computing/07program.html.
- ^ http://www.revolutionanalytics.com/news-events/news-room/2008/enhanced-statistical-analyses-with-parallelr.php
- ^ http://blog.revolutionanalytics.com/2009/11/rpe-the-r-productivity-environment-for-windows.html
- ^ http://www.revolutionanalytics.com/news-events/news-room/2010/revolution-analytics-brings-big-data-analysis-to-R.php
- ^ http://blog.revolutionanalytics.com/2010/09/introducing-revodeployr-web-services-for-r.html
- ^ 'Red Hat for stats' goes toe-to-toe with SAS
- ^ Oracle Unveils the Oracle Big Data Appliance
- ^ Oracle rolls its own NoSQL and Hadoop
- ^ Spotfire Integration with S+ and R
- ^ http://www.unt.edu/benchmarks/archives/2007/october07/rss.htm
- ^ http://www.statsoft.com/solutions/r-language-platform/
- ^ R” integrated with Symphony
- ^ Calling Functions in the R Language (SAS/IML)
External links
- Official website of the R project
- The R wiki, a community wiki for R
- R books, has extensive list (with brief comments) of R-related books
- The R Graphical Manual, a collection of R graphics from all R packages, and an index to all functions in all R packages
- R seek, a custom frontend to Google search engine, to assist in finding results related to the R language
GNU Project History 
Licenses Software Public speakers Other topics Numerical software Free Software - ADMB
- Euler
- FreeMat
- Genius
- GNU Octave
- gretl
- R
- Sage
- Scilab
Proprietary Statistical software Public domain Open source Freeware Retail Category • ComparisonCategories:- Data analysis software
- R (programming language)
- Free plotting software
- Free cross-platform software
- Functional languages
- Data-centric programming languages
- Statistical software


Wikimedia Foundation. 2010.