- Colorado's 5th congressional district
-
"CO-5" redirects here. For the state highway, see Colorado State Highway 5.
Colorado's 5th congressional district 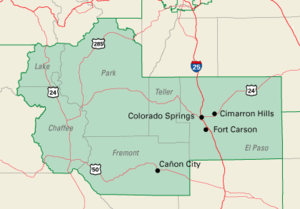
Current Representative Doug Lamborn (R–Colorado Springs) Area 7,732 mi² Distribution 85.7% urban, 14.3% rural Population (2000) 614,467 Median income $45,454 Ethnicity 77.4% White, 5.7% Black, 2.2% Asian, 11.1% Hispanic, 0.7% Native American, 0.2% other Cook PVI R+14 Colorado's 5th congressional district is a congressional district in the U.S. state of Colorado. The district lies in the center of the state and mostly comprises Colorado Springs and its suburbs including Cimarron Hills and Fort Carson.
The district is currently represented by Republican Doug Lamborn.
Contents
Characteristics
Politics
The Republican Party has held control of the seat since the district's creation. With a Cook PVI of R+16, the 5th Congressional District of Colorado is the most conservative district in the state. Colorado Springs, the main population center within the district, is home to many conservative-leaning organizations. Among these groups are Focus on the Family, its founder Dr. James Dobson (who is considered by some to be the most influential evangelical leader in the country[1]), New Life Church, Compassion International, HCJB, and many others.
Colorado Springs also boasts a large population of both active-duty and retired military personnel and is home to many companies in the defense industry, all of which are demographics that tend to vote for Republicans. Throughout the district's history, Republicans have won by comfortable margins. From 1996 through 2004, Republican Joel Hefley usually won reelections with about 70% of the vote. George W. Bush received 66% of the vote in this district in 2004.
Economy
Because of the strong military presence, Colorado Springs's economy is usually very stable and frequently sees growth. The western portions of the district are mostly small mountain towns whose economy depends on ranching, farming, mining, and tourism.
Tourism
Millions of tourists visit the Colorado Springs region every year, primarily to visit Garden of the Gods, Pikes Peak, and the United States Air Force Academy.
Military
Colorado Springs, located within the district, is home to multiple military installations. Fort Carson, the United States Air Force Academy, Peterson Air Force Base, Schriever Air Force Base, and NORAD are also all located within the district.
History
1990s
Following the 1990 U.S. Census and associated realignment of Colorado congressional districts, the 5th Congressional district consisted of El Paso and Teller counties, as well as portions of Arapahoe, Douglas, and Fremont counties.[2]
2000s
Following the 2000 U.S. Census and associated realignment of Colorado congressional districts, the 5th Congressional district consisted of Chaffee, El Paso, Fremont, Lake, and Teller counties, as well as portions of Park County.
Voting
Election results from presidential races[3]
Year Office Result 2000 President Bush 63% - Gore 31% 2004 President Bush 66% - Kerry 33% 2008 President McCain 59% - Obama 40% List of representatives
Representative Party Term Duration Congress District Home Electoral history District created January 3, 1973  Bill Armstrong
Republican January 3, 1973 –
January 3, 197993rd Littleton First elected in 1972
Retired to run for U.S. Senate94th 95th Ken Kramer Republican January 3, 1979 –
January 3, 198796th First elected in 1978
Retired to run for U.S. Senate97th 98th 99th  Joel Hefley
Republican January 3, 1987 –
January 3, 2007100th Colorado Springs First elected in 1986
Retired101st 102nd 103rd 104th 105th 106th 107th 108th 109th  Doug Lamborn
Republican January 3, 2007 –
Present110th Colorado Springs First elected in 2006 111th 112th Election results
1972 • 1974 • 1976 • 1978 • 1980 • 1982 • 1984 • 1986 • 1988 • 1990 • 1992 • 1994 • 1996 • 1998 • 2000 • 2002 • 2004 • 2006 • 2008 • 2010
1972
United States House of Representatives elections, 1972[4] Party Candidate Votes Percentage Republican Bill Armstrong 104,214 62.33% Democratic Byron L. Johnson 60,948 36.45% Libertarian Pipp M. Boyls 2,028 1.22% Totals 167,190 100.0% Republican win (new seat) 1974
United States House of Representatives elections, 1974[5] Party Candidate Votes Percentage Republican Bill Armstrong (incumbent) 85,326 57.73% Democratic Ben Galloway 56,888 38.49% Independent Stan Johnson 5,580 3.78% Totals 147,794 100.0% Republican hold 1976
United States House of Representatives elections, 1976[6] Party Candidate Votes Percentage Republican Bill Armstrong (incumbent) 126,784 66.43% Democratic Dorothy Hores 64,067 33.57% Totals 190,851 100.0% Republican hold 1978
United States House of Representatives elections, 1978[7] Party Candidate Votes Percentage Republican Ken Kramer 91,933 59.78% Democratic Gerry Frank 52,914 34.41% Independent L.W. Dan Bridges 8,933 5.81% Totals 153,780 100.0% Republican hold 1980
United States House of Representatives elections, 1980[8] Party Candidate Votes Percentage Republican Ken Kramer (incumbent) 177,319 72.41% Democratic Ed Schreiber 62,003 25.32% Libertarian John A. Lanning 5,578 2.27% Totals 244,900 100.0% Republican hold 1982
United States House of Representatives elections, 1982[9] Party Candidate Votes Percentage Republican Ken Kramer (incumbent) 84,479 59.55% Democratic Thomas Cronin 57,392 40.45% Totals 141,871 100.0% Republican hold 1984
United States House of Representatives elections, 1984[10] Party Candidate Votes Percentage Republican Ken Kramer (incumbent) 163,654 78.59% Democratic William Geffen 44,588 21.41% Totals 206,242 100.0% Republican hold 1986
United States House of Representatives elections, 1986[11] Party Candidate Votes Percentage Republican Joel Hefley 121,153 69.77% Democratic Bill Story 52,488 30.23% Totals 173,641 100.0% Republican hold 1988
United States House of Representatives elections, 1988[12] Party Candidate Votes Percentage Republican Joel Hefley (incumbent) 181,612 75.13% Democratic John J. Mitchell 60,116 24.87% Totals 241,728 100.0% Republican hold 1990
United States House of Representatives elections, 1990[13] Party Candidate Votes Percentage Republican Joel Hefley (incumbent) 127,740 66.44% Democratic Cal Johnston 57,776 30.05% Libertarian Keith L. Hamburger 6,761 3.51% Totals 192,277 100.0% Republican hold 1992
United States House of Representatives elections, 1992[14] Party Candidate Votes Percentage Republican Joel Hefley (incumbent) 173,096 71.11% Democratic Charles A. Oriez 62,550 25.70% Libertarian Keith L. Hamburger 7,769 3.19% Totals 243,415 100.0% Republican hold 1994
United States House of Representatives elections, 1994[15] Party Candidate Votes Percentage Republican Joel Hefley (incumbent) 138,674 100.00% Totals 138,674 100.0% Republican hold 1996
Republican Primary
1996 Republican Primary Congressional Election[16] Party Candidate Votes Percentage Republican Joel Hefley 36,994 76.70% Republican Bill Hughes 11,236 23.30% General
United States House of Representatives elections, 1996[17] Party Candidate Votes Percentage Republican Joel Hefley (incumbent) 188,805 71.94% Democratic Mike Robinson 73,660 28.06% Totals 262,465 100.0% Republican hold 1998
United States House of Representatives elections, 1998[18] Party Candidate Votes Percentage Republican Joel Hefley (incumbent) 155,790 72.71% Democratic Ken Alford 55,609 25.95% Natural Law Mark A. Mellot 2,871 1.34% Totals 214,270 100.0% Republican hold 2000
United States House of Representatives elections, 2000[19] Party Candidate Votes Percentage Republican Joel Hefley (incumbent) 253,330 82.70% Libertarian Kerry Kantor 37,719 12.31% Natural Law Randy Mackenzie 15,260 4.99% Totals 306,309 100.0% Republican hold 2002
United States House of Representatives elections, 2002[20] Party Candidate Votes Percentage Republican Joel Hefley (incumbent) 128,118 69.37% Democratic Curtis Imrie 45,587 24.69% Libertarian Biff Baker 10,972 5.94% Totals 184,677 100.0% Republican hold 2004
United States House of Representatives elections, 2004[21] Party Candidate Votes Percentage Republican Joel Hefley (incumbent) 193,333 70.55% Democratic Fred Hardee 74,098 27.04% Libertarian Arthur "Rob" Roberts 6,627 2.41% Totals 274,058 100.0% Republican hold 2006
Republican Primary
2006 Republican Primary Congressional Election[22] Party Candidate Votes Percentage Republican Doug Lamborn 15,126 26.97% Republican Jeff Crank 14,234 25.38% Republican Bentley B. Rayburn 9,735 17.36% Republican Lionel Rivera 7,213 12.86% Republican John Wesley Anderson 6,474 11.54% Republican Duncan Bremer 3,310 5.90% General
United States House of Representatives elections, 2006[23] Party Candidate Votes Percentage Republican Doug Lamborn 123,264 59.62% Democratic Jay Fawcett 83,431 40.35% Republican Richard D. Hand (as a write-in) 41 0.02% Democratic Brian X. Scott (as a write-in) 12 0.01% Republican Gregory S. Hollister 8 0.00% Totals 206,756 100.0% Republican hold 2008
Republican Primary
2008 Republican Primary Congressional Election[24] Party Candidate Votes Percentage Republican Doug Lamborn 24,995 44.03% Republican Jeff Crank 16,794 29.58% Republican Bentley B. Rayburn 14,986 26.40% General
United States House of Representatives elections, 2008[25] Party Candidate Votes Percentage Republican Doug Lamborn (incumbent) 183,179 60.03% Democratic Hal Bidlack 113,027 37.04% Constitution Brian X. Scott 8,894 2.92% No party Richard D. Hand 45 0.03% Totals 305,142 100.0% Republican hold 2010
United States House of Representatives elections, 2010[26] Party Candidate Votes Percentage Republican Doug Lamborn (incumbent) 152,829 65.75% Democratic Kevin Bradley 68,039 29.27% Constitution Brian X. Scott 5,886 2.53% Libertarian Jerrell Klaver 5,680 2.44% Totals 232,434 100.0% Republican hold References
- ^ Olsen, Ted (2005-02-21). "Who's Driving This Thing?". Christianity Today. http://www.christianitytoday.com/ct/2005/februaryweb-only/12.0c.html. Retrieved 2008-09-05.
- ^ State of Colorado. Congressional District Map (Map). http://www.state.co.us/gov_dir/govnr_dir/bc/cong.gif. Retrieved 2008-12-22.
- ^ Presidential Election Results, by district, swingstateproject.com
- ^ 1972 Election Results
- ^ 1974 Election Results
- ^ 1976 Election Results
- ^ 1978 Election Results
- ^ 1980 Election Results
- ^ 1982 Election Results
- ^ 1984 Election Results
- ^ 1986 Election Results
- ^ 1988 Election Results
- ^ 1990 Election Results
- ^ 1992 Election Results
- ^ 1994 Election Results
- ^ 1996 Primary Results
- ^ 1996 Election Results
- ^ 1998 Election Results
- ^ 2000 Election Results
- ^ 2002 Election Results
- ^ 2004 Election Results
- ^ 2006 Primary Results
- ^ 2006 Election Results
- ^ 2008 Primary Results
- ^ 2008 Election Results
- ^ 2010 Election Results
Colorado's congressional districts All districts: Territory At-large 1 2 3 4 5 6 7
See also: Colorado's past & present Representatives, Senators, and Delegations, 2010 elections, 2012 elections
All U.S. districts – Apportionment – Redistricting – Gerrymandering – MapsCategories:


Wikimedia Foundation. 2010.