- Climate of the Twin Cities
-
 The ice castle at the 2004 St. Paul Winter Carnival.
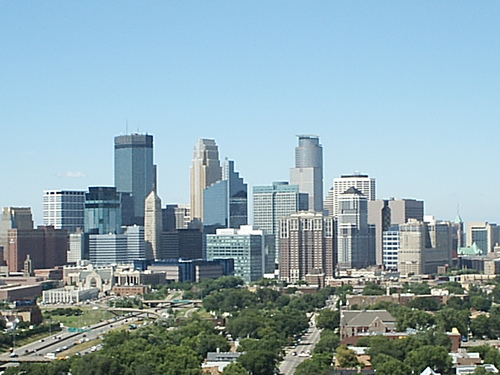
 Minneapolis on a sunny summer afternoon
The climate of the Twin Cities is the long term weather trends and historical events of the Minneapolis-Saint Paul metropolitan area in east central Minnesota. Minneapolis and St. Paul, together known as the Twin Cities, are the core of the 15th largest metropolitan area in the United States. With a population of 3.6 million people, the region contains approximately 60% of the population of Minnesota. Due to its location in the northern and central portion of the U.S., the Twin Cities has the coldest average temperature of any major metropolitan area in the nation. Winters can be very cold, summer is warm to hot and frequently humid, snowfall is common in the winter and thunderstorms with heavy rainfall occur during the spring, summer and autumn. Though winter can be uncomfortably cold, the area receives more sunlight hours in mid-winter than many other warmer parts of the country, including all of the Great Lakes states, the Pacific Northwest, parts of the South, and almost all of the Northeast.[1]
Contents
General climatology
On the Koppen climate classification scale, the Twin Cities is located near the transition of the hot (Dfa) and warm (Dfb) within the humid continental climate zone.[3] The continental climate refers to the large amounts of land mass and absence of large body of water that surrounds the region. The humid portions derives from the humid air masses that routinely
 A lakeside bike path in summer
flow northwards towards the region from the Gulf of Mexico. A feature of the humid continental climate in the United States is that weather can be unpredictable with extremes occurring in many phases of measurements. For example, the Twin Cities has a hotter all time record high temperature of 108 °F (42 °C) than the entire state of Florida, despite being located nearly 1000 miles farther from the equator. Conversely, temperature during the winter months are colder in the Twin Cities than in any other major metropolitan area in the continental United States, and are indeed colder than Anchorage, Alaska, which is around 1,000 miles closer to the North Pole. The Twin Cities can also experience droughts, floods, and on average is windier than The Windy City, Chicago, Illinois.
Temperature
Climate data for Minneapolis (Minneapolis−Saint Paul International Airport) Month Jan Feb Mar Apr May Jun Jul Aug Sep Oct Nov Dec Year Record high °F (°C) 59
(15)64
(18)83
(28)95
(35)106
(41)104
(40)108
(42)103
(39)104
(40)90
(32)77
(25)68
(20)108
(42)Average high °F (°C) 21.9
(−5.6)28.4
(−2)40.6
(4.8)57.0
(13.9)70.1
(21.2)79.0
(26.1)83.3
(28.5)80.4
(26.9)71.1
(21.7)58.4
(14.7)40.1
(4.5)26.4
(−3.1)54.7 Average low °F (°C) 4.3
(−15.4)11.8
(−11.2)23.5
(−4.7)36.2
(2.3)48.5
(9.2)57.8
(14.3)63.0
(17.2)60.8
(16.0)50.8
(10.4)38.9
(3.8)24.8
(−4)10.9
(−11.7)35.9 Record low °F (°C) −41
(−40.6)−40
(−40)−32
(−35.6)2
(−16.7)18
(−7.8)34
(1)43
(6)39
(4)26
(−3.3)10
(−12.2)−25
(−31.7)−39
(−39.4)−41
(−40.6)Precipitation inches (mm) 1.04
(26.4).79
(20.1)1.86
(47.2)2.31
(58.7)3.24
(82.3)4.34
(110.2)4.04
(102.6)4.05
(102.9)2.69
(68.3)2.11
(53.6)1.94
(49.3)1.00
(25.4)29.41
(747)Snowfall inches (cm) 12.4
(31.5)8.0
(20.3)10.4
(26.4)3.1
(7.9)0
(0)0
(0)0
(0)0
(0)0
(0).6
(1.5)9.8
(24.9)9.3
(23.6)53.6
(136.1)Avg. precipitation days (≥ 0.01 in) 9.9 7.5 10.2 11.3 10.9 11.1 10.4 10.4 9.8 8.4 9.1 9.7 118.7 Avg. snowy days (≥ 0.1 in) 9.7 7.1 6.3 2.2 0 0 0 0 0 .6 5.8 8.4 40.1 Sunshine hours 158.1 180.8 217.0 243.0 294.5 321.0 350.3 306.9 234.0 179.8 114.0 114.7 2,714.1 Source no. 1: NCDC [4], The Weather Channel (Extremes) [5] Source no. 2: HKO [6]
Because of its location in the center of North America, the Twin Cities region is subjected to some of the widest range of temperatures in the United States. Temperatures in the Twin Cities region range from an average of 13.1 °F (−10 °C) in January to 73.2 °F (23 °C) in July. With no natural barriers to block cold air from pouring south from Canada, the Twin Cities is subjected to many arctic air masses throughout the winter months. These arctic air masses bring with them very cold temperatures and sometimes strong winds, resulting in dangerous wind chill values. The Twin Cities has a comparable average summer temperatures to other nearby metropolitan areas such as Chicago, but the arctic outbreaks during the winter push the average winter temperature of the Twin Cities well below that of Chicago's. Despite being located just 350 miles (563 km) from Chicago, the Twin Cities' average January of temperature of 13.1 °F (−10 °C) is well below Chicago's 22.0 °F (−6 °C). During summer months, Minneapolis can be subject to very hot temperatures, and very high humidity. This combination can drive the heat index to over 120 °F (49 °C).Urban heat island effect
A significant impact on temperatures in the Twin Cities the past several years has been the urban heat island effect. Large amounts of concrete and asphalt, coupled with numerous tall buildings (which block wind) help to trap heat close to the surface, resulting in warmer temperatures than that of the surrounding areas (even those further to the south). For example, the average annual temperature of 45.4 at the Minneapolis St. Paul International airport is warmer than that of Rochester (43.4)[7] and Mankato (44.7)[8] which are both located farther to the south.
Precipitation
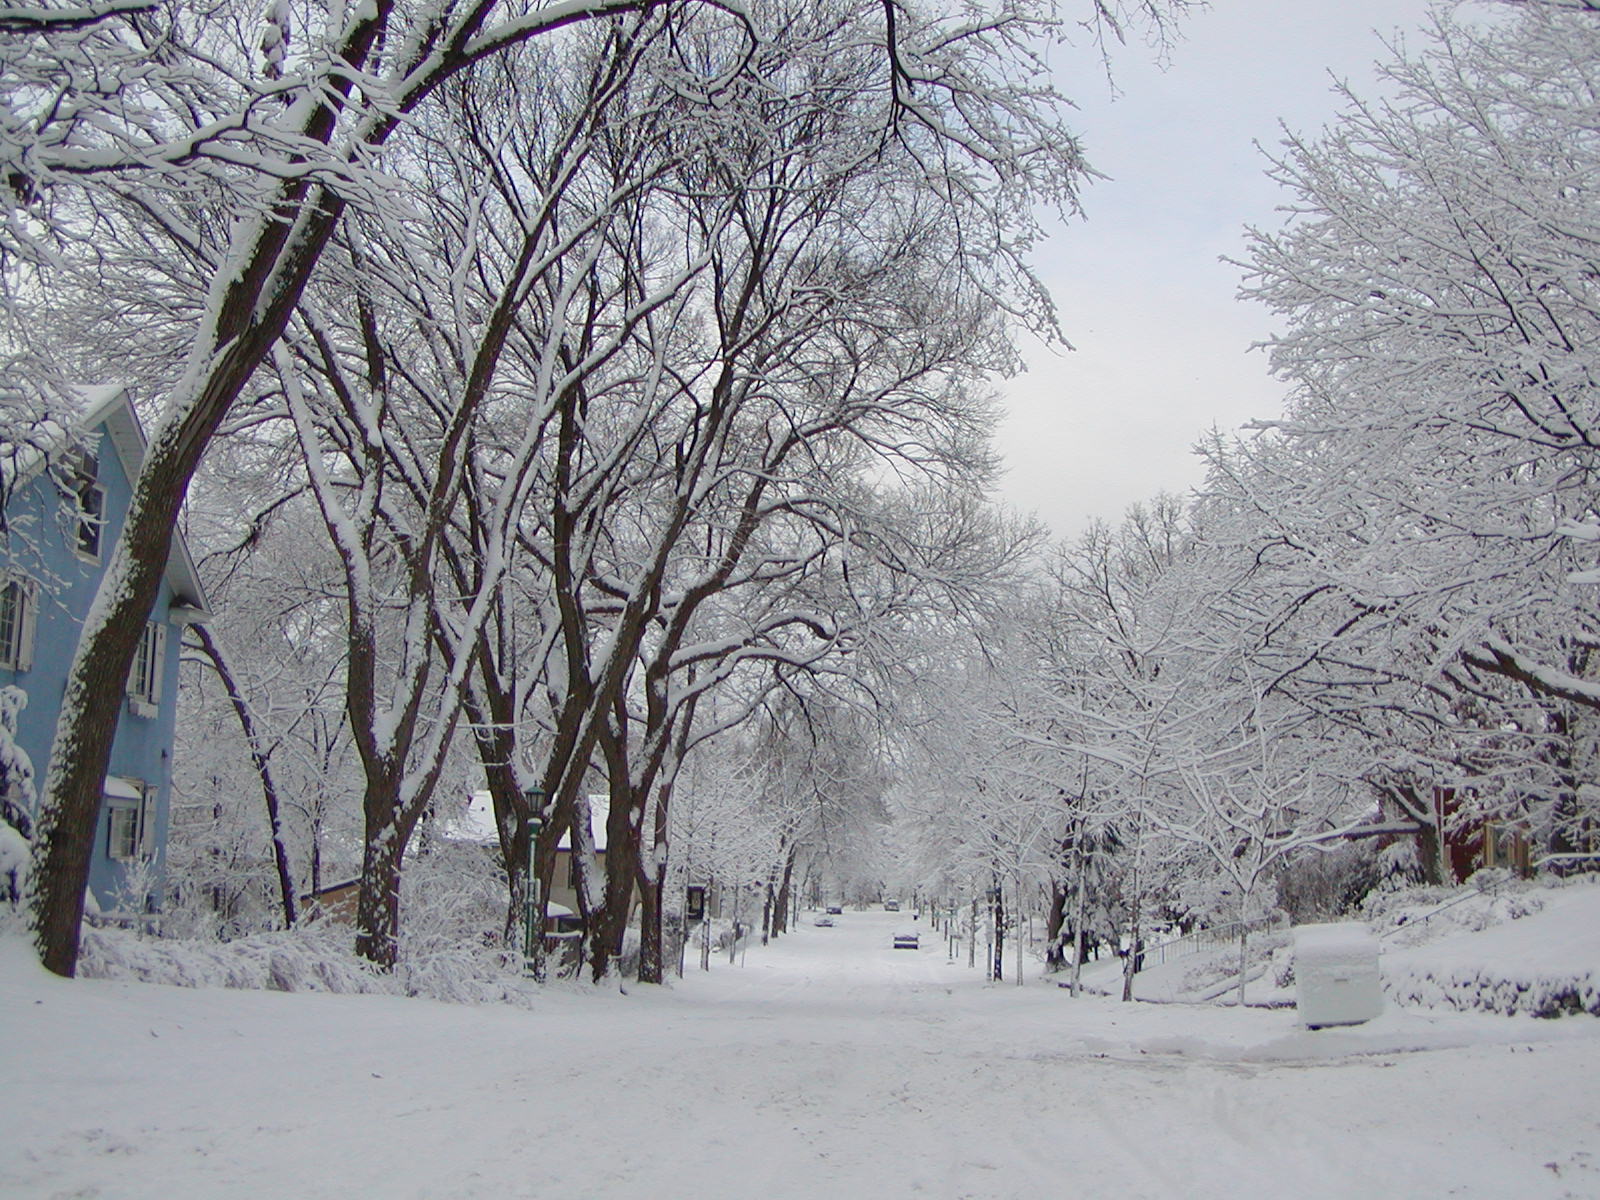
 A wintry February day in St. Paul
The Twin Cities experiences a wide range of precipitation types. Rain is the most common form during the summer months, while snow, sleet, freezing rain, and occasionally rain occur during the winter. The summer months of June, July and August account for nearly half of the annual precipitation total across the Twin Cities.[9] Most of this rain falls from thunderstorms, a frequent summer occurrence. Even though summer is the primary season for the Twin Cities to experience thunderstorms, they can occur from March to November, or even during winter storms in the form of thundersnow. These storms can become severe, producing large hail, strong tornadoes, and large bow echos that result in damaging straight-line winds. The Twin Cities has experienced several major derecho events, most recently during the Late-May 1998 Tornado Outbreak and Derecho which traveled from South Dakota to New York on May 30 – May 31, 1998. Summertime thunderstorms are fueled by dew points that often reach into the 70s °F (21 °C) and sometimes even 80 °F (27 °C).[10]
 St. Anthony Falls after a spring storm
Winter precipitation comes in a few different forms. Snow is the main form of precipitation, but freezing rain, ice, sleet and sometimes even rain are all possible during the winter months. Larger storm systems, often Panhandle hooks or other storms that occur with a meridional flow, can bring large amounts of snow and even blizzard conditions.[11] The average annual snowfall in the Twin Cities is 45.3 inches (115.1 cm), with an average of 100 days per year with at least 1 inch (2.5 cm) of snow cover. The most snow was the Twin Cities has officially seen during one winter was in 1983–1984 with 98.4 inches (250 cm), and the least was in 1930–1931 with 14.2 inches (36.1 cm).
Weather events
Tornadoes
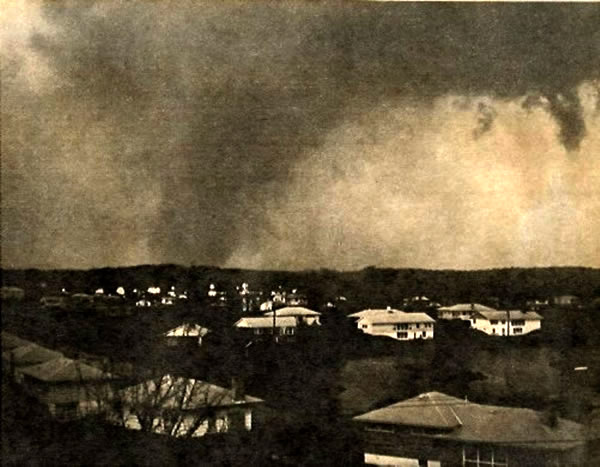
 A tornado over Minnetonka, Minnesota on May 6, 1965.
The Twin Cities metropolitan area lies near the northern edge of Tornado Alley, and as such the region experiences tornadoes almost annually. The first recorded tornado observed in the Twin cities metro area was in 1820 at Fort Snelling. A destructive tornado struck St. Paul in 1891.
The worst tornado event to affect the Twin Cities was on May 6, 1965. On that day, six tornadoes touched down in several counties in and around the western and northern metro area, killing 13 people and injuring over 600. Four of the tornadoes were rated F4, two of which hit Fridley, Minnesota about an hour apart. This outbreak was notable because this was the first time in Minnesota history that civil defense sirens were used to warn people of impending severe weather. The live coverage by the Twin Cities media was also unprecedented. WCCO's continual broadcast of the weather situation is credited with warning people about the tornadoes and saving lives. In the entire history of Minnesota the 1965 Twin Cities tornado outbreak was the costliest weather disaster.
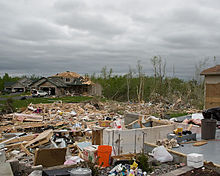 Damage to homes from the EF3 tornado in Hugo, Minnesota on May 25, 2008.
In 1981 a twister dubbed the Har-Mar tornado touched down in Minneapolis, proceeding to affect the northern suburbs of the metro area, including killing a man near Lake Harriet. On July 18, 1986 a tornado touched down in Fridley, and video captured from KARE 11 news helicopter was broadcast live on their 5:00 pm newscast. The aerial video captured on that day was unprecedented at the time, and was heavily researched.
On May 25, 2008 an EF3 tornado hit the town of Hugo during the Late-May 2008 tornado outbreak sequence. The twister damaged or destroyed several homes in the town, causing an estimated $25 million dollars in damage.
Derechos
Though derechos do not have winds as strong as tornadoes, they impact larger areas and thus can easily cause just as much damage. The costliest severe weather event in the Twin cities history was a derecho that occurred on May 15, 1998. Large hail and damaging wind caused most of the $1 billion in damages reported. Two weeks later on May 30, another large derecho produced winds of over 80 miles per hour (130 km/h) over a large portion of the Twin Cities metropolitan area. These two events combined to cause $1.5 billion in damage, and they created the largest debris cleanup project in Minnesota history.[12]
Snow
On November 11, 1940 the Armistice Day Blizzard affected all of southeast Minnesota, killing 60 people in Minnesota. The Twin Cities recorded 17 inches of snow, and temperatures dropped nearly sixty degrees over the course of one day. The largest snowstorm to affect most of the Twin Cities area was the Halloween Blizzard on October 31 – November 2, 1991. Officially, 28.4 inches (72 cm) of snow was reported at the Twin Cities airport. The heaviest snow fell in a line from there, northward to Duluth. Lesser amounts fell to the east and west of that line, but it was the largest early-season snowstorm for the entire region.
Floods
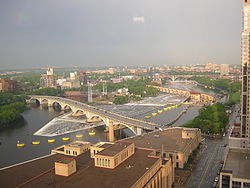
The largest flash flood in Twin Cities history occurred on July 23–July 24, 1987. Dubbed locally The Super Storm, more rain fell from this event than any other in recorded Twin Cities history. The storm caused damage to 9,000 homes, killed two people, and caused $27 million in damage. Some areas in the southern metro area recorded 11 inches (279 mm) of rain.[13] The 9.15 inches (232 mm) that fell on July 23 is the largest official single-day rainfall for the Twin Cities.[14] Overall, at least 10 inches (254 mm) of rain fell over 93 square miles (241 km2), and at least 4 inches (100 mm) fell over 1,460 square miles (3,781 km2). This event was voted the eighth most significant weather event in the state of Minnesota during the 20th century.[15] Three days before this event on July 20–July 21, up to 9 inches (230 mm) of rain fell over some of these same areas.[16] These two storms combined to help the Twin Cities to their wettest summer on record, with 23.52 inches (597 mm) of rain falling from June to August.[17]
The Minnesota River and Mississippi River both flow through the Twin Cities, and in turn there is some degree of River flooding almost annually. The worst floods in Twin Cities history on these rivers were in 1965. Other substantial floods occurred in 1969, 1993, 1997 and 2001.
See also
References
- ^ General Climate Information from Climate Atlas of the United States. Western Regional Climate Center.
- ^ http://www.weather.com/outlook/travel/businesstraveler/wxclimatology/monthly/graph/USMN0503
- ^ Kottek, Markus; Kottek, Grieser, Beck, Rudolf, Rubel (June 2006). "World Map of the Köppen-Geiger climate classification updated". Meteorologische Zeitschrift (E. Schweizerbart'sche Verlagsbuchhandlung) 15 (3): 259–263. Bibcode 2006MetZe..15..259K. doi:10.1127/0941-2948/2006/0130. http://www.ingentaconnect.com/search/download;jsessionid=fmsejsjc7e0i3.alice?pub=infobike%3a%2f%2fschweiz%2fmz%2f2006%2f00000015%2f00000003%2fart00001&mimetype=application%2fpdf. Retrieved 2008-07-20.
- ^ "NCDC: U.S. Climate Normals". National Oceanic and Atmospheric Administration. http://cdo.ncdc.noaa.gov/climatenormals/clim20/mn/215435.pdf. Retrieved February 2010.
- ^ "Monthly Averages for Minneapolis, MN". The Weather Channel. http://www.weather.com/weather/wxclimatology/monthly/USMN0503. Retrieved October 2007.
- ^ "Climatological Normals of Minneapolis". Hong Kong Observatory. http://www.weather.gov.hk/wxinfo/climat/world/eng/n_america/us/minneapolis_e.htm. Retrieved 2010-05-11.
- ^ "ROCHESTER INTL AP, MN". Climatography of the United States NO. 84, 1971-2000. National Climatic Data Center. 1971-2000. http://www.ncdc.noaa.gov/DLYNRMS/dnrm?coopid=217004. Retrieved 2008-08-01.
- ^ "MANKATO, MN". Climatography of the United States NO. 84, 1971-2000. National Climatic Data Center. 1971-2000. http://www.ncdc.noaa.gov/DLYNRMS/dnrm?coopid=215073. Retrieved 2008-08-01.
- ^ "Normal Precipitation Maps". Minnesota Climatology Office. November 13, 2003. http://climate.umn.edu/doc/historical/precip_norm.htm. Retrieved 2006-11-10.
- ^ "High Dew Point Temperatures". Minnesota Climatology Office. July 28, 2005. http://climate.umn.edu/doc/journal/dewpoint050723.htm. Retrieved 2006-12-08.
- ^ Palmer, Chad (November 1, 2007). "Meridional flow brings extreme weather to USA". USA Today. http://www.usatoday.com/weather/wmeridio.htm. Retrieved 2007-12-19.
- ^ "FEMA-1225-DR-MN (1998)". FEMA. June 23, 1998. http://www.hsem.state.mn.us/HSem_view_Article.asp?docid=171&catid=1#1225. Retrieved 2008-05-30.
- ^ Boyles, Eric (July 22, 2007). "20 Years later: The 1987 'Super Storm'". KSTP. http://google.com/search?q=cache:5z8eBDMoKC4J:kstp.com/article/stories/S146344.shtml%3Fcat%3D1+site:kstp.com+superstorm+1987&hl=en&ct=clnk&cd=1&gl=us&client=firefox-a. Retrieved 2008-08-01.
- ^ Seeley, Mark (2006). Minnesota Weather Almanac. Minnesota Historical Society press. p. 169. ISBN 0-87351-554-4.
- ^ "Candidates for the most significant Minnesota weather or weather-driven events of the 20th Century.". Minnesota State Climatology Office. April 24, 2007. http://climate.umn.edu/doc/journal/top5/top5cand.htm. Retrieved 2008-08-01.
- ^ Zandlo, James (April 4, 2001). "Western and South Central Twin Cities Flash Flood: July 23-24, 1987" (PDF). Minnesota State Climatology Office. http://climate.umn.edu/pdf/flash_flood/ff1987.PDF. Retrieved 2008-08-01.
- ^ Seeley, Mark (2006). Minnesota Weather Almanac. Minnesota Historical Society press. p. 160. ISBN 0-87351-554-4.
External links
Categories:- Climate by city
- Climate of Minnesota
- Minneapolis–Saint Paul


Wikimedia Foundation. 2010.