- Demographics of Canada
-
Historical populations Year Pop. ±% 1851 2,415,000 — 1861 3,174,000 +31.4% 1871 3,689,000 +16.2% 1881 4,325,000 +17.2% 1891 4,833,000 +11.7% 1901 5,371,000 +11.1% 1911 7,207,000 +34.2% 1921 8,788,000 +21.9% 1931 10,377,000 +18.1% 1941 11,507,000 +10.9% 1951 14,009,000 +21.7% 1961 18,238,000 +30.2% 1971 21,962,000 +20.4% 1981 24,820,000 +13.0% 1991 28,031,000 +12.9% 2001 31,021,000 +10.7% 2011 est. 34,657,000 +11.7% Source: Statistics Canada[1] This article about the demographic features of the population of Canada, including population density, ethnicity, education level, health of the populace, economic status, religious affiliations and other aspects of the population, the People of Canada.
- Population of Canada: 31,612,895 (2006 Census).
- Population of Canada: 34,265,000 (Est.[Note 1])
Contents
Provinces and territories
Province or territory Population Percentage of national pop. Total area (km2) Population density Seats in House of Commons People per House Seat Ontario 13,119,251 38.73% 1,076,395 12.19 106 123,767 Quebec 7,856,881 23.19% 1,365,128 5.76 75 104,758 British Columbia 4,479,934 13.23% 925,186 4.84 36 124,443 Alberta 3,703,979 10.93% 642,317 5.77 28 132,285 Manitoba 1,226,196 3.62% 553,556 2.22 14 87,585 Saskatchewan 1,034,974 3.06% 591,670 1.75 14 73,927 Nova Scotia 940,397 2.78% 53,338 17.63 11 85,491 New Brunswick 750,457 2.22% 71,450 10.50 10 75,046 Newfoundland and Labrador 510,272 1.51% 373,872 1.36 7 72,896 Prince Edward Island 141,374 0.42% 5,660 24.98 4 35,344 Northwest Territories 43,244 0.13% 1,183,085 0.037 1 43,244 Yukon 33,963 0.10% 474,391 0.072 1 33,963 Nunavut 32,435 0.10% 1,936,113 0.017 1 32,435 Canada 33,873,357 100% 9,252,161 3.73 308 109,167 Cities
Largest cities of Canada
2006 CensusRank City Name Province Pop. Rank City Name Province Pop. 
Toronto
1 Toronto Ontario 2,503,281 11 Brampton Ontario 433,806 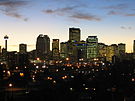
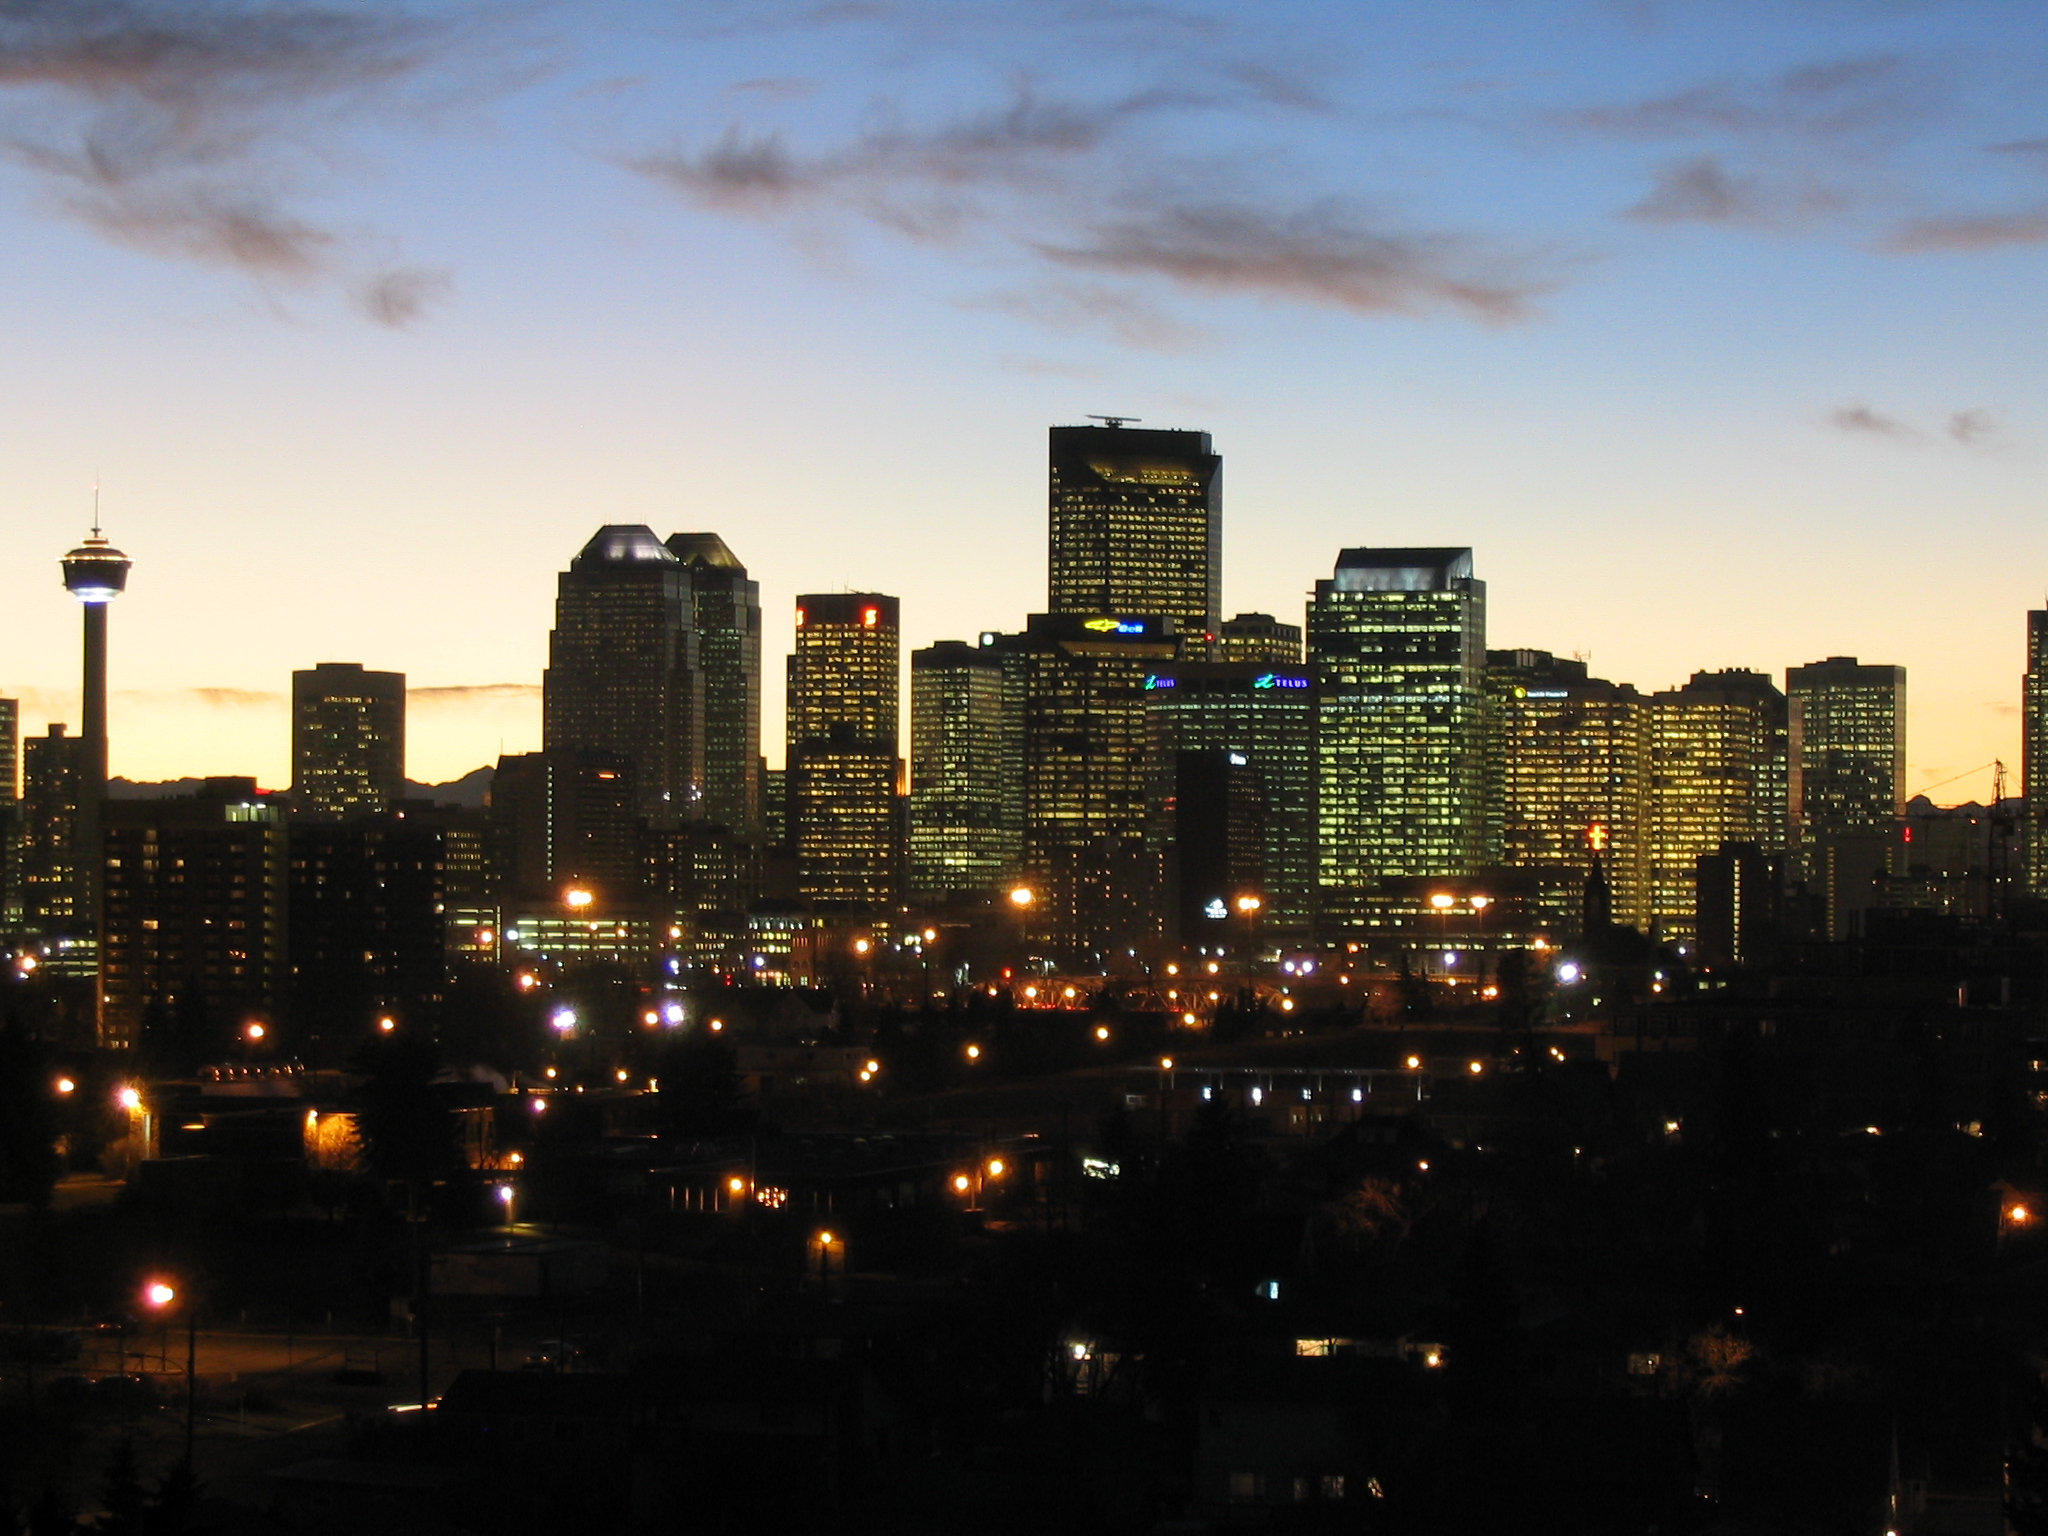
Calgary
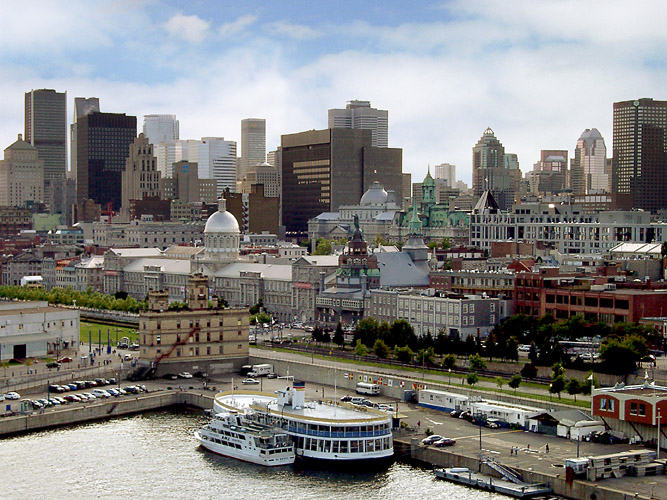
2 Montreal Quebec 1,620,693 12 Surrey British Columbia 394,976 3 Calgary Alberta 988,193 13 Halifax Nova Scotia 372,679 4 Ottawa Ontario 812,129 14 Laval Quebec 368,709 5 Edmonton Alberta 730,372 15 London Ontario 352,395 6 Mississauga Ontario 668,549 16 Markham Ontario 261,573 7 Winnipeg Manitoba 633,451 17 Gatineau Quebec 242,124 8 Vancouver British Columbia 578,041 18 Vaughan Ontario 238,866 9 Hamilton Ontario 504,559 19 Longueuil Quebec 229,330 10 Quebec City Quebec 491,142 20 Windsor Ontario 216,473 Largest metropolitan areas in Canada by population (2006 Census) Name Province Population Name Province Population Toronto Ontario 5,113,149 Kitchener–Cambridge-Waterloo Ontario 451,235 Montreal Quebec 3,635,571 St. Catharines–Niagara Ontario 390,317 Vancouver British Columbia 2,316,581 Halifax Nova Scotia 372,858 Ottawa–Gatineau Ontario–Quebec 1,130,761 Oshawa Ontario 330,594 Calgary Alberta 1,079,310 Victoria British Columbia 330,088 Edmonton Alberta 1,034,945 Windsor Ontario 323,342 Quebec Quebec 715,515 Saskatoon Saskatchewan 233,923 Winnipeg Manitoba 694,898 Regina Saskatchewan 194,971 Hamilton Ontario 692,911 Sherbrooke Quebec 186,952 London Ontario 457,720 St. John's Newfoundland and Labrador 181,113 Median age
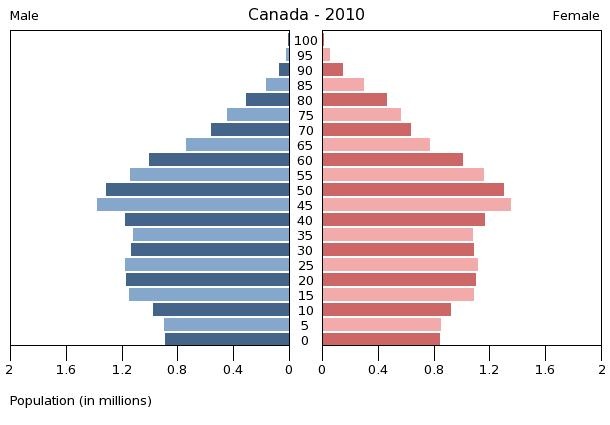
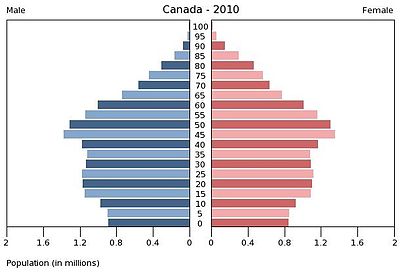 Population pyramid in 2010
- total: 39.5 years
- male: 38.6 years
- female: 40.4 years (2006)
Median age by province and territory, 2006 Census
- Nova Scotia: 41.8
- Newfoundland and Labrador: 41.7
- New Brunswick: 41.5
- Quebec: 41.0
- British Columbia: 40.8
- Prince Edward Island: 40.8
- Ontario: 39.0
- Saskatchewan: 38.7
- Yukon: 38.4
- Manitoba: 38.1
- Alberta: 36.0
- Northwest Territories: 31.2
- Nunavut: 23.1
Total: 39.5
- Sources: Statistics Canada[4]
Population growth rates
Further information: List of population of Canada by yearsAccording to OECD/World Bank the population in Canada increased from 1990 to 2008 with 5.6 million and 20.4 % growth in population compared to 21.7 % growth in the USA and 31.2 % growth in Mexico. According to the OECD/World Bank population statistics between 1990-2008 the world population growth was 27 % and 1,423 million persons.[5]
Rank Province or Territory 2006 pop. 2001 pop. Growth % Change Percentage of national pop. 1 Ontario 12,160,282 11,410,046 750,236 6.6 38.47% 2 Alberta 3,290,350 2,974,807 315,543 10.6 10.40% 3 Quebec 7,546,131 7,237,479 308,652 4.3 23.87% 4 British Columbia 4,113,487 3,907,738 205,749 5.3 13.01% 5 Manitoba 1,148,401 1,119,583 28,818 2.6 3.63% 6 Nova Scotia 913,462 908,007 5,455 0.6 2.89% 7 Northwest Territories 41,464 37,360 4,104 11.0 0.13% 8 Nunavut 29,474 26,745 2,729 10.2 0.09% 9 Yukon 30,372 28,674 1,698 5.9 0.09% 10 Prince Edward Island 135,851 135,294 557 0.4 0.43% 11 New Brunswick 729,997 729,498 499 0.1 2.31% 12 Newfoundland and Labrador 505,469 512,930 -7,461 -1.5 1.60% 13 Saskatchewan 968,157 978,933 -10,776 -1.1 2.96% Total Canada 31,612,897 30,007,094 1,605,893 5.4 100.00% Derived from: Statistics Canada - (table) Population and Dwelling Counts, for Canada, Provinces and Territories, 2006 and 2001 Censuses - 100% Data
Last modified (by source): N/A
Compiled/added to Wikipedia: 2007-07-22Vital statistics
Birth rate: 10.28 births/1,000 population (2009 est.)
Death rate: 7.74 deaths/1,000 population (2009 est.)
Net migration rate: 5.63 migrant(s)/1,000 population (2009 est.)
Sex ratio:
- at birth: 1.06 male(s)/female
- under 15 years: 1.05 male(s)/female
- 15 - 64 years: 1.02 male(s)/female
- 65 years and over: 0.78 male(s)/female
- total population: 0.99 male(s)/female (2009 est.)
Infant mortality rate: 5.04 deaths/1,000 live births (2009 est.)
- total population: 81.23 years
- male: 78.69 years
- female: 83.91 years (2009 est.)
Age structure[6]
- 0-14 years: 16.1% (male 2,761,711/female 2,626,836)
- 15-64 years: 68.7% (male 11,633,950/female 11,381,735)
- 65 years and over: 15.2% (male 2,220,189/female 2,862,787) (2010 est.)
Total fertility rate: 1.58 children born/woman (2009 est.)[7]
Population projection
US Census Bureau, 2010 est. [1] :
- 2020: 36,387,000
- 2030: 38,565,000
- 2040: 40,070,000
- 2050: 41,136,000
United Nations, 2010 est. [2] :
- 2020: 37,163,000
- 2030: 39,850,000
- 2040: 41,882,000
- 2050: 43,642,000
- 2060: 45,101,000
- 2070: 46,271,000
- 2080: 47,206,000
- 2090: 47,906,000
- 2100: 48,290,000
Ethnicity
Nationality:
- noun: Canadian(s)
- adjective: Canadian
Ethnic origin
Main article: Ethnic origins of people in CanadaCanadians were able to self-identify one or more ethnic origins in the 2006 census. Percentages may therefore add up to 100%. The most common response was 'Canadian'. As data is completely self-reported, and reporting individuals may have varying definitions of "Ethnic origin" (or may not know their ethnic origin), these figures should not be considered an exact record of the relative prevalence of different ethnocultural ancestries.
Statistics Canada projects that, by 2031, approximately 28% of the population will be foreign-born. The number of people belonging to visible minority groups will double,[8] and make up the majority of the population in Toronto and Vancouver.
Single responses: 18.40% of respondents gave a single response of 'Canadian', while a further 13.82% identified with both 'Canadian', and one or more other ancestries. 4.38% of respondents gave a single response of English, 3.94% gave a single response of French, 3.63% gave a single response of Chinese, 2.50% gave a single response of East Indian, 2.37% gave a single response of Italian, 2.15% gave a single response of German, 1.82% gave a single response of Scottish, 1.64% gave a single response of North American Indian, 1.57% gave a single response of Irish, and 1.03% gave a single response of Filipino.
Multiple responses: Counting both single and multiple responses, the most commonly identified ethnic origins were (2006):
Ethnic origin[Note 2] % Population Area of largest proportion Canadian 32.22% 10,066,290 Quebec (66.2%) English 21.03% 6,570,015 Newfoundland and Labrador (43.2%) French 15.82% 4,941,210 Quebec (28.9%) Scottish 15.11% 4,719,850 Prince Edward Island (40.5%) Irish 13.94% 4,354,155 Prince Edward Island (29.2%) German 10.18% 3,179,425 Saskatchewan (30.0%) Italian 4.63% 1,445,335 Ontario (7.2%) Chinese 4.31% 1,346,510 British Columbia (10.6%) North American Indian 4.01% 1,253,615 Northwest Territories (36.5%) Ukrainian 3.87% 1,209,085 Manitoba (14.8%) Dutch (Netherlands) 3.32% 1,035,965 Alberta (5.3%) Polish 3.15% 984,565 Manitoba (7.3%) East Indian 3.08% 962,665 British Columbia (5.7%) Russian 1.60% 500,600 Manitoba (4.3%) Welsh 1.41% 440,965 Yukon (3.1%) Filipino 1.40% 436,190 Manitoba (3.5%) Norwegian 1.38% 432,515 Saskatchewan (7.2%) Portuguese 1.32% 410,850 Ontario (2.4%) Métis 1.31% 409,065 Northwest Territories (6.9%) British, not included elsewhere 1.29% 403,915 Yukon (2.3%) Swedish 1.07% 334,765 Saskatchewan (3.5%) Spanish 1.04% 325,730 British Columbia (1.3%) American 1.01% 316,350 Yukon (2.0%) Hungarian (Magyar) 1.01% 315,510 Saskatchewan (2.9%) Jewish 1.01% 315,120 Ontario (1.5%) Data from the same subject matter, though from 2001, is also grouped more geographically by Statistics Canada as follows:[9]
2001 % North American (non-aboriginal) 40.21% British Isles 33.64% French 15.89% Western European 12.78% Eastern European 8.50% Southern European 7.87% 2001 % East and Southeast Asian 6.03% Aboriginal 4.45% South Asian 3.25% Northern European 3.22% Caribbean 1.70% Other European 1.28% 2001 % Arab 1.17% African 0.99% Latin, Central and
South American0.82% West Asian 0.69% Oceania 0.16% Percentages are calculated as a proportion of the total number of respondents (31,241,030 in 2006) and total more than 100% due to dual responses.
All ethnocultural ancestries with responses totalling to more than 1% of the total number of responses are listed in the table above according to the exact terminology used by Statistics Canada.[10][11]Visible minorities
For a definition see visible minority.
Year 1996[12] 1996% 2001[13] 2001% 2006[14] 2006% South Asian 670,590 2.35% 917,070 3.09% 1,233,275 4.00% Chinese 860,150 3.02% 1,029,395 3.47% 1,168,485 3.70% Black 573,860 2.01% 662,215 2.23% 783,795 2.50% Filipino 234,195 0.82% 308,575 1.04% 389,550 1.30% Latin American 176,970 0.62% 304,245 1.00% Arab 265,550 0.90% Southeast Asian 172,765 0.61% 231,425 0.70% West Asian 156,700 0.50% Korean 64,835 0.23% 138,425 0.40% Japanese 68,135 0.24% 98,900 0.32% Multiple visible minorities 61,575 0.22% 104,215 0.30% Visible minority, n.i.e. 69,745 0.24% 71,420 0.20% Total visible minority population 3,197,480 11.21% 3,983,845 13.44% 5,068,095 16.20% Non-Visible Minority Population 25,330,645 88.79% 25,655,185 86.56% 26,172,935 83.78% Total Population 28,528,125 100.00% 29,639,030 100.00% 31,241,030 100.00% Aboriginal status
The 2006 census counted a total Canadian Aboriginal population of 1,172,790 (3.75%) which includes 698,025 First Nations (2.23%), 389,785 Métis (1.25%), and 50,480 Inuit (0.16%). Percentages are calculated as a proportion of the total number of respondents (31,241,030)[15]
Province/Territory Number %
provincial[16]%
national[16]Indian
,(First Nations)Métis Inuit Multiple [16] Other[16] British Columbia 196,075 4.8% 16.7% 129,575 59,445 795 1,655 4,605 Alberta 188,365 5.8% 16.1% 97,280 85,495 1,605 1,220 2,760 Saskatchewan 141,890 14.9% 12.1% 91,400 48,115 220 625 1,530 Manitoba 175,395 15.5% 15.0% 100,645 71,805 565 680 1,695 Ontario 242,495 2.0% 20.7% 158,400 73,610 2,040 1,910 6,540 Quebec 108,430 1.5% 9.2% 65,085 27,980 10,950 955 3,450 New Brunswick 17,655 2.5% 1.5% 12,385 4,270 185 100 710 Nova Scotia 24,175 2.7% 2.1% 15,240 7,680 320 100 830 Prince Edward Island 1,730 1.3% 0.1% 1,230 385 30 10 75 Newfoundland and Labrador 23,450 4.7% 2.0% 7,765 6,470 4,715 290 4,205 Yukon 7,580 25.1% 0.6% 6,275 800 255 50 190 Northwest Territories 20,635 50.3% 1.8% 12,640 3,580 4,160 105 145 Nunavut 24,915 85.0% 2.1% 100 125 24,640 30 20 Canada 1,172,790 3.8% 100.0% 698,025 389,785 50,480 7,740 26,760 Sources: 2006 Census[17][18][19] Religions
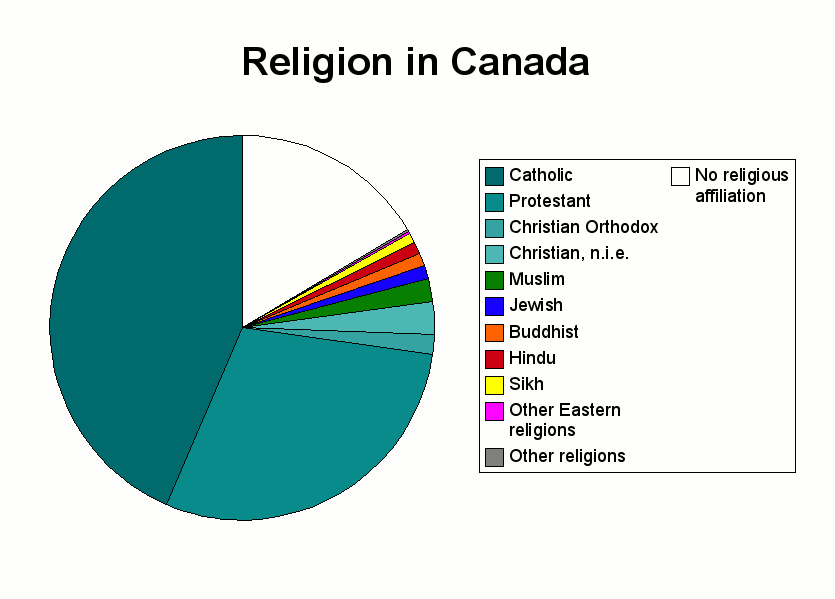
See also: Religion in Canada Top self-identified religious affiliations in Canada in 2001.
Top Self-Identified Religious Affiliations in Canada[20][21][22] 1991
number1991
%2001
number2001
%% change
(in numbers)Christian 22,468,260 83 22,799,645 77 -1.5 - Catholic 12,335,255 45.7 12,936,905 43.6 +4.8 - Protestant 9,427,675 34.9 8,654,850 29.2 -8.2 - United Church of Canada 3,093,120 11.3 2,839,125 9.5 -8.2 - Anglican Church of Canada 2,188,110 8.0 2,035,495 6.8 -7.0 - Lutheran 636,205 2.3 606,590 2.0 -4.7 - Presbyterian 636,295 2.3 409,830 1.4 -35.6 - Pentecostal 436,435 1.6 369,475 1.2 -15.3 - Mennonite 207,970 0.8 191,465 0.6 -7.9 - Jehovah's Witnesses 168,375 0.6 154,745 0.5 -8.1 - Methodist 83,910 0.3 106,545 0.4 +27.0 - Mormon 100,770 0.4 104,750 0.3 +3.9 - Salvation Army 112,345 0.4 87,785 0.3 -21.9 - Christian Reformed Church in North America 84,685 0.3 76,665 0.3 -9.5 - Christian and Missionary Alliance 59,365 0.2 66,280 0.2 +11.9 - Adventists 52,365 0.2 62,875 0.2 +20.1 - Christian Orthodox 387,395 1.4 479,620 1.6 +23.8 - Greek Orthodox 231,965 0.9 215,200 0.7 -7.1 - Christian, not included elsewhere¹ 353,040 1.3 780,450 2.6 +121.1 Other 1,148,060 4.3 1,988,635 6.7 +73.2 - Jewish 318,185 1.2 329,995 1.1 +3.7 - Muslim 253,265 0.9 579,640 2.0 +128.9 - Buddhist 163,415 0.6 300,345 1.0 +83.8 - Hindu 157,015 0.6 297,200 1.0 +89.3 - Sikh 147,440 0.5 278,410 0.9 +88.8 No religion 3,397,000 12.6 4,900,095 16.5 +44.2 ¹ Includes persons who report only "Christian", only "Protestant", and those in denominations less than 60,000
* For comparability purposes, 1991 data are presented according to 2001 boundaries.Note(s):
- Catholic includes Roman Catholic, Eastern Catholic, Polish National Catholic Church, and Old Catholic
- Other Religions also includes Bahá'í Faith, Eckankar, Jainism, Shinto, Taoism, Zoroastrianism, Aboriginal belief systems, Neo-Paganism, Wicca, Unity - New Thought - Pantheist, Scientology, Rastafari movement, New Age, Gnostic, Satanism, et cetera
- No Religion includes Atheism, Agnosticism, Humanism, et cetera
However, a more recent research in 2005 indicates that the non-religious group has risen significantly. Phil Zuckerman, an Associate Professor of Sociology at Pitzer College writes of several academic sources who have in recent years placed atheism rates in Canada between 19% and 30%.[23]
Languages
Main article: Languages of CanadaLanguage used most often at work:[24]
Languages by mother tongue:[24]
Languages by language used most often at home:[25]
Literacy
- definition: age 15 and over can read and write
The literacy rate of Canada was 99% in 2003.[26]
Education expenditures
- 5.2% of total GDP (2002)
City populations
- As of 2006, Canada's 13 largest cities (metro areas) have a combined population of 17,885,000
- Canada has 100 cities with 45,000 inhabitants or more for a combined population of 20,687,000
- Canada has 230 cities with 15,000 inhabitants or more
See also
- 1666 census of New France
- Canada 1911 Census
- Canada 1996 Census
- Canada 2001 Census
- Canada 2006 Census
- Places in Canada with notable demographic characteristics
- Cahiers québécois de démographie academic journal

Canada portal 
History of Canada portal Notes
- ^ The population count appearing may differ from the official estimates and projections released by Statistics Canada. Data displayed is as a rough estimate of the current Canadian population. Source: "Canada's population clock". http://www.statcan.gc.ca/ig-gi/pop-ca-eng.htm.
- ^ Data for ethnic origin was collected by self-declaration, labels may not necessarily describe the true ancestry of respondents. Many respondents also acknowledged multiple ancestries. Source: "Ethnocultural Portrait of Canada - Data table". Statistics Canada. http://www12.statcan.ca/census-recensement/2006/dp-pd/hlt/97-562/pages/page.cfm?Lang=E&Geo=PR&Code=01&Data=Count&Table=2&StartRec=1&Sort=3&Display=All&CSDFilter=5000. Additional data: "2006 Census release topics". http://www12.statcan.gc.ca/census-recensement/2006/rt-td/index-eng.cfm.
References
- ^ "Estimated population of Canada, 1605 to present". Statistics Canada. 2009. http://www.statcan.gc.ca/pub/98-187-x/4151287-eng.htm. Retrieved 2011-05-23.
- ^ Statistics Canada (2009). "Population Estimates (October 2009)". http://www.statcan.gc.ca/daily-quotidien/091223/t091223b2-eng.htm. Retrieved 2009-09-25.
- ^ Statistics Canada (2005). "Land and freshwater area, by province and territory (2005)". http://www40.statcan.ca/l01/cst01/phys01.htm?sdi=area. Retrieved 2007-07-22.
- ^ Statistics Canada (2006). "Age Groups and Sex for Population of Canada (2006 Census)". http://www12.statcan.ca/english/census06/data/topics/RetrieveProductTable.cfm?Temporal=2006&APATH=3&PID=88984&THEME=66&PTYPE=88971&VID=0&GK=NA&GC=99&FL=0&RL=0&FREE=0&METH=0&S=1. Retrieved 2007-07-22.
- ^ CO2 Emissions from Fuel Combustion Population 1971-2008 (pdf pages 83-85) IEA (OECD/ World Bank) original population ref e.g. in IEA Key World Energy Statistics 2010 page 57)
- ^ "Canada Age structure". IndexMundi. 2010. http://www.indexmundi.com/canada/age_structure.html. Retrieved 2010-07-03.
- ^ "CIA - The World Factbook - Canada". Cia.gov. https://www.cia.gov/library/publications/the-world-factbook/geos/ca.html. Retrieved 2011-01-01.
- ^ "Parties prepare to battle for Immigrant votes". CTV.ca. 2010-03-14. http://www.ctv.ca/servlet/ArticleNews/story/CTVNews/20100314/Minority_Report_100314/20100314?hub=Canada. Retrieved 2010-03-15.
- ^ "Ethnocultural Portrait of Canada Highlight Tables, 2006 Census". 2.statcan.ca. 2010-10-06. http://www12.statcan.ca/english/census06/data/highlights/ethnic/pages/Page.cfm?Lang=E&Geo=PR&Code=01&Data=Count&Table=2&StartRec=1&Sort=3&Display=All&CSDFilter=5000. Retrieved 2011-01-01.
- ^ "Ethnic Origin (232), Sex (3) and Single and Multiple Responses (3) (2001 Census)". 2.statcan.ca. 2010-03-09. http://www12.statcan.ca/english/census01/products/standard/themes/RetrieveProductTable.cfm?Temporal=2001&PID=62911&APATH=3&METH=1&PTYPE=55440&THEME=44&FOCUS=0&AID=0&PLACENAME=0&PROVINCE=0&SEARCH=0&GC=99&GK=NA&VID=0&VNAMEE=&VNAMEF=&FL=0&RL=0&FREE=0&GID=431515. Retrieved 2011-01-01.
- ^ "Ethnocultural Portrait of Canada - Data table". 2.statcan.ca. 2010-10-06. http://www12.statcan.ca/census-recensement/2006/dp-pd/hlt/97-562/pages/page.cfm?Lang=E&Geo=PR&Code=01&Table=2&Data=Count&StartRec=1&Sort=3&Display=All. Retrieved 2011-01-01.
- ^ "Total Population by Visible Minority Population(1), for Canada, Provinces and Territories, 1996 Census". Statcan.gc.ca. 2008-11-16. http://www.statcan.gc.ca/c1996-r1996/feb17-17fev/vm-mv-can-eng.htm. Retrieved 2011-01-01.
- ^ "Ethnocultural Portrait of Canada". 2.statcan.ca. http://www12.statcan.ca/english/census01/products/highlight/Ethnicity/Page.cfm?Lang=E&Geo=PR&Code=0&View=1&Table=1&StartRec=1&Sort=2&B1=Counts. Retrieved 2011-01-01.
- ^ "Visible Minority Groups". Statistics Canada. 2010. http://www12.statcan.gc.ca/census-recensement/2006/dp-pd/tbt/Rp-eng.cfm?LANG=E&APATH=3&DETAIL=0&DIM=0&FL=A&FREE=0&GC=0&GID=0&GK=0&GRP=1&PID=92338&PRID=0&PTYPE=88971,97154&S=0&SHOWALL=0&SUB=802&Temporal=2006&THEME=80&VID=0&VNAMEE=&VNAMEF=. Retrieved 2011-02-03.
- ^ Aboriginal Identity (2006 Census). Retrieved 2009-10-14.
- ^ a b c d "Aboriginal identity population by age groups, median age and sex, 2006 counts for both sexes, for Canada, provinces and territories - 20% sample data". Statistics Canada. 2010. http://www12.statcan.ca/census-recensement/2006/dp-pd/hlt/97-558/pages/page.cfm?Lang=E&Geo=PR&Code=01&Table=1&Data=Count&Sex=1&Age=1&StartRec=1&Sort=2&Display=Page. Retrieved 2010-02-03.
- ^ Aboriginal Identity (8), Sex (3) and Age Groups (12) for the Population of Canada, Provinces, Territories, Census Metropolitan Areas and Census Agglomerations, 2006 Census-20% Sample Data Click to view table notes, BC, AB, SK, MB, ON, QC, NB, NS, PE, NL, YT, NT, NU. Retrieved 2009-10-05.
- ^ Number and percentage of population reporting Aboriginal identity, Canada, provinces and territories, 2006. Retrieved 2009-10-05.
- ^ Percentage of Aboriginal people in the population, Canada, provinces and territories, 2006 . Retrieved 2009-10-14.
- ^ Statistics Canada (2001). "Religions in Canada". http://www12.statcan.ca/english/census01/Products/Analytic/companion/rel/contents.cfm. Retrieved 2007-02-16.
- ^ Statistics Canada (1991). "Religion , Age Groups and Sex for Population of Canada". http://www12.statcan.ca/english/census01/products/standard/themes/RetrieveProductTable.cfm?Temporal=2001&PID=55822&GID=431515&METH=1&APATH=3&PTYPE=55440&THEME=56&AID=0&FREE=0&FOCUS=0&VID=0&GC=0&GK=0&SC=1&SR=1&RL=0&CPP=99&RPP=9999&D1=1&D2=1&D3=0&D4=0&D5=0&D6=0&d1=1&d2=0. Retrieved 2007-02-16.
- ^ Statistics Canada (2001). "Population by religion, by province and territory (2001 Census)". http://www40.statcan.ca/l01/cst01/demo30c.htm. Retrieved 2007-02-16.
- ^ Zuckerman, Phil (2006). "Atheism—Contemporary numbers and Practices". In Michael Martin. The Cambridge Companion to Atheism. Cambridge University Press -. pp. 47–50. ISBN 0521842700. http://books.google.com/books?id=tAeFipOVx4MC&pg=PA47&dq=%22cambridge+companion+to+atheism%22&psp=1#PPA47,M1. Retrieved 2007-11-15.
- ^ a b Statistics Canada - Language used at work1 by frequency of language used at work and mother tongue, 2006 counts[dead link]
- ^ The percentage figures cited are the top languages spoken as a home language in Canada, shown as a percentage of total single responses. Source: Statistics Canada, 2006 Census Profile of Federal Electoral Districts (2003 Representation Order): Language, Mobility and Migration and Immigration and Citizenship. Ottawa, 2007, pp. 6-10. Data available online at: "Detailed Language Spoken Most Often at Home". 2006 Census of Canada: Topic-based tabulations. Statistics Canada. April 8, 2008. http://www12.statcan.gc.ca/census-recensement/2006/dp-pd/tbt/Rp-eng.cfm?TABID=0&LANG=E&A=R&APATH=3&DETAIL=0&DIM=0&FL=A&FREE=0&GC=01&GID=837928&GK=1&GRP=1&O=D&PID=94817&PRID=0&PTYPE=88971,97154&S=0&SHOWALL=0&SUB=702&Temporal=2006&THEME=70&VID=0&VNAMEE=&VNAMEF=&D1=0&D2=0&D3=0&D4=0&D5=0&D6=0. Retrieved January 15, 2010.
- ^ Gordon, Elaine H.; Gordon, Edward E. (2003). Literacy in America: historic journey and contemporary solutions. New York: Praeger. pp. 255. ISBN 0-275-97864-8.
Further reading
Main article: Bibliography of Canada- Bumsted, J. M (2003). Canada's diverse peoples: a reference sourcebook. Library of Congress ( ABC-CLIO). ISBN 1576076725. http://books.google.ca/books?id=Pb5AvfpCZZkC&lpg=PA42&dq=The%20people%20of%20Canada&pg=PP1#v=onepage&q&f=true.
- Magocsi, Paul R (1999). Encyclopedia of Canada's peoples. Society of Ontario, University of Toronto Press. ISBN 0802029388. http://books.google.ca/books?id=dbUuX0mnvQMC&lpg=PA582&dq=Territorial%20evolution%20of%20Canada&pg=PP1#v=onepage&q&f=true.
- Richard, Madeline (1992). Ethnic history and marital assimilation in Canada, 1871 and 1971. University of British Columbia Press. ISBN 0774804319. http://books.google.ca/books?id=y00ho38YLGMC&lpg=PA164&dq=Ethnic%20origins%20of%20people%20in%20Canada&pg=PP1#v=onepage&q&f=true.
- Thornton, Russell (2000). Michael R. Haines, Richard Hall Steckel. ed. A population history of North America. Cambridge: Cambridge University Press. ISBN 0521496667. http://books.google.ca/books?id=BPdgiysIVcgC&lpg=PP1&dq=A%20population%20history%20of%20North%20America&pg=PA13#v=onepage&q&f=true.
- Wilson, Donna M; Northcott, Herbert C (2008). Dying and Death in Canada. Toronto: University of Toronto Press. ISBN 9781551118734. http://books.google.com/books?id=p_pMVs53mzQC&lpg=PA25&pg=PP1#v=onepage&q&f=true.
- Roderic Beaujot and Don Kerr, (2007) The Changing Face of Canada: Essential Readings in Population, Canadian Scholars' Press, ISBN 978-1-55130-322-2.
External links
- Canada Year Book (2010) - Statistics Canada
- Population estimates and projections, 2010 - 2036 - Statistics Canada
Categories:

Wikimedia Foundation. 2010.