- Demography
-
Sociology 
Portal Theory · History Research methods Topics · Subfields Cities · Class · Crime · Culture
Deviance · Demography · Education
Economy · Environment · Family
Gender · Health · Industry · Internet
Knowledge · Law · Medicine
Politics · Mobility · Race and ethnicity
Rationalization · Religion · Science
Secularization · Social networks
Social psychology · StratificationCategories · Lists Journals · Sociologists
Article index · OutlineDemography is the statistical study of human population. It can be a very general science that can be applied to any kind of dynamic human population, that is, one that changes over time or space (see population dynamics). It encompasses the study of the size, structure and distribution of these populations, and spatial and/or temporal changes in them in response to birth, migration, aging and death.
Demographic analysis can be applied to whole societies or to groups defined by criteria such as education, nationality, religion and ethnicity. Institutionally, demography is usually considered a field of sociology, though there are a number of independent demography departments.[1] Formal demography limits its object of study to the measurement of populations processes, while the more broad field of social demography population studies also analyze the relationships between economic, social, cultural and biological processes influencing a population.[2]
The term demographics refers to characteristics of a population.
Contents
Data and methods
There are two methods of data collection: direct and indirect. Direct data come from vital statistics registries that track all births and deaths as well as certain changes in legal status such as marriage, divorce, and migration (registration of place of residence). In developed countries with good registration systems (such as the United States and much of Europe), registry statistics are the best method for estimating the number of births and deaths.
A census is the other common direct method of collecting demographic data. A census is usually conducted by a national government and attempts to enumerate every person in a country. However, in contrast to vital statistics data, which are typically collected continuously and summarized on an annual basis, censuses typically occur only every 10 years or so, and thus are not usually the best source of data on births and deaths. Analyses are conducted after a census to estimate how much over or undercounting took place.
Censuses do more than just count people. They typically collect information about families or households, as well as about such individual characteristics as age, sex, marital status, literacy/education, employment status and occupation, and geographical location. They may also collect data on migration (or place of birth or of previous residence), language, religion, nationality (or ethnicity or race), and citizenship. In countries in which the vital registration system may be incomplete, the censuses are also used as a direct source of information about fertility and mortality; for example the censuses of the People's Republic of China gather information on births and deaths that occurred in the 18 months immediately preceding the census.
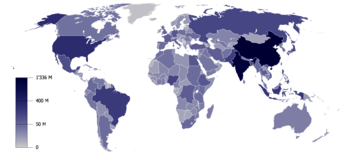 Map of countries by population
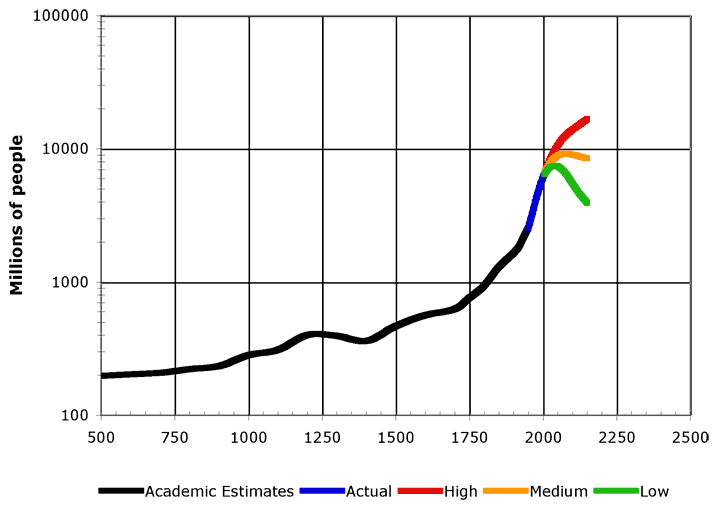
 Rate of human population growth showing projections for later this century.
Indirect methods of collecting data are required in countries where full data are not available, such as is the case in much of the developing world. One of these techniques is the sister method, where survey researchers ask women how many of their sisters have died or had children and at what age. With these surveys, researchers can then indirectly estimate birth or death rates for the entire population. Other indirect methods include asking people about siblings, parents, and children.
There are a variety of demographic methods for modeling population processes. They include models of mortality (including the life table, Gompertz models, hazards models, Cox proportional hazards models, multiple decrement life tables, Brass relational logits), fertility (Hernes model, Coale-Trussell models, parity progression ratios), marriage (Singulate Mean at Marriage, Page model), disability (Sullivan's method, multistate life tables), population projections (Lee Carter, the Leslie Matrix), and population momentum (Keyfitz).
- The crude birth rate, the annual number of live births per 1,000 people.
- The general fertility rate, the annual number of live births per 1,000 women of childbearing age (often taken to be from 15 to 49 years old, but sometimes from 15 to 44).
- age-specific fertility rates, the annual number of live births per 1,000 women in particular age groups (usually age 15-19, 20-24 etc.)
- The crude death rate, the annual number of deaths per 1,000 people.
- The infant mortality rate, the annual number of deaths of children less than 1 year old per 1,000 live births.
- The expectation of life (or life expectancy), the number of years which an individual at a given age could expect to live at present mortality levels.
- The total fertility rate, the number of live births per woman completing her reproductive life, if her childbearing at each age reflected current age-specific fertility rates.
- The replacement level fertility, the average number of children a woman must have in order to replace herself with a daughter in the next generation. For example the replacement level fertility in the US is 2.11. This means that 100 women will bear 211 children, 103 of which will be females. About 3% of the alive female infants are expected to decease before they bear children, thus producing 100 women in the next generation.[3]
- The gross reproduction rate, the number of daughters who would be born to a woman completing her reproductive life at current age-specific fertility rates.
- The net reproduction ratio is the expected number of daughters, per newborn prospective mother, who may or may not survive to and through the ages of childbearing.
- A stable population, one that has had constant crude birth and death rates for such long time that the percentage of people in every age class remains constant, or equivalently, the population pyramid has an unchanging structure.[3]
- A stationary population, one that is both stable and unchanging in size (the difference between crude birth rate and crude death rate is zero).[3]
A stable population does not necessarily remain fixed in size, it can be expanding or shrinking.[3]
Note that the crude death rate as defined above and applied to a whole population can give a misleading impression. For example, the number of deaths per 1,000 people can be higher for developed nations than in less-developed countries, despite standards of health being better in developed countries. This is because developed countries have proportionally more older people, who are more likely to die in a given year, so that the overall mortality rate can be higher even if the mortality rate at any given age is lower. A more complete picture of mortality is given by a life table which summarises mortality separately at each age. A life table is necessary to give a good estimate of life expectancy.
The fertility rates can also give a misleading impression that a population is growing faster than it in fact is, because measurement of fertility rates only involves the reproductive rate of women, and does not adjust for the sex ratio. For example, if a population has a total fertility rate of 4.0 but the sex ratio is 66/34 (twice as many men as women), this population is actually growing at a slower natural increase rate than would a population having a fertility rate of 3.0 and a sex ratio of 50/50. This distortion is greatest in India and Myanmar, and is present in China as well.
Basic equation
Suppose that a country (or other entity) contains Populationt persons at time t. What is the size of the population at time t + 1 ?
- Populationt + 1 = Populationt + Naturalincreaset + Netmigrationt
Natural increase from time t to t + 1:
- Naturalincreaset = Birthst − Deathst
Net migration from time t to t + 1:
- Netmigrationt = Immigrationt − Emigrationt
This basic equation can also be applied to subpopulations. For example, the population size of ethnic groups or nationalities within a given society or country is subject to the same sources of change. However, when dealing with ethnic groups, "net migration" might have to be subdivided into physical migration and ethnic reidentification (assimilation). Individuals who change their ethnic self-labels or whose ethnic classification in government statistics changes over time may be thought of as migrating or moving from one population subcategory to another.[4]
More generally, while the basic demographic equation holds true by definition, in practice the recording and counting of events (births, deaths, immigration, emigration) and the enumeration of the total population size are subject to error. So allowance needs to be made for error in the underlying statistics when any accounting of population size or change is made.
History
Demographic thoughts can be traced back to antiquity, and are present in many civilisations and cultures, like Ancient Greece, Rome, India and China.[5] In ancient Greece, this can be found in the writings of Herodotus, Thucidides, Hippocrates, Epicurus, Protagoras, Polus, Plato and Aristotle.[5] In Rome, writers and philosophers like Cicero, Seneca[disambiguation needed
 ], Pliny the elder, Marcus Aurelius, Epictetus, Cato and Collumella also expressed important ideas on this ground.[5]
In the Middle ages, Christian thinkers devoted much time in refuting the Classical ideas on demography. Important contributors to the field were William of Conches,[6] Bartholomew of Lucca,[6] William of Auvergne,[6] William of Pagula,[6] and Ibn Khaldun.[7]
The Natural and Political Observations ... upon the Bills of Mortality (1662) of John Graunt contains a primitive form of life table. Mathematicians, such as Edmond Halley, developed the life table as the basis for life insurance mathematics. Richard Price was credited with the first textbook on life contingencies published in 1771,[8] followed later by Augustus de Morgan, ‘On the Application of Probabilities to Life Contingencies’ (1838).[9]
At the end of the 18th century, Thomas Malthus concluded that, if unchecked, populations would be subject to exponential growth. He feared that population growth would tend to outstrip growth in food production, leading to ever-increasing famine and poverty (see Malthusian catastrophe). He is seen as the intellectual father of ideas of overpopulation and the limits to growth. Later, more sophisticated and realistic models were presented by Benjamin Gompertz and Verhulst.
The period 1860-1910 can be characterized as a period of transition wherein demography emerged from statistics as a separate field of interest. This period included a panoply of international ‘great demographers’ like Adolphe Quételet (1796–1874), William Farr (1807–1883), Louis-Adolphe Bertillon (1821–1883) and his son Jacques (1851–1922), Joseph Körösi (1844–1906), Anders Nicolas Kaier (1838–1919), Richard Böckh (1824–1907), Wilhelm Lexis (1837–1914) and Luigi Bodio (1840–1920) contributed to the development of demography and to the toolkit of methods and techniques of demographic analysis.[10]
Transition
Main article: Demographic transitionContrary to Malthus' predictions and in line with his thoughts on moral restraint, natural population growth in most developed countries has diminished to close to zero, without being held in check by famine or lack of resources, as people in developed nations have shown a tendency to have fewer children. The fall in population growth has occurred despite large rises in life expectancy in these countries. This pattern of population growth, with slow (or no) growth in pre-industrial societies, followed by fast growth as the society develops and industrializes, followed by slow growth again as it becomes more affluent, is known as the demographic transition.
Similar trends are now becoming visible in ever more developing countries, so that far from spiraling out of control, world population growth is expected to slow markedly in this century, coming to an eventual standstill or even declining. The change is likely to be accompanied by major shifts in the proportion of world population in particular regions. The United Nations Population Division expects the absolute number of infants and toddlers in the world to begin to fall by 2015, and the number of children under 15 by 2025.[11]
The figure in this section shows the latest (2004) UN projections of world population out to the year 2150 (red = high, orange = medium, green = low). The UN "medium" projection shows world population reaching an approximate equilibrium at 9 billion by 2075. Working independently, demographers at the International Institute for Applied Systems Analysis in Austria expect world population to peak at 9 billion by 2070.[13] Throughout the 21st century, the average age of the population is likely to continue to rise.
Science of population
Populations can change through three processes: fertility, mortality, and migration. Fertility involves the number of children that women have and is to be contrasted with fecundity (a woman's childbearing potential).[14] Mortality is the study of the causes, consequences, and measurement of processes affecting death to members of the population. Demographers most commonly study mortality using the Life Table, a statistical device which provides information about the mortality conditions (most notably the life expectancy) in the population.[15]
Migration refers to the movement of persons from an origin place to a destination place across some pre-defined, political boundary. Migration researchers do not designate movements 'migrations' unless they are somewhat permanent. Thus demographers do not consider tourists and travelers to be migrating. While demographers who study migration typically do so through census data on place of residence, indirect sources of data including tax forms and labor force surveys are also important.[16]
Demography is today widely taught in many universities across the world, attracting students with initial training in social sciences, statistics or health studies. Being at the crossroads of several disciplines such as sociology, economics, epidemiology, geography, anthropology and history, demography offers tools to approach a large range of population issues by combining a more technical quantitative approach that represents the core of the discipline with many other methods borrowed from social or other sciences. Demographic research is conducted in universities, in research institutes as well as in statistical departments and in several international agencies. Population institutions are part of the Cicred (International Committee for Coordination of Demographic Research) network while most individual scientists engaged in demographic research are members of the International Union for the Scientific Study of Population,[17] or a national association such as the Population Association of America in the United States,[18] or affiliates of the Federation of Canadian Demographers in Canada.[19]
See also
Notes
- ^ UC Berkeley Demography department website. http://demog.berkeley.edu/department/index.shtml
- ^ Andrew Hinde Demographic Methods Ch. 1 ISBN 0-340-71892-7
- ^ a b c d Introduction to environmental engineering and science by Masters and Ela, 2008, Pearson Education, chapter 3
- ^ See, for example, Barbara A. Anderson and Brian D. Silver, "Estimating Russification of Ethnic Identity Among Non-Russians in the USSR," Demography, Vol. 20, No. 4 (Nov., 1983): 461-489.
- ^ a b c S.C.Srivastava,Studies in Demography,p.39-41
- ^ a b c d Peter Biller,The measure of multitude: Population in medieval thought[1].
- ^ See, e.g., Andrey Korotayev, Artemy Malkov, & Daria Khaltourina (2006). Introduction to Social Macrodynamics: Compact Macromodels of the World System Growth. Moscow: URSS, ISBN 5-484-00414-4.
- ^ “Our Yesterdays: the History of the Actuarial Profession in North America, 1809-1979,” by E.J. (Jack) Moorhead, FSA, ( 1/23/10 – 2/21/04), published by the Society of Actuaries as part of the profession’s centennial celebration in 1989.
- ^ The History of Insurance, Vol 3, Edited by David Jenkins and Takau Yoneyama (1 85196 527 0): 8 Volume Set: ( 2000) Availability: Japan: Kinokuniya).
- ^ de Gans, Henk and Frans van Poppel (2000) Contributions from the margins. Dutch statisticians, actuaries and medical doctors and the methods of demography in the time of Wilhelm Lexis. Workshop on ‘Lexis in Context: German and Eastern& Northern European Contributions to Demography 1860-1910’ at the Max Planck Institute for Demographic Research, Rostock , August 28 and 29, 2000.
- ^ a b United Nations (2004). "World Population to 2300" (PDF). New York: United Nations. http://www.un.org/esa/population/publications/longrange2/WorldPop2300final.pdf. Retrieved 2008-11-13.
- ^ US Census Bureau. "Historical Estimates of World Population". U.S. Census Bureau, Population Division. http://www.census.gov/ipc/www/worldhis.html. Retrieved 2008-11-13.
- ^ Lutz, Wolfgang; Sanderson, Warren; Scherbov, Sergei (1997-06-19). "Doubling of world population unlikely" (PDF). Nature 387 (6635): 803–805. doi:10.1038/42935. PMID 9194559. http://ace1.ma.utexas.edu/users/davis/375/reading/worldbirthrate.pdf. Retrieved 2008-11-13.
- ^ John Bongaarts. The Fertility-Inhibiting Effects of the Intermediate Fertility Variables. Studies in Family Planning, Vol. 13, No. 6/7. (Jun. - Jul., 1982), pp. 179-189.
- ^ N C H S - Life Tables
- ^ Donald T. Rowland Demographic Methods and Concepts Ch. 11 ISBN 0-19-875263-6
- ^ International Union for the Scientific Study of Population
- ^ Population Association of America
- ^ Canadian Population Society
Further reading
- Glad, John. 2008. Future Human Evolution: Eugenics in the Twenty-First Century. Hermitage Publishers, ISBN 1-55779-154-6
- Gavrilova N.S., Gavrilov L.A. 2011. Ageing and Longevity: Mortality Laws and Mortality Forecasts for Ageing Populations [In Czech: Stárnutí a dlouhověkost: Zákony a prognózy úmrtnosti pro stárnoucí populace]. Demografie, 53(2): 109-128.
- Preston, Samuel, Patrick Heuveline, and Michel Guillot. 2000. Demography: Measuring and Modeling Population Processes. Blackwell Publishing.
- Gavrilov L.A., Gavrilova N.S. 2010. Demographic Consequences of Defeating Aging. Rejuvenation Research, 13(2-3): 329-334.
- Paul R. Ehrlich (1968), The Population Bomb Controversial Neo-Malthusianist pamphlet
- Leonid A. Gavrilov & Natalia S. Gavrilova (1991), The Biology of Life Span: A Quantitative Approach. New York: Harwood Academic Publisher, ISBN 3-7186-4983-7
- Uhlenberg P.(Editor), (2009) International Handbook of the Demography of Aging, New York: Springer-Verlag, pp.113-131.
- Paul Demeny and Geoffrey McNicoll (Eds.). 2003. The Encyclopedia of Population. New York, Macmillan Reference USA, vol.1, 32-37
- Phillip Longman (2004), The Empty Cradle: how falling birth rates threaten global prosperity and what to do about it
- Joe McFalls (2007), Population: A Lively Introduction, Population Reference Bureau
- Ben J. Wattenberg (2004), How the New Demography of Depopulation Will Shape Our Future. Chicago: R. Dee, ISBN 1-56663-606-X
External links
- Demography at the Open Directory Project
- Historicalstatistics.org Links to historical demographic and economic statistics
- United Nations Population Division Homepage (e.g. Population Estimates and Projections Data Online)
- Java Simulation of Population Dynamics.
- Basic Guide to the World: Population changes and trends, 1960 to 2003
- Brief review of world basic demographic trends
Categories:- Human geography
- Population
- Branches of sociology (interdisciplinary)
- Environmental social science
- Demography
- Actuarial science
- Greek loanwords


Wikimedia Foundation. 2010.