- Normal probability plot
-
The normal probability plot is a graphical technique for normality testing: assessing whether or not a data set is approximately normally distributed.
 Example of a normal probability plot.
The data are plotted against a theoretical normal distribution in such a way that the points should form an approximate straight line. Departures from this straight line indicate departures from normality.
The normal probability plot is a special case of the probability plot, for the case of a normal distribution.
Contents
Definition
The normal probability plot is formed by:
- Vertical axis: Ordered response values
- Horizontal axis: Normal order statistic medians or means; see rankit
These are calculated according to the following formula. For each data value
 , find zi such that:
![P(Z<z_i)=\begin{cases}
1-0.5^{1/n} &\text{for } i=1\\[8pt]
0.5^{1/n} &\text{for } i=n\\[8pt]
\frac{i-0.3175}{n+0.365} &\text{otherwise}
\end{cases}](e/d3e7fe35c143bb596053f2103b6869d3.png)
That is, the observations are plotted as a function of the corresponding normal order statistic medians. Another way to think about this is that the sample values are plotted against what we would expect to see if it was strictly consistent with the normal distribution.
If the data is consistent with a sample from a normal distribution the points should lie close to a straight line. As a reference, a straight line can be fit to the points. The further the points vary from this line, the greater the indication of departure from normality. If the sample has mean 0, standard deviation 1 then a line through 0 with slope 1 could be used. How close to the line the points will lie does depend on the sample size. For a large sample, > 100, we'd expect the points to be very close to the reference line. Smaller samples will see a much larger variation, but might still be consistent with a normal sample.
Other distributions
Main article: Probability plotProbability plots for distributions other than the normal are computed in exactly the same way. The normal quantile function G is simply replaced by the quantile function of the desired distribution. That is, a probability plot can easily be generated for any distribution for which one has the quantile function.
One advantage of this method of computing probability plots is that the intercept and slope estimates of the fitted line are in fact estimates for the location and scale parameters of the distribution. Although this is not too important for the normal distribution since the location and scale are estimated by the mean and standard deviation, respectively, it can be useful for many other distributions.
The correlation coefficient of the points on the normal probability plot can be compared to a table of critical values to provide a formal test of the hypothesis that the data come from a normal distribution.
Examples
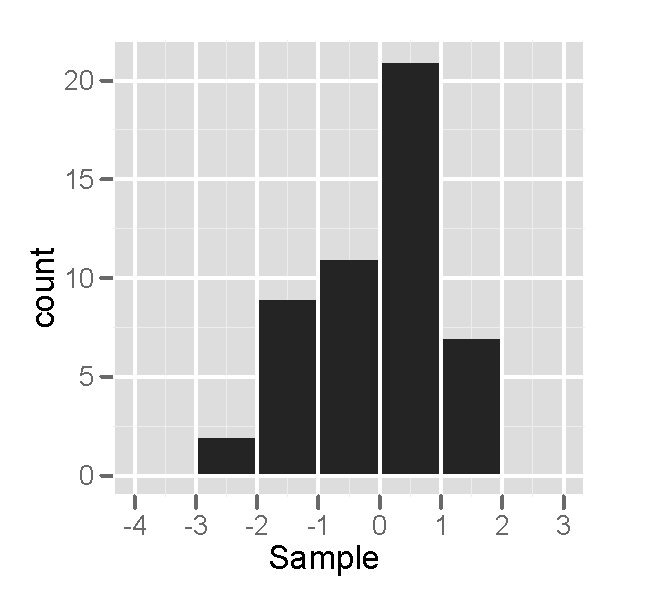
This is a sample of size 50 from a normal distribution, plotted as both a histogram, and a normal probability plot.
-

Normal probability plot of a sample from a normal distribution - it looks fairly straight, at least when the few large and small values are ignored.
-

Histogram of a sample from a normal distribution - it looks fairly symmetric and unimodal
This is a sample of size 50 from a right-skewed distribution, plotted as both a histogram, and a normal probability plot.
-

Normal probability plot of a sample from a right-skewed distribution - it looks has an inverted C shape.
-

Histogram of a sample from a right-skewed distribution - it unimodal and skewed right.
This is a sample of size 50 from a uniform distribution, plotted as both a histogram, and a normal probability plot.
-

Normal probability plot of a sample from a uniform distribution - it has an S shape.
-
Histogram of a sample from a uniform distribution - it multimodal and supposedly roughly symmetric.
See also
References
 This article incorporates public domain material from websites or documents of the National Institute of Standards and Technology.
Further reading
- Chambers, John; William Cleveland, Beat Kleiner, and Paul Tukey (1983). Graphical Methods for Data Analysis. Wadsworth.
External links
Categories:- Statistical charts and diagrams
- Normal distribution
- Normality tests


Wikimedia Foundation. 2010.