- Demographics of Portugal
-
This article is about the demographic features of the population of Portugal, including population density, ethnicity, education level, health of the populace, economic status, religious affiliations and other aspects of the population.
Historical populations Year Pop. ±% 1422 1,043,274 — 1527 1,262,376 +21.0% 1636 1,100,000 −12.9% 1736 2,143,368 +94.9% 1770 2,850,444 +33.0% 1776 3,352,310 +17.6% 1801 2,931,930 −12.5% 1811 2,876,602 −1.9% 1838 3,200,000 +11.2% 1849 3,411,454 +6.6% 1864 4,188,419 +22.8% 1878 4,550,699 +8.6% 1890 5,049,729 +11.0% 1911 5,969,056 +18.2% 1920 6,032,991 +1.1% 1930 6,825,883 +13.1% 1940 7,722,152 +13.1% 1950 8,510,240 +10.2% 1960 8,851,240 +4.0% 1970 8,648,369 −2.3% 1981 9,833,041 +13.7% 1991 9,862,540 +0.3% 2001 10,356,117 +5.0% 2011 10,555,853 +1.9% Source: INE 2011[1][2][3] As of 2010 Portugal had 10,735,765 inhabitants.
Portugal is a fairly homogeneous country linguistically and religiously. Ethnically, the Portuguese people are mainly a combination of Roman Iberian Hispanics (people from Hispania), Celtic tribes, Lusitanians and others, with a fair amount of Roman, Germanic (Visigoths and Suevi) and some minor elements, essentially Arab-Berbers, and Jews.
Furthermore the demographic development is characterized by three trends: increasing longevity, decreasing birth rates and an increasing percentage of population from foreign extraction.
Today, many Eastern Europeans (especially Ukrainians, Moldovans, Romanians and Russians), as well as Brazilians, are making Portugal their home. Portuguese is spoken throughout the country, with only the villages of Miranda do Douro's Mirandese language recognised as a locally co-official language.
Contents
Vital statistics since 1900[4][5][6]
 Portugal population 1961-2003, Number of inhabitants in thousands, (2005 Data from FAO)
Average population (x 1000) Live births Deaths Natural change Crude birth rate (per 1000) Crude death rate (per 1000) Natural change (per 1000) 1900 5 410 165 245 110 330 54 915 30.5 20.3 10.2 1901 5 460 170 773 114 130 56 643 31.3 20.9 10.4 1902 5 490 176 029 108 378 67 651 32.0 19.7 12.4 1903 5 560 183 138 111 685 71 453 33.0 20.1 12.8 1904 5 600 176 726 105 572 71 154 31.6 18.9 12.7 1905 5 660 179 746 112 756 66 990 31.8 20.0 11.8 1906 5 690 182 920 125 243 57 677 32.1 22.0 10.2 1907 5 730 176 417 113 254 63 163 30.7 19.7 11.0 1908 5 790 175 268 115 876 59 392 30.3 20.0 10.2 1909 5 850 174 753 112 421 62 332 29.9 19.2 10.8 1910 5 890 186 953 113 161 73 792 31.7 19.2 12.6 1911 5 960 230 033 130 900 99 133 38.6 22.0 16.6 1912 5 960 207 870 119 578 88 292 34.9 20.1 14.8 1913 5 970 193 906 123 054 70 852 32.5 20.6 11.9 1914 5 980 188 479 115 526 72 953 31.5 19.3 12.0 1915 5 990 195 225 122 513 72 712 32.6 20.5 12.0 1916 6 000 192 780 129 389 63 391 32.1 21.6 10.7 1917 6 000 188 391 134 082 54 309 31.4 22.3 9.0 1918 6 020 178 687 248 978 -70 291 29.7 41.4 -11.6 1919 6 020 166 162 152 856 13 306 27.6 25.4 2.2 1920 6 040 202 908 142 862 60 046 33.6 23.7 9.9 1921 6 070 197 022 126 316 70 706 32.4 20.8 11.7 1922 6 170 203 727 125 747 77 980 33.1 20.4 12.6 1923 6 240 207 172 141 775 65 397 33.2 22.7 10.4 1924 6 310 207 440 126 052 81 388 32.8 20.0 12.8 1925 6 370 208 434 117 413 91 021 32.6 18.4 14.3 1926 6 470 214 633 127 959 86 674 33.5 19.8 13.8 1927 6 550 199 399 123 382 76 017 31.0 18.8 12.2 1928 6 620 211 314 124 088 87 226 31.9 18.7 13.1 1929 6 720 200 874 118 824 82 050 29.9 17.7 12.2 1930 6 804 202 529 116 352 86 177 29.7 17.1 12.8 1931 6 860 204 120 115 225 88 895 29.7 16.8 13.0 1932 6 968 208 062 118 895 89 167 29.9 17.1 12.8 1933 7 057 204 315 120 996 83 319 28.9 17.2 11.8 1934 7 147 203 158 118 539 84 619 28.4 16.6 11.8 1935 7 237 203 943 123 051 80 892 28.2 17.0 11.2 1936 7 326 205 615 119 003 86 612 28.1 16.2 11.8 1937 7 416 198 217 117 291 80 926 26.7 15.8 10.9 1938 7 506 199 467 115 331 84 136 26.6 15.4 11.2 1939 7 595 198 888 116 075 82 813 26.2 15.3 10.9 1940 7 696 187 892 120 486 67 406 24.4 15.7 8.8 1941 7 750 184 336 134 937 49 399 23.8 17.4 6.4 1942 7 810 187 503 126 531 60 972 24.0 16.1 7.8 1943 7 890 198 101 121 887 76 214 25.1 15.3 9.7 1944 7 960 201 373 119 275 82 098 25.3 14.8 10.3 1945 8 040 209 131 115 596 93 535 26.0 14.2 11.6 1946 8 100 205 825 120 800 85 025 25.4 14.9 10.5 1947 8 180 200 488 110 437 90 051 24.5 13.5 11.0 1948 8 262 220 981 107 576 113 405 26.7 13.0 13.7 1949 8 333 212 260 117 499 94 761 25.5 14.1 11.4 1950 8 405 205 163 102 798 102 365 24.4 12.2 12.2 1951 8 459 207 870 105 473 102 397 24.6 12.5 12.1 1952 8 496 211 213 100 486 110 727 24.9 11.8 13.0 1953 8 534 202 135 97 460 104 675 23.7 11.4 12.3 1954 8 570 197 536 95 088 102 448 23.0 11.1 12.0 1955 8 610 209 790 99 472 110 318 24.4 11.6 12.8 1956 8 647 202 667 106 919 95 748 23.4 12.4 11.1 1957 8 680 211 494 101 784 109 710 24.4 11.7 12.6 1958 8 725 212 467 91 891 120 576 24.4 10.5 13.8 1959 8 776 213 062 97 754 115 308 24.3 11.1 13.1 1960 8 943 213 895 95 007 118 888 23.9 10.6 13.3 1961 8 938 217 516 99 590 117 926 24.3 11.1 13.2 1962 9 020 220 200 96 864 123 336 24.4 10.7 13.7 1963 9 082 212 152 98 011 114 141 23.4 10.8 12.6 1964 9 123 217 136 96 878 120 258 23.8 10.6 13.2 1965 9 129 210 299 95 187 115 112 23.0 10.4 12.6 1966 9 109 206 940 100 088 106 852 22.7 11.0 11.7 1967 9 103 202 061 95 816 106 245 22.2 10.5 11.7 1968 9 115 194 962 94 661 100 301 21.4 10.4 11.0 1969 9 097 189 739 101 088 88 651 20.9 11.1 9.7 1970 8 869 180 690 93 093 87 597 20.4 10.5 9.9 1971 8 644 181 243 98 688 82 555 21.0 11.4 9.6 1972 8 631 174 685 90 315 84 370 20.2 10.5 9.8 1973 8 633 172 324 95 435 76 889 20.0 11.1 8.9 1974 8 754 171 979 96 928 75 051 19.6 11.1 8.6 1975 9 093 179 648 97 936 81 712 19.8 10.8 9.0 1976 9 355 186 712 102 027 84 685 20.0 10.9 9.1 1977 9 455 181 064 96 111 84 953 19.2 10.2 9.0 1978 9 558 167 467 96 194 71 273 17.5 10.1 7.5 1979 9 661 160 311 92 732 67 579 16.6 9.6 7.0 1980 9 766 158 352 94 971 63 381 16.2 9.7 6.5 1981 9 852 152 102 95 892 56 210 15.4 9.7 5.7 1982 9 912 151 029 92 551 58 478 15.3 9.4 5.9 1983 9 955 144 327 96 367 47 960 14.6 9.7 4.9 1984 9 989 142 805 97 227 45 578 14.4 9.8 4.6 1985 10 011 130 492 97 339 33 153 13.2 9.8 3.3 1986 10 011 126 748 95 828 30 920 12.7 9.6 3.1 1987 9 994 123 218 95 423 27 795 12.3 9.5 2.8 1988 9 968 122 121 98 236 23 885 12.3 9.9 2.4 1989 9 937 118 560 96 220 22 340 11.9 9.7 2.2 1990 9 899 116 383 103 115 13 268 11.8 10.4 1.3 1991 9 954 116 415 104 361 12 054 11.7 10.5 1.2 1992 9 963 115 018 101 161 13 857 11.5 10.2 1.4 1993 9 974 114 030 106 384 7 646 11.4 10.7 0.8 1994 9 998 109 287 99 621 9 666 10.9 10.0 1.0 1995 10 025 107 184 103 939 3 245 10.7 10.4 0.3 1996 10 048 110 363 107 259 3 104 11.0 10.7 0.3 1997 10 076 113 047 105 157 7 890 11.2 10.4 0.8 1998 10 112 113 510 106 574 6 936 11.2 10.5 0.7 1999 10 154 116 038 108 268 7 770 11.4 10.7 0.8 2000 10 211 120 071 105 813 14 258 11.8 10.4 1.4 2001 10 299 112 825 105 582 7 243 11.0 10.3 0.7 2002 10 368 114 456 106 690 7 766 11.0 10.3 0.7 2003 10 441 112 589 109 148 3 441 10.8 10.5 0.3 2004 10 502 109 356 102 371 6 985 10.4 9.7 0.7 2005 10 550 109 457 107 839 1 618 10.4 10.2 0.2 2006 10 585 105 514 102 362 3 152 10.0 9.7 0.3 2007 10 609 102 567 103 888 -1 321 9.7 9.8 -0.1 2008 10 623 104 594 104 280 314 9.8 9.8 0.0 2009 10 633 99 491 104 434 -4 943 9.4 9.8 -0.5 2010 Urban organization
Metropolitan areas
As of 2001 Census, Portugal had two significant agglomerations: Lisbon Metropolitan Region 2.82 million inhabitants and Porto Metropolitan Agglomeration with 1.68 million people.[7] These broader agglomerations are distinct from the political metropolitan areas of Lisbon and Porto - Grande Área Metropolitana de Lisboa and Grande Área Metropolitana do Porto. Together they hold 43% of the total population.
Image City Metropolitan area Subregion Core municipality 
Lisbon 2,815,851 million[7] 2,037,823 545,245 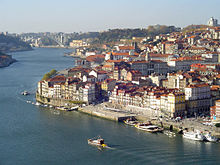
Porto 1,679,854 million[7] 1,286,139 237,559 Largest urban areas
When considering the number of inhabitants in consistent single urban areas, de facto cities in mainland Portugal, per the new with increased density of human-created structures, and excluding suburban and rural areas, Portugal has two cities with about one million inhabitants each, ten others with more than 50,000 inhabitants and 14 cities with populations between 20,000 and 40,000 inhabitants.[7]
- Ten largest urban areas
-

1.Lisbon and surroundings
> 1 million inh.
Greater Lisbon
Lisbon Metropolitan Region -

2.Porto and surroundings
< 1 million inh.
Greater Porto
Northern Urban-Metro. Region -

3.Braga
> 100,000 inh.
Northern Urban-Metro. Region -

4.Coimbra
100,000 inh. -

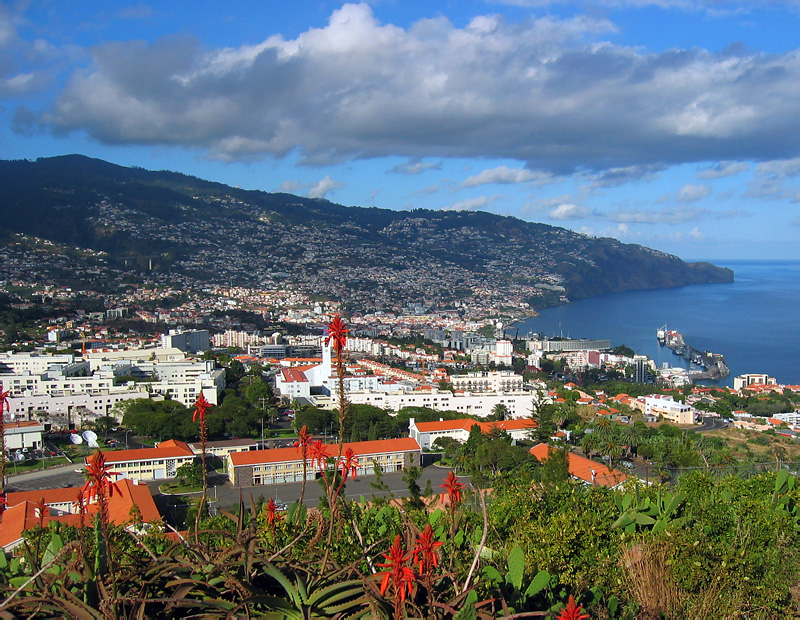
5.Funchal
100,000 inh. -

6.Setúbal
100,000 inh.
Greater Lisbon
Lisbon Metropolitan Region -

7.Póvoa de Varzim-Vila
< 100,000 inh.
Greater Porto
Northern Urban-Metro. Region -

8.Aveiro
< 100,000 inh. -

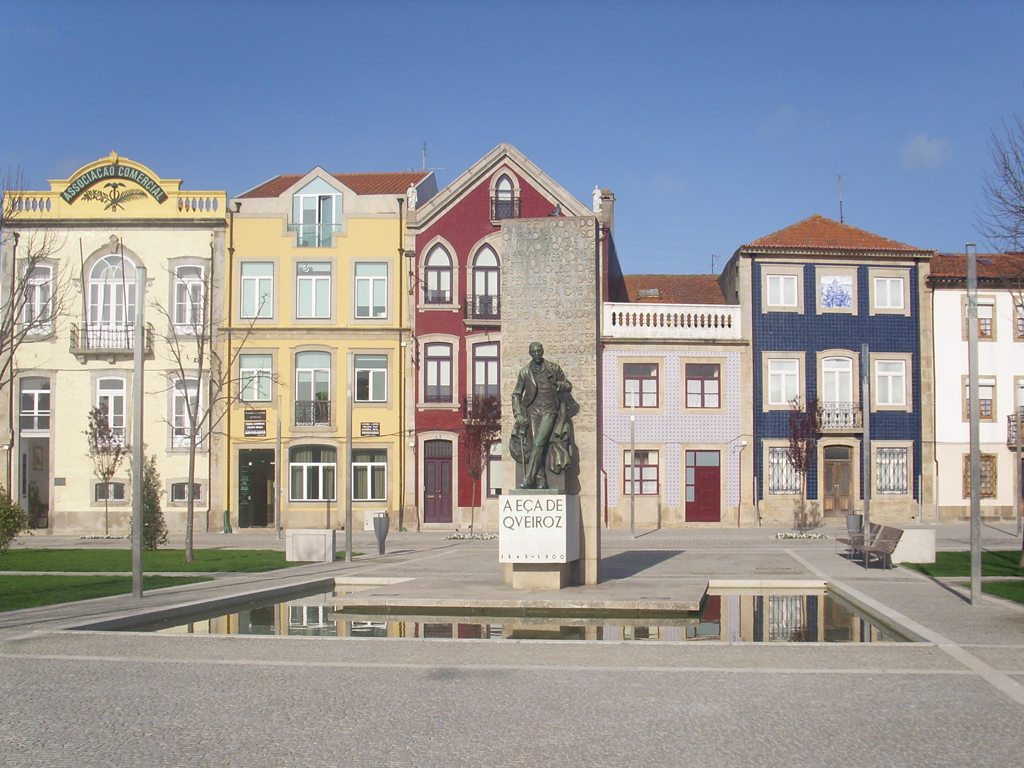
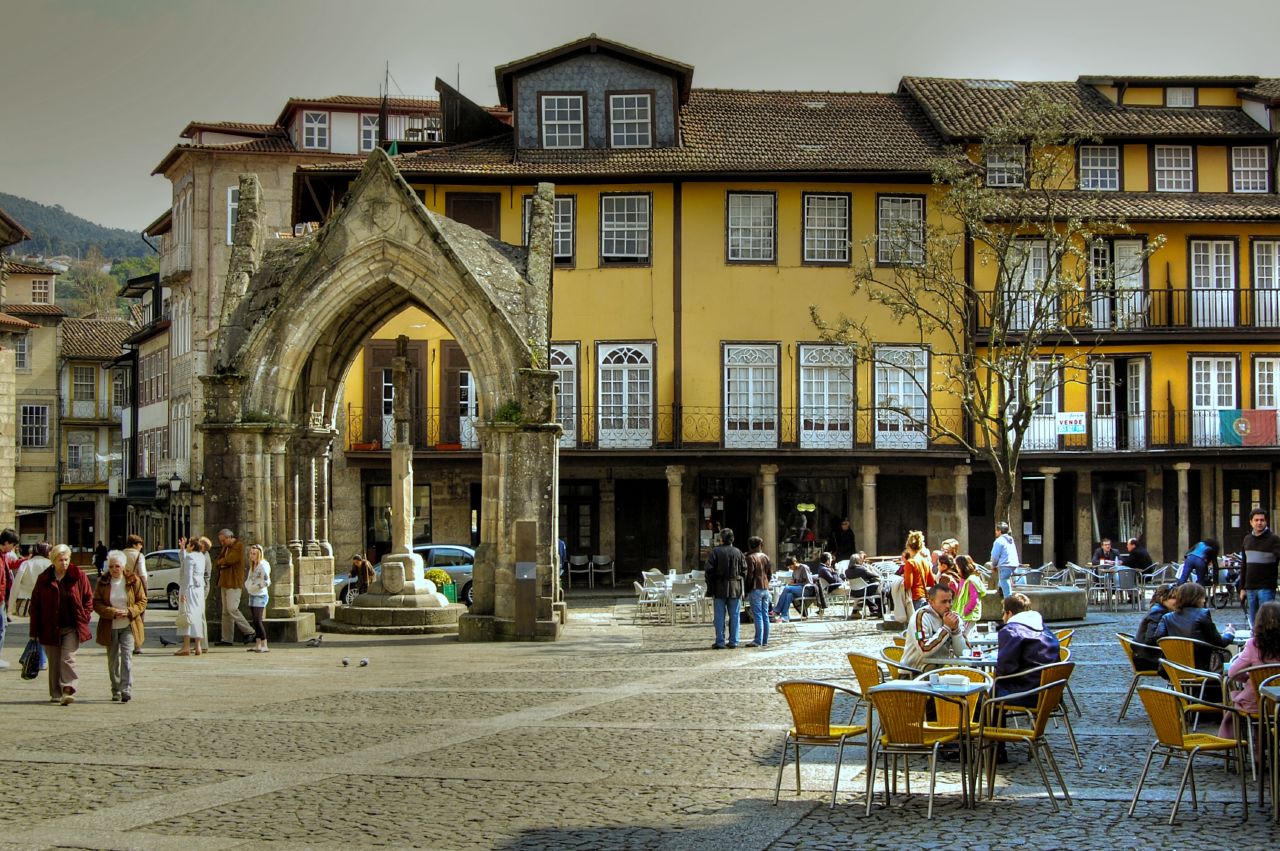
9.Guimarães
< 100,000 inh.
Northern Urban-Metro. Region -

10.Viseu
< 100,000 inh.
Note: the following table does not include cities in the Portuguese islands of Madeira and Azores in mid-Atlantic. Ocean.
City Metropolitan Area Agglomeration Cities with about 50,000 inh. (2001 Census) Leiria Lisbon Metropolitan Region Portimão Faro Évora Cities with about 40,000 inh. (2001 Census) Viana do Castelo Covilhã Castelo Branco Santarém Lisbon Metropolitan Region Alverca do Ribatejo Lisbon Metropolitan Region Vila Nova de Famalicão Northern Littoral Urban-Metropolitan Region Figueira da Foz Guarda Caldas da Rainha Lisbon Metropolitan Region Olhão Santo Tirso Greater Porto Northern Littoral Urban-Metropolitan Region Vila Real Póvoa de Santa Iria Greater Lisbon Lisbon Metropolitan Region Largest cities
Portugal has 151 localities with city status (cidade). Every city is included into a municipality (município). This is a list of population by city, which means that it refers to the number of inhabitants in the city proper, excluding inhabitants from the same municipality but living outside the urban area of the city in other civil parishes (freguesias) of the municipality. In some cases, the entire municipality and the city proper cover the same territory.[8]
Largest municipalities by population
Denotes the number of inhabitants in the municipality area; area is in km2; only for populations of over 100,000 inhabitants.
Rank Municipality Population Land Area Density Metropolitan area 1 Lisbon 564,657 84.8 6,658 Greater Metropolitan Area of Lisbon 2 Sintra 409,482 319.2 1,283 Greater Metropolitan Area of Lisbon 3 Vila Nova de Gaia 288,749 170.8 1,690 Greater Metropolitan Area of Porto 4 Porto 238,954 41.3 5,785 Greater Metropolitan Area of Porto 5 Loures 199,231 169.3 1,177 Greater Metropolitan Area of Lisbon 6 Cascais 181,444 97.4 1,863 Greater Metropolitan Area of Lisbon 7 Amadora 176,239 23.8 7,405 Greater Metropolitan Area of Lisbon 8 Braga 170,858 183.2 933 9 Oeiras 168,475 45.7 3,687 Greater Metropolitan Area of Lisbon 10 Matosinhos 168,451 62.2 2,708 Greater Metropolitan Area of Porto 11 Almada 164,844 70.0 2,355 Greater Metropolitan Area of Lisbon 12 Seixal 164,715 95.5 1725 Greater Metropolitan Area of Lisbon 13 Gondomar 164,096 133,26 1,231 Greater Metropolitan Area of Porto 14 Guimarães 161,876 241.3 671 15 Coimbra 148,474 319.0 465 16 Odivelas 143,995 26.4 5,454 Greater Metropolitan Area of Lisbon 17 Santa Maria da Feira 142,295 215.1 661 Greater Metropolitan Area of Porto 18 Vila Franca de Xira 133,224 317.7 419 Greater Metropolitan Area of Lisbon 19 Vila Nova de Famalicão 131,690 201.7 653 20 Barcelos 123,831 378.9 327 21 Setúbal 120,117 171.9 699 Greater Metropolitan Area of Lisbon 22 Maia 120,111 83,70 1435 Greater Metropolitan Area of Porto 23 Leiria 119,870 564.7 212 24 Funchal 100,847 75.7 1332 People
Main article: Portuguese peopleNationality
- noun: Portuguese (singular and plural)
- adjective: Portuguese
Languages
Main article: Portuguese languageThe main language is Portuguese. Mirandês (the Mirandese language), is also recognised, and has special protection in the area of Miranda do Douro.
Immigration
Main article: Immigration to Portugal Foreign-born naturalised citizens in Portugal by 2001.
In 1992, 1.3% of the population was foreign, by 2007 the number had grown to 4.1% or 435,736 people[9] this number excludes an unknown number of illegal immigrants.
Since the independence of the former African colonies, Portugal saw a steady immigration from Africa, most notably Cape Verde, Angola and Guinea-Bissau, but also São Tomé and Príncipe, Mozambique and former Portuguese India in Asia.
Portugal saw migration waves due to labour shortages since 1999, first from Eastern Europe (1999–2002), in two distinctive groups, a Slav (Ukraine, Russia and Bulgaria) and an East Latin (Romania and Moldavia), that stopped and started declining as the labour market became saturated.
Since 2003, most of the immigrants came from Brazil, China and the Indian subcontinent. Family reunification was seen as important for a successful integration in the country, thus the government eased it, and in 2006, more than 6 in 10 new immigrants were family members of legal foreign residents in the country.[10]
Other immigrant nationalities in Portugal such as Croatians, Hungarians, Nigerians, Serbians and Venezuelans are on the rise.
There is also a significant number of Western European residents in search of quality of life, namely British, German, French, and Dutch.
The 20 largest legal immigrant communities in 2007 compared with their numbers in 1999
* : European Union citizenshipLegal foreign residents Number in 1999 Number in 2007 Growth in percentage Brazilians 20,851 66,354 + 218% Cape Verdeans 43,951 63,925 + 45% Ukrainians 123 39,480 + 31998% Angolans 17,721 32,728 + 85% Guineans 14,217 23,733 + 67% British* 13,335 23,608 + 77% Romanians* 224 19,155 + 8451% Spanish* 11,122 18,030 + 62% Germans* 9,605 15,498 + 61% Moldavians 3 14,053 + 468333% Santomeans 4,809 10,627 + 121% French* 6,499 10,556 + 62% Chinese 2,762 10,448 + 278% US-Americans 7,975 8,264 + 4% Dutch* 3,675 6,589 + 79% Italians* 2,700 5,985 + 122% Mozambicans 4,502 5,681 + 26% Russians 448 5,114 + 1042% Bulgarians* 347 5,028 + 1349% Indians 1,211 4,104 + 239% In 2008, SEF, the foreigners and borders bureau, started using a new integrated information system, incompatible with previous statistics. The foreign population grew 1% from 435 736 in 2007 to 440 277. One in four immigrants is Brazilian.[11]
Immigrants Legal foreign residents Number in 2008 Brazilians 106 294 Ukrainians 53,494 Cape Verdeans 51,353 Romanians* 27,769 Angolans 27 619 Guineans 24,391 Moldavians 14,053 Nationality appliance Previous nationality Number in 2008 Cape Verdean 9926 Brazilian 8391 British 4589 Angolans 4463 Moldavians 4449 Ethnic Minorities and persons with disabilities
See also: Immigration to Portugal and Racism in PortugalAnti-racism laws prohibit and penalize racial discrimination in housing, business, and health services. Approximately 332,137 (as of 2007) legal immigrants live in the country, representing approximately 5% of the population. The country also has a resident Romani (Gypsy) population of approximately 40,000 people.
Discrimination against persons with disabilities in employment, education, access to health care, or the provision of other state services is illegal. The law mandates access to public buildings and to newly-built private buildings for such persons.
Sexual Orientation
Homosexuality was decriminalized in 1982. Same-sex civil unions with limited partner rights were introduced in Portugal on 15 March 2001; greater rights were granted in 2006. In May 2010, the President of the Republic signed a gay marriage bill into law, making Portugal the sixth country in the EU and the eighth in the world to allow gay marriages. However, the law does not permit same-sex couples to adopt. Portugal is one of a few countries in the world, and one of the first, with anti-discrimination laws that exist in most fields: in the Constitution (discrimination based on sexual orientation is prohibited by law), in the Penal Code as well as the Labour Code.
Religion
Main article: Religion in PortugalThe great majority of the Portuguese population belongs to the Roman Catholic Church. Religious observance remains somewhat strong in northern areas, with the population of Lisbon and southern areas generally less devout. Religious minorities include a little over 300,000 Protestants. There are also about 50,000 Muslims and 10,000 Hindus. Most of them came from Goa, a former Portuguese colony on the west coast of India (Some Muslims also came from former Portuguese African colonies with important Muslim minorities: Guinea-Bissau, Mozambique, and São Tomé and Príncipe). There are also about 1,000 Jews. Portugal is also home to less than 10,000 Buddhists, mostly Chinese from Macau and a few Indians from Goa.
Literacy
- definition:age 15 and over can read and write
- total population: 93.3%
- male: 95.5%
- female: 91.3% (2003 est.)
Genetics
Y-Dna (male lineages)
A large majority of the male lineages (85%) could be classified as belonging to three basic haplogroups, R1b, J, and E1b1b. While R1b, accounting for more than half of the lineages, is a characteristic marker of many different West European populations, haplogroups J and E1b1b and its subclades consist of lineages that are typical of the circum-Mediterranean region. The typical Berber haplogroup E1b1b1b (M81) is found as at a frequency of 5–6%.
Region[12] N E* (M96) E1b1a (M2) E1b1b (M35)* E1b1b1a (M78) E1b1b1b (M81) E1b1b1c (M34) F G (M201) I (M170) J1 (M167) J2 (M172) T (M70) L (M61) R1a (M173) R1b (M269) North, Center, South 657 0.5 0.2 0.9 4.1 5.6 1.2 0.2 5.5 7.6 3.4 7 1.6 0.3 2 59.9 mtDna (female lineages)
The most frequent mtDNA haplogroup in Portugal is H, followed by U, T, and pre-V/V clades. Two haplogroups, H and U5 alone account for almost half of the individuals. About 9% of the lineages found in Portugal belong to african lineages L and U6.
Region[13] N H* H5 HV0 HVa R0a J T1 T2 U1 U2e U3 U4 U5a U5b U7 U8 U* K N1 N2 X M U6 L Other North 188 40.4 2.7 6.9 0.0 0.0 4.8 6.4 7.4 0.0 0.5 2.1 2.1 2.7 3.7 0.0 0.0 2.7 3.7 3.2 3.2 0.0 0.0 4.3 3.2 0.0 Center 203 46.8 2.5 3.0 0.0 1.0 6.4 2.0 7.4 0.0 2.0 0.5 2.0 2.5 1.5 0.0 0.5 0.5 8.4 0.5 1.0 1.5 0.5 2.5 6.4 1.0 South 203 44.3 1.0 3.9 0.0 1.0 7.9 2.0 5.9 0.0 0.5 1.5 2.0 2.5 2.5 0.5 0.0 0.5 5.9 1.0 1.5 3.0 1.0 0.5 10.8 0.5 Total 594 43.9 2.0 4.5 0.0 0.7 6.4 3.4 6.9 0.0 1.0 1.3 2.0 2.5 2.5 0.2 0.2 1.2 6.1 1.5 1.9 1.5 0.5 2.4 6.9 0.5 CIA World Factbook demographic statistics
The following demographic statistics are from the CIA World Factbook, unless otherwise indicated.
Age structure
- 0-14 years: 16.5% (male 914,480/female 837,525)
- 15-64 years: 66.3% (male 3,501,206/female 3,551,706)
- 65 years and over: 17.3% (male 757,220/female 1,080,699) (2007 est.)
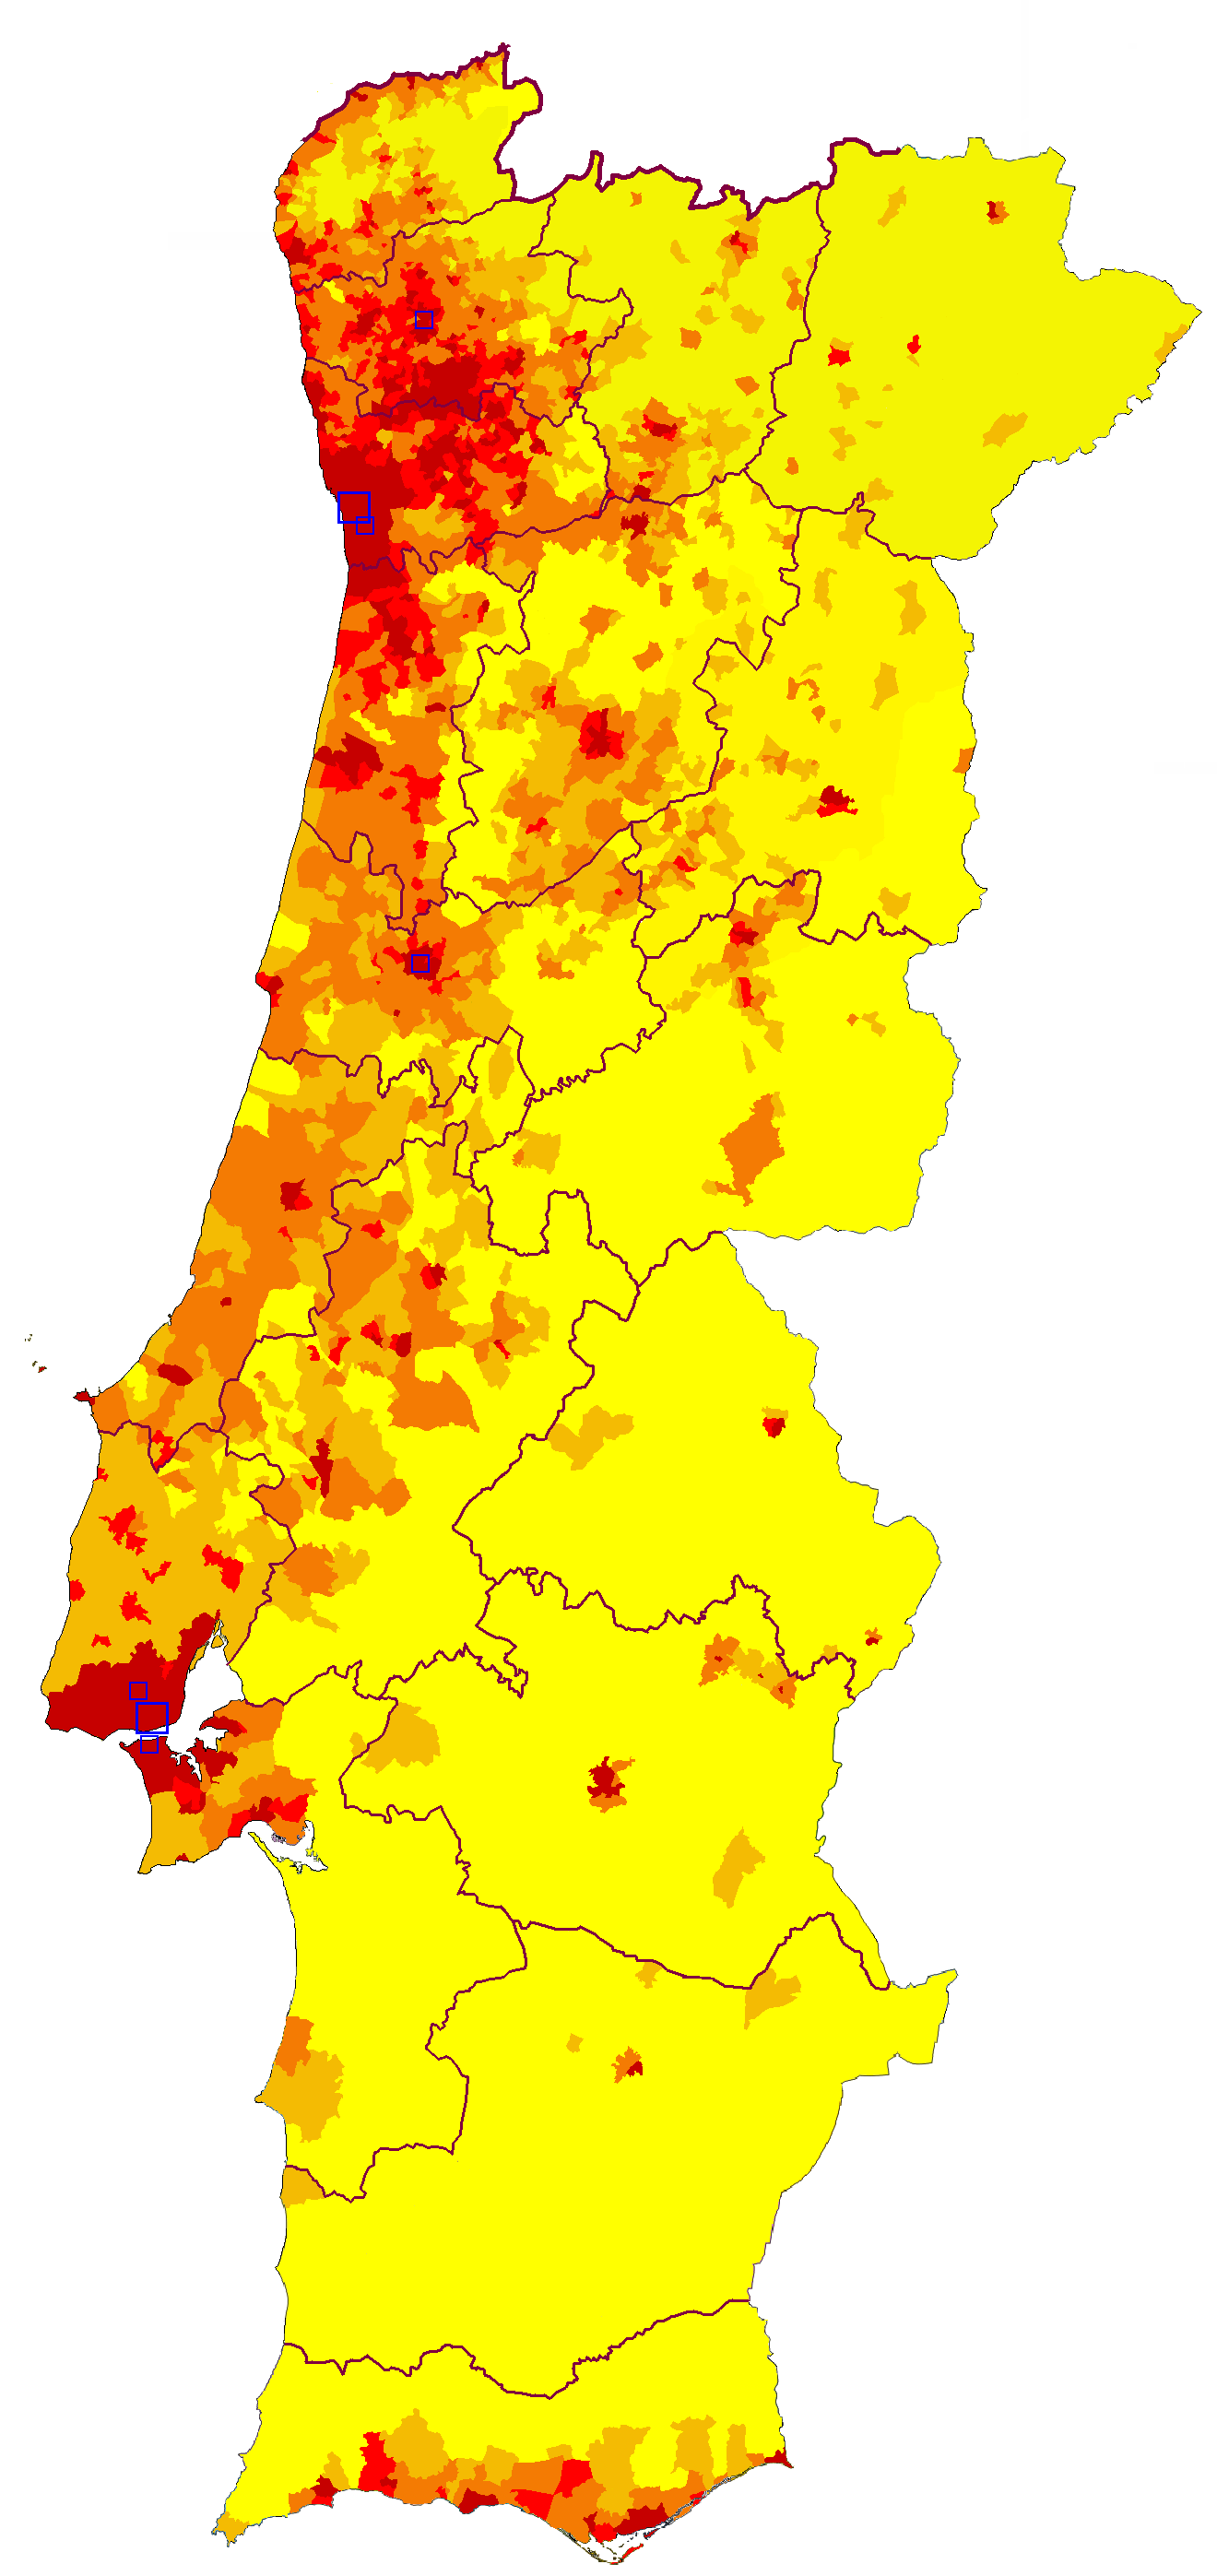
 Population density of Portugal, per km2:0-4950-99100-299300-599600+
Sex ratio
- at birth: 1.07 male(s)/female
- under 15 years: 1.092 male(s)/female
- 15-64 years: 0.986 male(s)/female
- 65 years and over: 0.701 male(s)/female
- total population: 0.946 male(s)/female (2007 est.)
Infant mortality rate
- 6.05 deaths/1,000 live births (2000 est.)
- 5.73 deaths/1,000 live births (2003 est.)
- 5.13 deaths/1,000 live births (2004 est.)
- 5.05 deaths/1,000 live births (2005 est.)
- 4.98 deaths/1,000 live births (2006 est.)
- 4.92 deaths/1,000 live births (2007 est.)
Life expectancy at birth
- total population: 77.87 years
- male: 74.6 years
- female: 81.36 years (2007 est.)
Total fertility rate
- 1.47 children born/woman (2000 est.)
- 1.49 children born/woman (2003 est.)
- 1.46 children born/woman (2004 est.)
- 1.47 children born/woman (2005 est.)
- 1.49 children born/woman (2008 est.)
See also
References
- ^ Nuno Valério (coord.), Estatísticas Históricas Portuguesas, Vol. I, pp. 33, 37 e 51. INE, 2001. (PDF: 4,18 MB)
- ^ INE, CENSOS 2001 Resultados Definitivos, Informação à Comunicação Social, 21/10/2002.
- ^ INE, Estimativas de População Residente, Portugal, NUTS II, NUTS III e Municípios - 2006, Informação à Comunicação Social, 03/08/2007.
- ^ B.R. Mitchell. European historical statistics, 1750-1975.
- ^ http://unstats.un.org/unsd/demographic/products/dyb/dybsets/1948%20DYB.pdf United nations. Demographic Yearbook 1948
- ^ http://www.ine.pt/xportal/xmain?xpid=INE&xpgid=ine_main Statistics Portugal]
- ^ a b c d Fernando Nunes da Silva (2005), Alta Velocidade em Portugal, Desenvolvimento Regional, CENSUR, IST
- ^ UMA POPULAÇÃO QUE SE URBANIZA, Uma avaliação recente - Cidades, 2004 Nuno Pires Soares, Instituto Geográfico Português (Geographic Institute of Portugal)
- ^ (in Portuguese) (pdf) População Estrangeira em Território Nacional, SEF, 2008, http://www.sef.pt/documentos/56/DADOS_2007.pdf, retrieved 2008-09-12
- ^ Imigração: Novos imigrantes legais em Portugal aumentaram 50% em 2006 - OCDE - RTP.pt
- ^ Um em cada quatro imigrantes é de nacionalidade brasileira - Diário de Notícias
- ^ Beleza et al. (2006), Micro-Phylogeographic and Demographic History of Portuguese Male Lineages, Annals of Human Genetics 70: 181–194, doi: 10.1111/j.1469-1809.2005.00221.x
- ^ Achilli A, Olivieri A, Pala M, Metspalu E, Fornarino S, et al. Mitochondrial DNA variation of modern Tuscans supports the Near Eastern origin of Etruscans. Am J Hum Genet. 2007;80:759–768.
Life in Portugal Demographics of Europe Sovereign
states- Albania
- Andorra
- Armenia
- Austria
- Azerbaijan
- Belarus
- Belgium
- Bosnia and Herzegovina
- Bulgaria
- Croatia
- Cyprus
- Czech Republic
- Denmark
- Estonia
- Finland
- France
- Georgia
- Germany
- Greece
- Hungary
- Iceland
- Ireland
- Italy
- Kazakhstan
- Latvia
- Liechtenstein
- Lithuania
- Luxembourg
- Macedonia
- Malta
- Moldova
- Monaco
- Montenegro
- Netherlands
- Norway
- Poland
- Portugal
- Romania
- Russia
- San Marino
- Serbia
- Slovakia
- Slovenia
- Spain
- Sweden
- Switzerland
- Turkey
- Ukraine
- United Kingdom
- (England
- Northern Ireland
- Scotland
- Wales)
- Vatican City
States with limited
recognition- Abkhazia
- Kosovo
- Nagorno-Karabakh
- Northern Cyprus
- South Ossetia
- Transnistria
Dependencies
and other territories- Åland
- Faroe Islands
- Gibraltar
- Guernsey
- Jan Mayen
- Jersey
- Isle of Man
- Svalbard
Other entities - European Union
Categories:- Portuguese society
- Demographics of Portugal


Wikimedia Foundation. 2010.