- Tiger Cub Economies
-
The term Tiger Cub Economies refers to the economies of the four dominant countries in the Southeast Asia after Singapore.[1]

The Tiger Cub Economies are:
These economies follow the four Asian Tigers (Singapore, South Korea, Republic of China (Taiwan) and Hong Kong).
Contents
Introduction
The young of tigers are called cubs. The term Tiger 'Cub' Economies came after the Four Asian Tigers: Singapore, South Korea, Taiwan and Hong Kong. The Tiger 'Cub' Economies follow the Four Asian Tigers, which pursued an export-driven model of economic development.
These countries and territories focused on developing goods for export to highly-industrialized nations. Domestic consumption of foreign products was discouraged through government policies such as high tariffs.[citation needed]
The East Asian Tigers singled out education as a means of improving productivity; these nations focused on improving the education system at all levels; heavy emphasis was placed on ensuring that all children attended elementary education and compulsory high school education. Money was also spent on improving the college and university system.[citation needed]
Except for Indonesia, these are newly industrialized countries. Indonesia and the Philippines are also included in the Next Eleven list of economies.
The Tiger Cub Economy countries
Indonesia
Main article: Economy of IndonesiaRepublic of Indonesia 
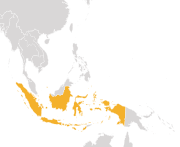
The Republic of Indonesia, fourth most populated country, is a Tiger Cub Economy. Indonesia’s economy in the first few decades after its independence was marred by political mismanagement. Yet, the country’s remarkable resilience to endure the deepest natural and political strife has ensured that Indonesia is now one of Southeast Asia’s fastest growing economies. Indonesia is fast becoming one of the world's most important political and economic success stories.[3]
Despite being a market-based economy, the government exercises control over key areas. With around 158-state owned or public sector units, the government regulates the prices of all basic goods such as rice, electricity or fuel. Agriculture led the economy in output until 1991, when it was overtaken by manufacturing. In 2005, agriculture contributed around 13% of the GDP although it employs an estimated 44% of Indonesia’s workers. Once a major importer of rice, several reforms by the government ensured that rice production grew at 5% annually between 1969 and 1984, mainly concentrated in Java. This helped Indonesia achieve a level of self-sufficiency in the key commodity. The country now exports tea, cocoa, spices, coffee, and natural rubber although they constitute less than 10% of Indonesia’s total exports.
Jakarta, with a population of more than 23 million people is the largest city in Indonesia, the home of the Indonesia Stock Exchange, and also the seat of The Association of Southeast Asian Nations (ASEAN) secretariat.
From being little more than a manufacturer of handicrafts and textiles, Indonesia’s manufacturing sector progressed phenomenally. During Suharto’s New Order regime, Indonesia grew to be a key producer of steel, aluminum, and cement. Between 1985 and 1995, the country’s GDP grew by around 95%, even as inflation remained well within 10%.
However, the Asian economic crisis struck a deathly blow. Indonesia collapsed dramatically and its currency plummeted. Forced to take massive aid from the International Monetary Fund (IMF), the Indonesian government had to resort to a number of austerity measures aimed at reforming the financial sector. The IMF subsequently withdrew aid in 1998, stating that the government had failed to abide by its terms – the effect was cataclysmic. The GDP plunged 13.2% in 1998, shrinking again in 1999, and almost half of all corporations became insolvent in 1999. Social unrest spread and unemployment peaked. A change of government with Suharto stepping down finally offered Indonesia a ray of hope. The IMF offered aid again and the battered economy began to find its feet once more although growth has been a bit erratic. Industry represented 41.7% of the GDP according to 2006 figures and exports such as wood products, clothing, footwear and textiles accounted for 56% of Indonesia’s total exports in 2004.
The services sector contributes to 46% of Indonesia’s GDP (2006). During the 1990s, services expanded at an annual rate of 8.6%, more than twice as fast as agriculture, and continues to grow. Tourism remains an important source of revenue with around five million tourists visiting Indonesia in 2005, although travel advisories to this earthquake-prone region are frequent.
Indonesia’s major trade partners are Japan, the European Union, the U.S, Singapore, and South Korea. Trade with the other ASEAN members too is increasing. Currently, the country is the world’s top exporter of liquefied natural gas (LPG). Indonesia, which was a long-time member of OPEC, recently conveyed its decision to pull out of the organization in 2008. Mining and mineral production represents around 11.9% of GDP with around 0.5% of the country’s labor force engaged in this sector. Life expectancy at birth is estimated at 71.6 years for women and 67.8 for men, or 69.7 years total. With a 12-year public and private education system, around 3.7% of the government’s expenditure is ploughed towards education.
Seismic shifts in its economic history have been mirrored in the country’s banking sector. Chaos reigned supreme during the 1997-98 crisis when many domestic banks collapsed. Relations with the IMF have been tense, and although the government established the Indonesian Bank Restructuring Agency in 1998 to rebuild the private banking sector, the pace of reform has been slow. Inflation came down from 20.4% in 2000 to 13.6% in 2006. Foreign investment in Indonesia, however, has been on the decline ever since the banking crisis and it remains to be seen if promises of future stability might bring the fillip that this country needs.[4]
Indonesian consumer and market-based economy has contribute to the resilience of Indonesian economy during Financial crisis of 2007–2010. Indonesia has seen the emergence of a confident new middle class as its economy continues to perform well, better than others in the region. Its success is partly because a huge proportion of the goods bought and sold in the nation's shops are also made in Indonesia, keeping jobs and money in the country.[5]
The country already figures among the world's top three exporters of coal, natural gas, crude palm oil and natural rubber. It is home to the world's largest gold mine and second-largest copper mine. Its 237 million people give Indonesia a larger population than Brazil or Russia. The growth of its workforce over the next two decades will likely prove more promising than for any of the four BRIC countries. Its still relatively low Internet and credit penetration give the country room to grow.[3]
Malaysia
Main article: Economy of MalaysiaMalaysia 
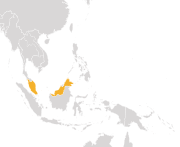
Malaysia is a growing and relatively open state-oriented market economy. The state plays a significant but declining role in guiding economic activity through macroeconomic plans. In 2007, the economy of Malaysia was the 29th largest economy in the world by purchasing power parity with gross domestic product for 2007 estimated to be $357.9 billion with a growth rate of 5% to 7% since 2007
Today, Malaysia is an active participant in Southeast Asia. Well-endowed with natural resources, its rich tropical forests, endless beaches, and cultural diversity attract a wide number of tourists from around the world. It is by far the most visited country in Southeast Asia, ahead of the politically unstable Thailand at 22.1 millions visitors in 2008. Penang, Borneo and Kota Kinabalu remain prime destinations. Geographically, the country lies close to major world trade routes, bringing early exposure to a burgeoning global economy. Malaysian plantations cultivate cocoa, timber, pepper, pineapple and sugar cane, while rice paddies dot the northern reaches.
In the 1970s, Malaysia began to imitate the four Asian Tiger economies (Republic of Korea (South Korea), Republic of China (Taiwan), then British Crown Colony of Hong Kong and the Republic of Singapore) and committed itself to a transition from being reliant on mining and agriculture to an economy that depends more on manufacturing. With Japanese investment, heavy industries flourished and in a matter of years, Malaysian exports became the country's primary growth engine[citation needed]. Malaysia consistently achieved more than 7% GDP growth along with low inflation in the 1980s and the 1990s.[6] Today, Malaysia is one of the world's largest computer hard disk manufacturing sites.
The Southeast Asian nation experienced an economic boom and underwent rapid development during the late 20th century and has a GDP per capita of $14,400, being considered a newly industrialized country. As one of three countries that control the Strait of Malacca, international trade plays a large role in its economy. At one time, it was the largest producer of tin, rubber and palm oil in the world. Manufacturing has a large influence in the country's economy.
Its indigenous labor workforce has been supplemented by immigrants who continue to contribute to Malaysia’s growth. The economy has always been exceptionally open to external influences such as globalization. Foreign capital has played a major role throughout.
The Malaysian Ringgit was unpegged from the U.S. dollar in 2005 leading to the currency appreciating by 6% against the dollar in 2006. The country’s GDP is projected to grow at 5.6% in 2008. Short-term foreign debt remains low, although reserves remain adequate. Low inflation persists.
In March 2005, the United Nations Conference on Trade and Development (UNCTAD) published a paper on the sources and pace of Malaysia's recovery, written by Jomo K.S. of the applied economics department, University of Malaya, Kuala Lumpur. The paper concluded that the controls imposed by Malaysia's government neither hurt nor helped recovery. The chief factor was an increase in electronics components exports, which was caused by a large increase in the demand for components in the United States, which was caused, in turn, by a fear of the effects of the arrival of the year 2000 (Y2K) upon older computers and other digital devices.
However, the post Y2K slump of 2001 did not affect Malaysia as much as other countries. This may have been clearer evidence that there are other causes and effects that can be more properly attributable for recovery. One possibility is that the currency speculators had run out of finance after failing in their attack on the Hong Kong dollar in August 1998 and after the Russian ruble collapsed. (See George Soros)
Regardless of cause and effect claims, rejuvenation of the economy also coincided with massive government spending and budget deficits in the years that followed the crisis. Later, Malaysia enjoyed faster economic recovery compared to its neighbours. The country has recovered to the levels of the pre-crisis era – as an example, the Kuala Lumpur Composite Index hit an all time high of 1,386 on 20 June 2007 which is approximately 100 points higher than the pre-crisis record of 1,275 in 1993.
While the pace of development today is not as rapid, it is seen to be more sustainable. Although the controls and economic housekeeping may or may not have been the principal reasons for recovery, there is no doubt that the banking sector has become more resilient to external shocks. The current account has also settled into a structural surplus, providing a cushion to capital flight. Asset prices are generally back to their pre-crisis heights, despite the effects of the global financial crisis. Malaysia is also the world's largest Islamic banking and financial centre.
As an oil and gas exporter, Malaysia has profited from higher world energy prices recently. Yet, the slowdown in the U.S. economy is bound to have some ripple effects here too. Historically, Malaysia’s economy has always been dependent on a limited range of products. Unfortunately, if the trend continues, the Malaysian economy will remain heavily dependent on electronic exports ($60.2 billion or 62% of total exports). Slower demand for electronic goods in particular and the possibility of further global financial market turbulence may be of some concern to Malaysia going forward.
According to World Bank, Malaysia ranks 24th in Ease of doing business. Malaysia's strengths in the rank includes getting credit (rank 3rd), protecting investor (ranked 4th) and doing trade across borders (ranked 21st). Weaknesses include dealing with licenses (ranked 105th). The study ranks 178 countries in all aspect of doing business. In the investor protection category of the survey, Malaysia had scored a perfect 10 for the extent of disclosure, nine for director liability and seven for shareholder suits.
The government is moving towards a more business friendly environment by setting up a special task force to facilitate business called PEMUDAH, which means "simplifier" in Malay. Highlights includes easing restrictions and requirement to hire expatriates, shorten time to do land transfers and increasing the limit of sugar storage (a controlled item in Malaysia) for companies. The efforts of PEMUDAH is beginning to show fruits as their ranking improved to number 20 in 2009, with marked improvement in four areas: getting credit; dealing with construction permits; paying taxes; and enforcing contracts.
According to the vision Wawasan 2020 foresees a strong and confident Malaysia – powerful in the ASEAN region already, but embracing the world stage – the towering Petronas Twin Towers that loom over Kuala Lumpur an accurate symbol of this vision.[7]
Philippines
Main article: Economy of the PhilippinesRepublic of the Philippines 
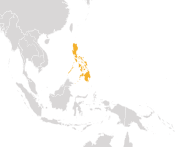
The Republic of the Philippines is rich in human and natural resources. It was once the second largest economy in Asia next only to Japan. It had strong economic growth, high standard of living, major infrastructure developments and one of the best education systems in Asia during the twenty year rule of President Ferdinand Marcos. Allegations of corruption and cronyism plagued the Marcos administration. It was in the late 1980s that the Philippines was called the "sick man of Asia" as the economy suddenly collapsed. Capital flight remained after the assassination of opposition leader Benigno Aquino II. Marcos’ removal from office ushered in a new era for the Philippines, although corruption reached new levels during this period resulting to a further decline of the economy. Then, under Fidel V. Ramos, the government embarked on a development plan called ‘Philippines 2000’, which enhanced privatization in key industries like banking, electricity, telecommunications, shipping and oil. The Ramos administration's policies transformed the Philippines into Asia's new tiger economy.
Unlike other countries in the region, the Philippines contracted less dramatically during the Asian crisis of 1997, though inflation soared. In 2010, inflation was 3.8%, well below the double-digit inflation levels during the crisis. It should be noted that the Philippines was the first country to bounce back from recession among its neighbours.
Historically, the agricultural sector in the Philippines has underperformed, considering that it employs about 36% of the labor force even while contributing just 13.6% to the Gross Domestic Product (GDP). Bananas, sugar, pineapples and coconuts are some of the most important cash crops, and the Philippines remains one of the world’s leading producers of coconut products. In one of the most stunning cases of environmental degradation, the Philippines has turned from being one of the world’s biggest exporters of tropical hardwoods in the 1970s to being a net importer of forest products by 1990s.
Industry contributes to 33.2% of the GDP, with consumer goods such as processed goods, coal, and garments dominating the manufacturing sector. Metro Manila and CALABARZON serve as the country's major industrial centers. Mining was once one of the predominant industries, with the Philippines blessed with minerals like copper, gold, silver, chromium and lead. The closure of several mines and crumbling infrastructure coupled with worries about environmental havoc, have led to the decline of the mining industry. Encouragingly, Gloria Macapagal Arroyo’s government has announced a change in policy from ‘tolerance to promotion of mining.’
The Philippines is the second largest producer of geothermal power in the world after the U.S., and geothermal power accounts for about 50% of domestic power generation, followed by hydropower, which accounts for about 33%.[citation needed] The domestic power mix is 2/3 from fossil fuels as of 2004.[8]
One of the most competitive aspects of the Philippine economy has been the rapid growth of its services sector since 1980. Contributing to 53.2% of the GDP in 2006, segments such as telecommunications, business outsourcing and financial services have leapfrogged into the limelight, making the country one of the fastest growing BPO (Back Office Processing) destinations in the world.
Metro Manila and Cebu are some of the many which support a growing back office processing business in the Philippines. With the fifth largest English speaking population in the world, the country’s BPO sector is forecasted to earn $10 billion by 2010.
Owing to foreign investments the country became the 5th largest shipbuilding nation with 1.5% share of the global shipbuilding industry next to South Korea(50.6%), China(34.4), EU(5.7%) and Japan(3.7%).
A member of the World Trade Organization, the Philippines’ most important trading partners remain the U.S. and Japan, with the Netherlands, Hong Kong, People's Republic of China and Singapore also contributing to a significant share of its exports.
According to 2005 figures, life expectancy at birth was 68.9 for males, 73.3 for women, and 71 years overall. Although health status improvement has been slow compared to other countries in the region, the Filipinos are in a better state of health now than 50 years ago, according to data by the World Health Organization (WHO).
In 2007, the country’s economy grew at a rate of 7.3%, its fastest pace in 31 years, despite the slowdown in the U.S., its main trading partner. The government promises that it can maintain a 2008 target of 6.3% -7% growth and keep inflation well below the 5% level. The Philippine peso was one of Asia's top-performing currencies in 2007. Yet, concerns remain over the country’s ability to sustain its growth, especially as the U.S. remains the Philippines’ largest investor with more than $6.5 billion in total Foreign Direct Investment (FDI).[9]
The Philippines is one of the few countries that has successfully resisted the onslaught of the Financial crisis of 2007–2010. Despite the political problems that it has been facing for years, the Philippine economy has proven its resiliency and has a positive outlook on its future.
Thailand
Main article: Economy of ThailandKingdom of Thailand 
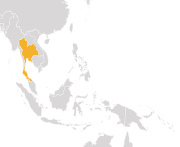
The Kingdom of Thailand’s economy is characterized by years of neglect during its unstable formative years following World War II to a decade of continuous growth from 1985. Ten years later, Thailand was one of the world’s fastest-growing economies with an average growth of around 9% annually. During this period, the percentage of population living in poverty fell from 23% in 1981 to less than 10% in 1994. However, the disastrous slump of 1997 triggered a severe recession. During his reelection in 2001, Prime Minister Thaksin Shinawatra introduced a set of policies that came to be collectively known as Thaksinomics. These were mainly populist measures that tried to reverse the devastation and havoc wreaked by the 1997 Asian financial crisis.
Thaksin provided a three-year debt moratorium for farmers, heavily subsidized both gasoline and diesel, and began a universal medical program that offered almost free, basic healthcare to the rural poor. Importantly, the village-level business loans helped to revitalize grass-roots manufacturing and services and his emphasis on infrastructure created mega projects, attracting investment, and helping Thailand’s economy grow by nearly 6% between 2001 and 2006.
Today, the country is classified as a middle-income country in Southeast Asia, and continues to make rapid economic and social progress. Despite political turmoil during much of the 2000s and widespread economic difficulties in Europe and the United States, the country's GDP has continued to grow at significant rates, expanding at nearly 8% in 2010. Tourism has also grown sharply in spite of domestic politics, reaching an all-time high of nearly 16 million foreign visitors in 2010.
The economy is heavily export-oriented, with exports accounting for more than two-thirds of the Gross Domestic Product (GDP). With a population of 63.4 million (2006 World Bank Data) Thailand is classified as a upper middle-income country[10], having made the transition from low-income to middle-income (per capita income of $3000) within the span of just a few decades. Out of the four Tiger Cub economies, Thailand's GDP per capita is second highest.
Known as the “kitchen of the world,” Thailand is the world’s largest rice exporter. In January 2008, a looming global food crisis pushed the regional Thai grade B rice above $1000 a ton.
Large parts of the country are agricultural (around 44 million acres (180,000 km2) are under cultivation) with rice the leading crop. Agriculture contributes to around 11% of the GDP with major crops including rubber, corn, cotton, sugarcane and jute. The industrial sector has flourished with a contribution of 45% to the GDP, with Thailand serving as a hub for automotive manufacturing in the Southeast Asian region.
Major industries in the country also include textiles, electronics, cement and food processing. The services share of GDP was 45% in 2006. Including housing, retail trade, tourism, banking and finance, this sector has witnessed high growth in recent years, especially spurred by the popularity of Thailand as a major tourist destination in Southeast Asia. In 2007, international tourist arrivals numbered 14.46 million, a jump of 4.65% compared to 13.82 million tourists the year before. Inbound tourism generated revenues of baht 547,782 million ($16.5 billion) in 2007. Typically, tourism contributes to a staggering 6% of GDP, more than any other Asian nation. The U.S. and Japan remain Thailand’s largest trading partners, although the creation of the Association of Southeast Asian Nations (ASEAN) Free Trade Agreement in 2002 has meant that Thailand has increased trade with other Asian economies.
The Thai economy is the world’s 67th freest economy, according to the Index of Economic Freedom for 2009. In the Asia-Pacific region, Thailand was ranked tenth out of 41 countries, as the country scored high on factors such as monetary freedom and investment freedom. Life expectancy at birth is 69.9 years, according to 2005 annual estimates. For women, life expectancy at birth is 74.5 years, while for men it is 65.0 years. The capital of Bangkok remains the economic, political, cultural, and commercial heart of Thailand – contributing to almost 60% of the GDP despite having less than 20% of the nation’s population. [11] The capital's pace of growth with regard to investment and infrastructure development still far exceeds that of the rest of the country.
The Tiger Cubs Today
This list contains the superlative economic achievements of the tiger cub economies. Information on Thailand and Malaysia is not available.
 Kuala Lumpur
 Metropolitan Manila
 Bangkok
 Jakarta
Country Achievement Field Date  Indonesia
Largest palm oil producer, output of 15,900,000 tons Agriculture 2006 IndonesiaLargest cinnamon producer, output of 60,000 tons Agriculture 2005 IndonesiaLargest clove producer, output of 110,000 tons Agriculture 2005 IndonesiaLargest area of permanent crops, 128,581 km² Agriculture
Geography2005  Malaysia
Tallest Twin Towers, 452 m Culture 2010  Philippines
Largest coconut producer, output of 17,000,000 tons Agriculture 2008 PhilippinesLargest Shipbuilding nation in SEA, output of 400,000 gross tons Industry 2008  Thailand
Largest Rice Exporter[11] Agriculture 2009 Territory and region data
Demographics
Country or
territoryArea km² Population Population density
per km²HDI (2010) Capital Indonesia1,910,931 237,556,363 124 0.600 Jakarta Malaysia330,803 28,250,500 85 0.744 Kuala Lumpur, Putrajaya Philippines300,000 94,013,200 313 0.638 Manila Thailand513,120 67,070,000 131 0.654 Bangkok Economy
Country or
territoryGDP nominal
millions of USD (2009)GDP PPP
millions of USD (2009)GDP nominal per capita
USD (2009)GDP PPP per capita
USD (2009) Indonesia539,377 962,471 2,329 4,151 Malaysia192,955 384,119 6,950 13,800 Philippines161,196 320,384 1,748 3,516 Thailand263,979 546,095 3,941 8,051 Politics
Country or
territoryDemocracy Index
(2010)Press Freedom Index
(2010)Corruption Perceptions Index
(2010)Political Status Indonesia6.53 35.83 2.8 Unitary Presidential Republic Malaysia6.19 50.75 4.4 Federal Constitutional Elective Monarchy and Parliamentary Democracy Philippines6.12 60.00 2.4 Unitary Presidential Constitutional Republic Thailand6.55 56.83 3.5 Constitutional Monarchy and Parliamentary Democracy The Tiger Cubs in the Future
Future GDP
All of the figures shown are calculated by the International Monetary Fund, and are in International dollars.
GDP (PPP) per capita list (sortable; in international dollars)[12] Country 2009 2010 2011 2012 2013 2014 Estimate as of Malaysia13,551.394 13,869.030 14,392.045 15,195.960 16,148.905 17,160.275 October 2009 Thailand7,998.445 8,338.503 8,750.610 9,259.348 9,908.203 10,601.703 October 2009 Indonesia4,149.380 4,356.391 4,579.963 4,854.887 5,179.712 5,541.479 October 2009 Philippines3,536.223 3,635.074 3,752.025 3,912.515 4,086.977 4,268.886 October 2009 All of the figures shown are calculated by the International Monetary Fund, and are in United States dollars.
GDP (nominal) per capita list (sortable; in United States dollars)[13] Country 2009 2010 2011 2012 2013 2014 Estimate as of Malaysia7,468.991 7,656.940 8,014.050 8,521.330 9,103.663 9,725.792 October 2009 Thailand3,972.987 4,168.637 4,399.357 4,660.487 4,984.137 5,330.263 October 2009 Indonesia2,223.876 2,424.097 2,576.527 2,746.684 2,940.180 3,149.431 October 2009 Philippines1,720.785 1,819.725 1,873.879 1,942.658 2,013.962 2,087.882 October 2009 All of the figures shown are calculated by the International Monetary Fund, and are in International dollars. The list is in billions of dollars.
Purchasing power parity GDP list (sortable) Country 2009 2010 2011 2012 2013 2014 Estimate as of Indonesia960.776 1,021.822 1,088.228 1,168.547 1,262.938 1,368.711 October 2009 Thailand536.388 564.784 598.624 639.761 691.438 747.232 October 2009 Malaysia376.206 391.570 413.244 443.744 479.589 518.288 October 2009 Philippines326.134 341.745 359.795 382.688 407.748 434.414 October 2009 The table is initially sorted according to the left-most ranking.
Nominal GDP table (sortable; amounts in billions of US$) Country 2009 2010 2011 2012 2013 2014 Estimate as of Indonesia514.931 568.589 612.199 661.113 716.887 777.890 October 2009 Thailand266.434 282.351 300.957 322.009 347.815 375.689 October 2009 Malaysia207.350 216.181 230.110 248.835 270.360 293.746 October 2009 Philippines158.702 171.078 179.693 190.014 200.928 212.469 October 2009 Indonesia and the Philippines are two more dominant ASEAN states as seen by their strong and resilient economies which were able to resist the impact of the global recession Both countries are listed in the Next 11 emerging economies of the world. These two countries were also projected to be one of the top 20 economies together with the BRIC economies by 2050
Gross Domestic Product (nominal) [2006-2050] (in US$ millions)[14] Rank Country 2010 2025 2050 1  United States
14,535,000 20,087,000 38,514,000 4  China
China4,667,000 25,610,000 70,710,000 9  Brazil
1,346,000 2,831,000 11,366,000 10  Russia
1,371,000 3,341,000 8,580,000 11  India
India1,256,000 4,316,000 37,668,000 15 Indonesia419,000 1,479,000 7,010,000 19 Philippines162,000 582,000 3,010,000 Gross Domestic Product per capita (nominal) [2006-2050][14] Rank Country 2010 2025 2050 1 United States47,014 57,446 91,683 10 Russia9,833 26,061 78,576 11 Brazil6,882 12,996 49,759 14 China3,463 12,688 49,650 15 Indonesia1,724 3,711 22,395 16 Philippines1,688 3,372 20,388 19 India1,061 2,979 20,836 See also
- Asian Century
- Four Asian Tigers
- BRIC
- N-11
- Newly industrialized countries
- Gulf Tiger
- Tatra Tiger
- Baltic Tiger
- Celtic Tiger
- Nordic Tiger
- Anatolian Tigers
- 1997 Asian financial crisis
References
- ^ asia market research
- ^ a b c d "Asian Marketing, Market Research and Economic Capsule Review". http://www.asiamarketresearch.com/asia/.
- ^ a b "Sound, Stable Indonesia". Forbes.com. 17 July 2009. http://www.forbes.com/2009/07/17/indonesia-jakarta-economy-hotels-opinions-contributors-yudhoyono.html. Retrieved 2010-04-12.
- ^ http://www.thomaswhite.com/explore-the-world/indonesia.aspx
- ^ "Indonesia economy performing well". BBC. 2010-02-19. http://news.bbc.co.uk/2/hi/business/8524738.stm. Retrieved 2010-04-12.
- ^ "How can Sri Lanka be transformed into Malaysia and Singapore? by Rajkumar Kanagasingam". Wijeya Newspapers Ltd, Sri Lanka[Daily Mirror]. 17 November 2005. http://www.dailymirror.lk/2005/11/17/ft/14.asp. Retrieved 28 March 2008.[dead link]
- ^ http://www.thomaswhite.com/explore-the-world/malaysia.aspx
- ^ http://www.senate.gov.ph/publications/AG%202005-07%20-%20Electric%20Power.pdf
- ^ http://www.thomaswhite.com/explore-the-world/philippines.aspx
- ^ http://www.worldbank.or.th/WBSITE/EXTERNAL/COUNTRIES/EASTASIAPACIFICEXT/THAILANDEXTN/0,,contentMDK:22994296~menuPK:50003484~pagePK:2865066~piPK:2865079~theSitePK:333296,00.html
- ^ a b http://www.thomaswhite.com/explore-the-world/thailand.aspx
- ^ International Monetary Fund, [1].
- ^ International Monetary Fund, [2].
- ^ a b "The N-11: More Than an Acronym" - Goldman Sachs study of N11 nations, Global Economics Paper No: 153, March 28, 2007.
Categories:- Asia
- Economic booms
- Economy of Southeast Asia
- Economy of Indonesia
- Economy of Malaysia
- Economy of the Philippines
- Economy of Thailand


Wikimedia Foundation. 2010.