- Demographics of Belarus
-
 Belarus: Population and rural population 1913-2008 (beginning of year). Source: official statistics from BelStat.
The Demographics of Belarus is about the demographic features of the population of Belarus, including population growth, population density, ethnicity, education level, health, economic status, religious affiliations, and other aspects of the population. The ethnic majority in Belarus call themselves Belarusians.
Contents
Demographic trends
The population of Belarus suffered a dramatic decline during World War II, dropping from more than 9 million in 1940 to 7.7 million in 1951. It then resumed its long-term growth, rising to 10 million in 1999.[1] After that the population began a steady decline, dropping to 9.7 million in 2006-2007.[2] Originally a highly agrarian country with nearly 80% of its population in rural areas, Belarus has been undergoing a process of continuous urbanization. The share of its rural population decreased from 70% in 1959 to less than 30% in the 2000s.[3]
Population change in Belarus, 1970 - 2010[4] 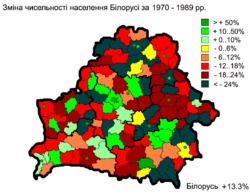
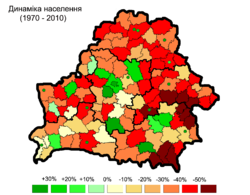
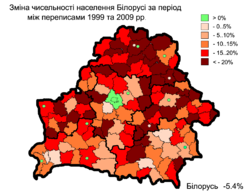
1970 - 1989 1970 - 2010 1999 - 2010 Ethnic groups
- Belarusians 81.2%, Russians 11.4%, Poles 3.9%, Ukrainians 2.4%, Jews 0.3%, Armenians 0.1%, Lipka Tatars 0.1%, Ruska Roma 0.1%, Lithuanians 0.1%, Azeris 0.1%, others 0.3% (1999 census).[1]
Prior to WW II
Prior to World War II, Jews were the second largest ethnic group in Belarus, and at 400,000 in the 1926 and 1939 censuses they even exceeded the number of Russians (although admittedly by a small margin).[5] Jews accounted for 7%-8% of the total population at that time, comprising more than 40% of the population in cities and towns, where Jews and Poles were the majority, while Belarusians mostly lived in rural areas.
The Poles were the fourth largest ethnic group before World War II, comprising 1%-2% of the population in the pre-war censuses (less than 100,000).[5]
Population of the Byelorussian SSR according to ethnic group 1926–1939 Ethnic
groupcensus 19261 census 19392 Number % Number % Belarusians 4,017,301 80.6 4,615,496 82.9 Jews 407,059 8.2 375,092 6.7 Russians 383,806 7.7 364,705 6.6 Ukrainians 34,681 0.7 104,247 1.9 Poles 97,498 2.0 58,380 1.1 Germans 7,075 0.1 8,448 0.2 Latvians 14,080 0.3 8,117 0.2 Tatars 3,777 0.1 7,664 0.1 Lithuanians 6,864 0.1 4,284 0.1 Roma 2,366 0.1 3,632 0.1 Mordvins 1,051 0.0 2,042 0.0 Others 7,682 0.2 16,887 0.3 Total 4,983,240 5,568,994 1 Source: [3]. 2 Source: [4]. After WW II
The Holocaust decimated the Jewish population in Belarus, and after World War II, in 1959, Jews accounted for only 1.9% of the population. Since then, Jewish emigration to Israel and other countries reduced the number of Jews to 0.1% of the population (13,000 in 2009).
After the war, a large number of Poles (including Catholic Belarusians) were forced to move to Poland. In exchange, Belarusians from the former Belastok Voblast, which was returned to Poland in 1945, after being occupied in 1939 were displaced to Belarus. Due to changes in the western border of Belarus and Poland after World War II (see territorial changes of Poland), the number of Poles in Belarus increased to more than 500,000 according to the first post-war census (1959) and to about 400,000 according to the 1999 census. Poles are now the third largest ethnic group in Belarus (see Polish minority in Belarus). There is around 15,000 of Lipka Tatars. Armenians and Ruska Roma (Russian Gypsies) account for about 10,000 each.
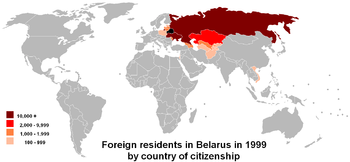
In the post-war period Belarus experienced an influx of workers from other parts of the Soviet Union, for example Russians and Ukrainians. The decade after independence saw a decline in the population of most of these minority groups, either by assimilation or emigration. The most significant exception to this trend has been a continued (if small-scale) net immigration of Armenians and Azeris, whose numbers increased from less than 2,000 in 1959 to around 10,000 in 1999.[1]
Ethnic composition of Belarus according to 2009 census 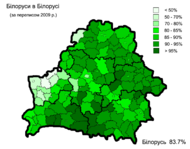
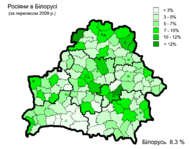
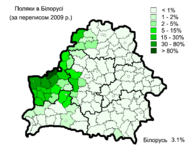
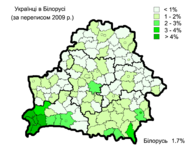
Belarusian Russians Poles Ukrainians Population of Belarus according to ethnic group 1959-2009 Ethnic
groupcensus 19591 census 19702 census 19793 census 19894 census 19995 census 20096 Number % Number % Number % Number % Number % Number % Belarusians 6,532,035 81.1 7,289,610 81.0 7,567,955 79.4 7,904,623 77.9 8,158,900 81.2 7,957,252 83.7 Russians 659,093 8.2 938,161 10.4 1,134,117 11.9 1,342,099 13.2 1,141,700 11.4 785,084 8.3 Poles 538,881 6.7 382,600 4.3 403,169 4.2 417,720 4.1 395,700 3.9 294,549 3.1 Ukrainians 133,061 1.7 190,839 2.1 230,985 2.4 291,008 2.9 237,000 2.4 158,723 1.7 Jews 150,084 1.9 148,011 1.6 135,450 1.4 111,975 1.1 27,800 0.3 12,926 0.1 Armenians 1,751 0.0 2,362 0.0 2,751 0.0 4,933 0.1 10,200 0.1 8,512 0.1 Tatars 8,650 0.1 9,992 0.1 10,851 0.1 12,436 0.1 10,100 0.1 7,316 0.1 Romani 4,662 0.1 6,843 0.1 8,408 0.1 10,762 0.1 9,900 0.1 7,316 0.1 Azeri 1,402 0.0 1,335 0.0 2,654 0.0 5,009 0.1 6,300 0.1 5,567 0.1 Lithuanians 8,363 0.1 8,092 0.1 6,993 0.1 7,606 0.1 6,400 0.1 5,087 0.1 Others 16,666 0.2 24,493 0.3 29,183 0.3 43,635 0.4 41,200 0.4 261,712 2.8 Total 8,054,648 9,002,338 9,532,516 10,151,806 10,045,200 9,503,807 1 Source: [5]. 2 Source: [6]. 3 Source: [7]. 4 Source: [8]. 5 Source: [9]. 6 Source: [10]. Vital statistics since 1950 [6] [7]
Average population (x 1000) Live births Deaths Natural change Crude birth rate (per 1000) Crude death rate (per 1000) Natural change (per 1000) 1950 (e) 7 745 197 500 62 000 135 500 25.5 8.0 17.5 1951 (e) 7 765 194 900 62 900 132 000 25.1 8.1 17.0 1952 (e) 7 721 195 300 61 800 133 500 25.3 8.0 17.3 1953 (e) 7 690 195 300 60 800 134 500 25.4 7.9 17.5 1954 (e) 7 722 195 400 61 000 134 400 25.3 7.9 17.4 1955 (e) 7 804 194 300 57 700 136 600 24.9 7.4 17.5 1956 (e) 7 880 199 400 54 400 145 000 25.3 6.9 18.4 1957 (e) 7 936 200 800 56 300 144 500 25.3 7.1 18.2 1958 (e) 8 009 207 400 52 100 155 300 25.9 6.5 19.4 1959 (e) 8 112 204 400 56 000 148 400 25.2 6.9 18.3 1960 8 190 200 218 54 037 146 181 24.4 6.6 17.8 1961 8 284 194 239 53 682 140 557 23.4 6.5 17.0 1962 8 385 185 302 60 676 124 626 22.1 7.2 14.9 1963 8 458 173 889 58 291 115 598 20.6 6.9 13.7 1964 8 519 161 794 53 967 107 827 19.0 6.3 12.7 1965 8 607 153 865 58 156 95 709 17.9 6.8 11.1 1966 8 709 153 414 58 265 95 149 17.6 6.7 10.9 1967 8 800 147 501 61 263 86 238 16.8 7.0 9.8 1968 8 877 146 095 62 354 83 741 16.5 7.0 9.4 1969 8 957 142 652 65 912 76 740 15.9 7.4 8.6 1970 9 038 146 676 68 974 77 702 16.2 7.6 8.6 1971 9 112 149 135 68 511 80 624 16.4 7.5 8.8 1972 9 178 147 813 71 866 75 947 16.1 7.8 8.3 1973 9 245 144 729 73 927 70 802 15.7 8.0 7.7 1974 9 312 146 876 73 181 73 695 15.8 7.9 7.9 1975 9 367 146 517 79 701 66 816 15.6 8.5 7.1 1976 9 411 147 912 82 400 65 512 15.7 8.8 7.0 1977 9 463 148 963 84 565 64 398 15.7 8.9 6.8 1978 9 525 151 053 86 612 64 441 15.9 9.1 6.8 1979 9 590 151 800 90 837 60 963 15.8 9.5 6.4 1980 9 658 154 432 95 514 58 918 16.0 9.9 6.1 1981 9 732 157 899 93 136 64 763 16.2 9.6 6.7 1982 9 804 159 364 93 840 65 524 16.3 9.6 6.7 1983 9 872 173 510 97 849 75 661 17.6 9.9 7.7 1984 9 938 168 749 104 274 64 475 17.0 10.5 6.5 1985 9 999 165 034 105 690 59 344 16.5 10.6 5.9 1986 10 058 171 611 97 276 74 335 17.1 9.7 7.4 1987 10 111 162 937 99 921 63 016 16.1 9.9 6.2 1988 10 144 163 193 102 671 60 522 16.1 10.1 6.0 1989 10 171 153 449 103 479 49 970 15.1 10.2 4.9 1990 10 190 142 167 109 582 32 585 14.0 10.8 3.2 1991 10 194 132 045 114 650 17 395 13.0 11.2 1.7 1992 10 217 127 971 116 674 11 297 12.5 11.4 1.1 1993 10 240 117 384 128 544 -11 160 11.5 12.6 -1.1 1994 10 227 110 599 130 003 -19 404 10.8 12.7 -1.9 1995 10 194 101 144 133 775 -32 631 9.9 13.1 -3.2 1996 10 160 95 798 133 422 -37 624 9.4 13.1 -3.7 1997 10 118 89 586 136 653 -47 067 8.9 13.5 -4.7 1998 10 069 92 645 137 296 -44 651 9.2 13.6 -4.4 1999 10 032 92 975 142 027 -49 052 9.3 14.2 -4.9 2000 10 005 93 691 134 867 -41 176 9.4 13.5 -4.1 2001 9 971 91 720 140 299 -48 579 9.2 14.1 -4.9 2002 9 925 88 743 146 665 -57 922 8.9 14.8 -5.8 2003 9 874 88 512 143 200 -54 688 9.0 14.5 -5.5 2004 9 825 88 943 140 064 -51 121 9.1 14.3 -5.2 2005 9 775 90 508 141 857 -51 349 9.3 14.5 -5.3 2006 9 732 96 721 138 426 -41 705 9.9 14.2 -4.3 2007 9 702 103 626 132 993 -29 367 10.7 13.7 -3.0 2008 9 592 107 876 133 879 -26 003 11.2 14.0 -2.7 2009 9 487 109 813 135 056 -25 243 11.6 14.2 -2.7 2010 9 481 108 123 137 305 -29 182 11.4 14.5 -3.1 (e)=estimate
Languages
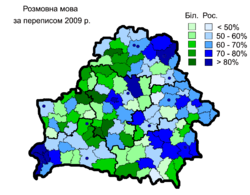
Main article: Languages of BelarusBelarusian and Russian are the official languages according to the Constitution of Belarus (Article 17). The constitution guarantees preservation of the cultural heritage of all ethnic minorities, including their languages (Article 15). Russian, and not Belarusian, is the dominant language in Belarus, spoken normally at home by 63% of the population (1999 census).
Languages of Belarus according to 2009 census (green - Belarusian, blue - Russian) 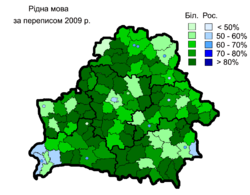
Native languages Spoken languages CIA World Factbook demographic statistics
 Population pyramid of Belarus
The following demographic statistics are from the CIA World Factbook, unless indicated otherwise.
Population
- 9,648,533 (July 2009 est.)
- country comparison to the world: 87
Age structure
- 0-14 years: 14.3% (male 707,550/female 667,560)
- 15-64 years: 71.3% (male 3,337,253/female 3,540,916)
- 65 years and over: 14.5% (male 446,746/female 948,508) (2009 est.)
Median age
- Total: 38.6 years
- Male: 35.6 years
- Female: 41.6 years (2009 est.)
Population growth rate
- -0.378% (2009 est.)
- country comparison to the world: 225
Net migration rate
- 0.38 migrant(s)/1,000 population (2009 est.)
- country comparison to the world: 68
Urbanization
- Urban population: 73% of total population (2008)
- Rate of urbanization: 0% annual rate of change (2005-10 est.)
Sex ratio
- At birth: 1.06 male(s)/female
- Under 15 years: 1.06 male(s)/female
- 15-64 years: 0.94 male(s)/female
- 65 years and over: 0.47 male(s)/female
- Total population: 0.87 male(s)/female (2009 est.)
Infant mortality rate
- Total: 6.43 deaths/1,000 live births
- country comparison to the world: 177
- Male: 7.45 deaths/1,000 live births
- Female: 5.36 deaths/1,000 live births (2009 est.)
Life expectancy at birth
- Total population: 70.63 years
- country comparison to the world: 141
- Male: 64.95 years
- Female: 76.67 years (2009 est.)
Total fertility rate
- 1.24 children born/woman (2009 est.)
- country comparison to the world: 214
HIV/AIDS
- Adult prevalence rate: 0.2% (2007 est.)
- country comparison to the world: 104
- People living with HIV/AIDS: 13,000 (2007 est.)
- country comparison to the world: 91
- Deaths: 1,100 (2007 est.)
- country comparison to the world: 69
Nationality
- Noun: Belarusian(s)
- Adjective: Belarusian
Religions
According to 1997 estimates, 80% of the religious population belonged to the Eastern Orthodox Church and the others are mainly Roman Catholic, Protestants, Muslims, and Jews.[8]
Literacy
- Definition: age 15 and over who can read and write
- Total population: 99.6%
- Male: 99.8%
- Female: 99.5% (2003 est.)
Education expenditure
- 6.1% of GDP (2006)
- country comparison to the world: 39
See also
References
- ^ a b c Ethnic composition of the population, 1999 Belarus Census.
- ^ Population estimates 1995-2007, BelStat
- ^ Statistical Yearbook of the Republic of Belarus 2007, BelStat, Minsk, 2007
- ^ http://pop-stat.mashke.org/belarus-division.htm
- ^ a b Ethnic composition of Belarus: 1926 and 1939 censuses
- ^ [1] United Nations. Demographic Yearbooks
- ^ [2] National Statistical Committee of the Republic of Belarus
- ^ https://www.cia.gov/library/publications/the-world-factbook/geos/bo.html
 This article incorporates public domain material from the CIA World Factbook document "2009 edition".
Demographics of Europe Sovereign
states- Albania
- Andorra
- Armenia
- Austria
- Azerbaijan
- Belarus
- Belgium
- Bosnia and Herzegovina
- Bulgaria
- Croatia
- Cyprus
- Czech Republic
- Denmark
- Estonia
- Finland
- France
- Georgia
- Germany
- Greece
- Hungary
- Iceland
- Ireland
- Italy
- Kazakhstan
- Latvia
- Liechtenstein
- Lithuania
- Luxembourg
- Macedonia
- Malta
- Moldova
- Monaco
- Montenegro
- Netherlands
- Norway
- Poland
- Portugal
- Romania
- Russia
- San Marino
- Serbia
- Slovakia
- Slovenia
- Spain
- Sweden
- Switzerland
- Turkey
- Ukraine
- United Kingdom
- (England
- Northern Ireland
- Scotland
- Wales)
- Vatican City
States with limited
recognition- Abkhazia
- Kosovo
- Nagorno-Karabakh
- Northern Cyprus
- South Ossetia
- Transnistria
Dependencies
and other territories- Åland
- Faroe Islands
- Gibraltar
- Guernsey
- Jan Mayen
- Jersey
- Isle of Man
- Svalbard
Other entities - European Union
Ethnic groups in Europe Sovereign
states- Albania
- Andorra
- Armenia
- Austria
- Azerbaijan
- Belarus
- Belgium
- Bosnia and Herzegovina
- Bulgaria
- Croatia
- Cyprus
- Czech Republic
- Denmark
- Estonia
- Finland
- France
- Georgia
- Germany
- Greece
- Hungary
- Iceland
- Ireland
- Italy
- Kazakhstan
- Latvia
- Liechtenstein
- Lithuania
- Luxembourg
- Macedonia
- Malta
- Moldova
- Monaco
- Montenegro
- Netherlands
- Norway
- Poland
- Portugal
- Romania
- Russia
- San Marino
- Serbia
- Slovakia
- Slovenia
- Spain
- Sweden
- Switzerland
- Turkey
- Ukraine
- United Kingdom
- (England
- Northern Ireland
- Scotland
- Wales)
States with limited
recognition- Abkhazia
- Kosovo
- Nagorno-Karabakh
- Northern Cyprus
- South Ossetia
- Transnistria
Dependencies
and other territories- Åland
- Faroe Islands
- Gibraltar
- Guernsey
- Jan Mayen
- Jersey
- Isle of Man
- Svalbard
Other entities Categories:


Wikimedia Foundation. 2010.