- Demographics of the Czech Republic
-
This article is about the demographic features of the population of the Czech Republic, including population density, ethnicity, education level, health of the populace, economic status, religious affiliations and other aspects of the population.
Contents
Population
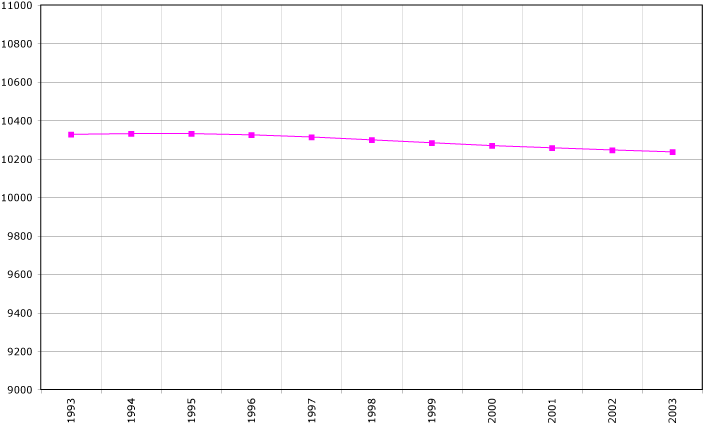
 Population of the Czech Republic, Data of FAO, year 2009 ; Number of inhabitants in millions.
With an estimated population of 10,542,080 at 30 June 2011, compared to 9.3 million at the beginning of the twentieth century, the population growth of the Czech Republic was limited and characterized by low fertility rates and loss of population in and around WW I and WW II. Population loss during WW I was approximately 350,000. At the beginning of WW II population the Czech Republic reached its maximum (11.2 million). Due to the expulsion of the German residents after WW II the Czech Republic lost about 3 million inhabitants and in 1947 the population was only 8.8 million. Population growth resumed until 1994 when the population was 10.3 million. From 1994-2005 natural growth was negative and the population decreased to 10.2 million. Since 2006, natural growth has been positive, but the most important factor for the recent population of the Czech Republic has been immigration, approximately 300,000 during the last decade.
Population census
Population of the Czech Republic Census date population 31 Dec 1857 7 016 531 31 Dec 1869 7 617 230 31 Dec 1880 8 222 013 31 Dec 1890 8 665 421 31 Dec 1900 9 372 214 31 Dec 1910 10 078 637 15 Feb 1921 10 009 587 1 Dec 1930 10 674 386 1 Mar 1950 8 896 133 1 Mar 1961 9 571 531 1 Dec 1970 9 807 697 1 Nov 1980 10 291 927 3 Mar 1991 10 302 215 1 Mar 2001 10 230 060
The following statistics on age structure and sex ration are from the CIA World Factbook.Age structure
2007
0–14 years: 14.2% (male 758,305; female 718,618)
15–64 years: 71.2% (male 3,726,148; female 3,665,225)
65 years and over: 14.6% (male 598,481; female 914,353)2006
0–14 years: 14.4% (male 760,065; female 719,449)
15–64 years: 71.2% (male 3,683,215; female 3,642,023)
65 years and over: 14.4% (male 582,904; female 899,533)2005
0–14 years: 14.7% (male 773,028; female 731,833)
15–64 years: 71.1% (male 3,651,018; female 3,627,006)
65 years and over: 14.2% (male 565,374; female 892,879)2004
0–14 years: 14.9% (male 784,186; female 742,760)
15–64 years: 71.0% (male 3,638,782; female 3,620,219)
65 years and over: 14.0% (male 557,945; female 876,685)2003
0–14 years: 15.2% (male 797,847; female 756,628)
15–64 years: 70.8% (male 3,625,092; female 3,608,696)
65 years and over: 13.9% (male 551,801; female 871,391)Sex ratio
at birth: 1.06 male(s)/female
under 15 years: 1.06 male(s)/female
15–64 years: 1.01 male(s)/female
65 years and over: 0.65 male(s)/female
total population: 0.96 male(s)/female (2007 est.)Vital statistics
Births and deaths[1]
Average population (x 1000) Live births Deaths Natural change Crude birth rate (per 1000) Crude death rate (per 1000) Natural change (per 1000) 1900 9 334 330 662 227 920 102 742 35.4 24.4 11.0 1901 9 405 325 514 221 052 104 462 34.6 23.5 11.1 1902 9 475 333 619 222 457 111 162 35.2 23.5 11.7 1903 9 545 318 275 218 448 99 827 33.3 22.9 10.5 1904 9 615 319 433 222 276 97 157 33.2 23.1 10.1 1905 9 685 300 414 232 999 67 415 31.0 24.1 7.0 1906 9 754 313 449 203 182 110 267 32.1 20.8 11.3 1907 9 825 306 356 210 721 95 635 31.2 21.4 9.7 1908 9 895 308 504 210 101 98 403 31.2 21.2 9.9 1909 9 965 305 426 210 047 95 379 30.6 21.1 9.6 1910 10 036 295 617 196 728 98 889 29.5 19.6 9.9 1911 10 099 289 058 206 266 82 792 28.6 20.4 8.2 1912 10 157 280 368 203 324 77 044 27.6 20.0 7.6 1913 10 221 275 060 190 475 84 585 26.9 18.6 8.3 1914 10 283 269 142 188 838 80 304 26.2 18.4 7.8 1915 10 286 197 542 201 280 -3 738 19.2 19.6 -0.4 1916 10 222 140 211 186 381 -46 170 13.7 18.2 -4.5 1917 10 128 126 916 188 649 -61 733 12.5 18.6 -6.1 1918 10 004 120 579 236 035 -115 456 12.1 23.6 -11.5 1919 9 922 189 675 177 428 12 247 19.1 17.9 1.2 1920 9 978 244 668 176 562 68 106 24.5 17.7 6.8 1921 10 002 257 281 161 321 95 960 25.7 16.1 9.6 1922 10 113 248 728 163 366 85 362 24.6 16.2 8.4 1923 10 198 241 230 142 335 98 895 23.7 14.0 9.7 1924 10 278 228 894 146 098 82 796 22.3 14.2 8.1 1925 10 370 225 555 146 450 79 105 21.8 14.1 7.6 1926 10 443 219 802 148 298 71 504 21.0 14.2 6.8 1927 10 496 208 711 155 479 53 232 19.9 14.8 5.1 1928 10 549 208 942 147 064 61 878 19.8 13.9 5.9 1929 10 598 203 064 155 493 47 571 19.2 14.7 4.5 1930 10 648 207 224 142 159 65 065 19.5 13.4 6.1 1931 10 702 196 214 144 534 51 680 18.3 13.5 4.8 1932 10 750 190 397 142 997 47 400 17.7 13.3 4.4 1933 10 791 176 201 140 906 35 295 16.3 13.1 3.3 1934 10 826 171 042 135 914 35 128 15.8 12.6 3.2 1935 10 853 161 748 140 878 20 870 14.9 13.0 1.9 1936 10 873 157 992 139 093 18 899 14.5 12.8 1.7 1937 10 889 155 996 139 558 16 438 14.3 12.8 1.5 1938 10 877 163 525 143 115 20 410 15.0 13.2 1.9 1939 11 106 192 344 146 976 45 368 17.3 13.2 4.1 1940 11 160 218 043 153 499 64 544 19.5 13.8 5.8 1941 11 129 208 913 152 048 56 865 18.8 13.7 5.1 1942 11 054 199 259 153 096 46 163 18.0 13.8 4.2 1943 11 035 225 379 153 349 72 030 20.4 13.9 6.5 1944 11 109 230 183 161 457 68 726 20.7 14.5 6.2 1945 10 693 194 182 184 944 9 238 18.2 17.3 0.9 1946 9 523 210 454 134 568 75 886 22.1 14.1 8.0 1947 8 765 206 745 105 277 101 468 23.6 12.0 11.6 1948 8 893 197 837 101 501 96 336 22.2 11.4 10.8 1949 8 893 185 484 104 632 80 852 20.9 11.8 9.1 1950 8 930 188 341 103 203 85 138 21.1 11.6 9.5 1951 9 000 185 570 102 658 82 912 20.6 11.4 9.2 1952 9 075 180 143 97 726 82 417 19.9 10.8 9.1 1953 9 140 172 547 98 837 73 710 18.9 10.8 8.1 1954 9 200 168 402 99 636 68 766 18.3 10.8 7.5 1955 9 270 165 874 93 300 72 574 17.9 10.1 7.8 1956 9 330 162 509 93 526 68 983 17.4 10.0 7.4 1957 9 390 155 429 98 687 56 742 16.6 10.5 6.0 1958 9 435 141 762 93 697 48 065 15.0 9.9 5.1 1959 9 465 128 982 97 159 31 823 13.6 10.3 3.4 1960 9 490 128 879 93 863 35 016 13.6 9.9 3.7 1961 9 587 131 019 94 973 36 046 13.7 9.9 3.8 1962 9 625 133 557 104 318 29 239 13.9 10.8 3.0 1963 9 671 148 840 100 129 48 711 15.4 10.4 5.0 1964 9 728 154 420 101 984 52 436 15.9 10.5 5.4 1965 9 779 147 438 105 108 42 330 15.1 10.7 4.3 1966 9 821 141 162 105 784 35 378 14.4 10.8 3.6 1967 9 853 138 448 108 967 29 481 14.1 11.1 3.0 1968 9 876 137 437 115 195 22 242 13.9 11.7 2.3 1969 9 897 143 165 120 653 22 512 14.5 12.2 2.3 1970 9 800 147 865 123 327 24 538 15.1 12.6 2.5 1971 9 827 154 180 122 375 31 805 15.7 12.5 3.2 1972 9 868 163 661 119 205 44 456 16.6 12.1 4.5 1973 9 922 181 750 124 437 57 313 18.3 12.5 5.8 1974 9 988 194 215 126 809 67 406 19.4 12.7 6.7 1975 10 059 191 776 124 314 67 462 19.1 12.4 6.7 1976 10 126 187 378 125 232 62 146 18.5 12.4 6.1 1977 10 187 181 763 126 214 55 549 17.8 12.4 5.5 1978 10 242 178 901 127 136 51 765 17.5 12.4 5.1 1979 10 292 172 112 127 949 44 163 16.7 12.4 4.3 1980 10 283 153 801 135 537 18 264 15.0 13.2 1.8 1981 10 301 144 438 130 407 14 031 14.0 12.7 1.4 1982 10 315 141 738 130 765 10 973 13.7 12.7 1.1 1983 10 324 137 431 134 474 2 957 13.3 13.0 0.3 1984 10 330 136 941 132 188 4 753 13.3 12.8 0.5 1985 10 337 135 881 131 641 4 240 13.1 12.7 0.4 1986 10 341 133 356 132 585 771 12.9 12.8 0.1 1987 10 349 130 921 127 244 3 677 12.7 12.3 0.4 1988 10 356 132 667 125 694 6 973 12.8 12.1 0.7 1989 10 362 128 356 127 747 609 12.4 12.3 0.1 1990 10 363 130 564 129 166 1 398 12.6 12.5 0.1 1991 10 309 129 354 124 290 5 064 12.5 12.1 0.5 1992 10 318 121 705 120 337 1 368 11.8 11.7 0.1 1993 10 331 121 025 118 185 2 840 11.7 11.4 0.3 1994 10 336 106 579 117 373 -10 794 10.3 11.4 -1.0 1995 10 331 96 097 117 913 -21 816 9.3 11.4 -2.1 1996 10 315 90 446 112 782 -22 336 8.8 10.9 -2.2 1997 10 304 90 657 112 744 -22 087 8.8 10.9 -2.1 1998 10 295 90 535 109 527 -18 992 8.8 10.6 -1.8 1999 10 283 89 471 109 768 -20 297 8.7 10.7 -2.0 2000 10 273 90 910 109 001 -18 091 8.8 10.6 -1.8 2001 10 224 90 715 107 755 -17 040 8.9 10.5 -1.7 2002 10 201 92 786 108 243 -15 457 9.1 10.6 -1.5 2003 10 207 93 685 111 288 -17 603 9.2 10.9 -1.7 2004 10 216 97 664 107 177 -9 513 9.6 10.5 -0.9 2005 10 236 102 211 107 938 -5 727 10.0 10.5 -0.6 2006 10 269 105 831 104 441 1 390 10.3 10.2 0.1 2007 10 334 114 632 104 636 9 996 11.1 10.1 1.0 2008 10 425 119 570 104 948 14 622 11.5 10.1 1.4 2009 10 488 118 348 107 421 10 927 11.3 10.2 1.0 2010 10 517 [2] 117 153 106 844 10 309 11.1 10.2 0.9 Infant mortality rate
3.3 in 2006, 3.1 in 2007, 2.8 in 2008 and 2.9 in 2009
Life expectancy at birth
male: 74.2 years
female: 80.1 years (2009)Total fertility rate
1.49 children born/woman (2009)
Ethnic groups
The majority of the 10.5 million inhabitants of the Czech Republic are ethnically and linguistically Czech (95%). Other ethnic groups include Germans, Roma, Poles and Hungarians. Historical minorities like those of Germans and Poles are declining due to assimilation. The Roma community is growing, while there is also a growing Vietnamese community. Other ethnic communities like Greeks, Turks, Italians and Yugoslavs are found in its capital city, Prague. Since the dissolution of Czechoslovakia, Slovaks staying in the Czech Republic have comprised roughly 3% of the population.
There are different groups of national and ethnic minorities in the Czech Republic. The so called old minorities usually live mostly in particular areas (e.g. Poles in the Zaolzie region, Germans in the Hultschiner region) while the new minorities are scattered among the majority population (generally in the larger towns). While some of the minorities have the whole social structure of the Czech society (Poles, Slovaks, Greeks), other represent only some of the social groups (i.e. Russian newcomers of middle class, or Ukrainians and Romanis who generally represent the underclass).[3]
1880-1910
Population of the Czech lands of Austria by language[4] Language 1880 1890 1900 1910 Czech 62.5% 62.4% 62.4% 62.9% German 35.8% 35.6% 35.1% 34.6% Polish 1.0% 1.2% 1.6% 1.6% Other 0.7% 0.8% 0.9% 0.9% Total population 8,222,013 8,665,421 9,372,140 10,078,637 after WW I
Population of the Czech Republic according to ethnic group 1921–2001 Ethnic
groupcensus 1921 1 census 1930 census 1950 census 1961 census 1970 census 1980 census 1991 census 2001 Number % Number % Number % Number % Number % Number % Number % Number % Czechs 6,758,983 67.5 7,304,588 68.3 8,343,558 93.9 9,023,501 94.2 9,270,617 94.4 9,733,925 94.6 8,363,768 81.2 9,249,777 90.5 Moravians 1,362,313 13.2 380,474 3.7 Silesians 44,446 0.4 10,878 0.1 Slovaks 15,732 0.2 44,451 0.4 258,025 2.9 275,997 2.9 320,998 3.3 359,370 3.5 314,877 3.1 193,190 1.9 Poles 103,521 1.0 92,689 0.9 70,816 0.8 66,540 0.7 64,074 0.7 66,123 0.6 59,383 0.6 51,968 0.5 Germans 3,061,369 30.6 3,149,820 29.5 159,938 1.8 134,143 1.4 80,903 0.8 58,211 0.6 48,556 0.5 39,106 0.4 Ukrainians 13,343 0.1 22,657 0.2 19,384 0.2 19,549 0.2 9,794 0.1 10,271 0.1 8,220 0.1 22,112 0.2 Ruthenians 1,926 0.0 1,106 0.0 Russians 6,619 0.1 5,051 0.0 5,062 0.0 12,369 0.1 Vietnamese 421 0.0 17,462 0.2 Hungarians 7,049 0.1 11,427 0.1 13,201 0.1 15,152 0.2 18,472 0.2 19,676 0.2 19,932 0.2 14,672 0.1 Roma[5] 227 0.0 19,770 0.2 19,392 0.2 32,903 0.3 11,746 0.1 Jews 35,699 0.4 37,093 0.4 218 0.0 Yugoslavs 4,749 0.0 3,957 0.0 3,386 0.0 Romanians 966 0.0 3,205 0.0 1,034 0.0 1,238 0.0 Others/undeclared 10,038 0.1 5,719 0.1 11,441 0.1 10,095 0.1 36,220 0.4 39,300 0.4 39,129 0.4 220,660 2.2 Total 10,005,734 10,674,386 8,896,133 9,571,531 9,807,697 10,291,927 10,302,215 10,230,060 1 On the territory of the census date. The legal position of the minorities is defined foremost in the Act No. 273/2001 Coll. (The Rights of the Minorities Act) which implements the Charter of Fundamental Rights and Basic Freedoms, Framework Convention for the Protection of National Minorities and Recommendation of the Council of Europe No. 1201. There is a number of other enactments which to lesser extent deal with the minorities.
Special situation is in the case of Moravians and Silesians, who are frequently allocated within the group of Czechs when it comes to the statistical data.
Roma[5]
Officially recognized minorities
Minorities, which "traditionally and on long term basis live within the territorry of the Czech Republic" enjoy some privileges. As of 2010 there are 12 such officially recognized minorities, which are (alphabetically): Bulgarians, Croatians, Hungarians, Germans, Greeks, Poles, Romanis, Russians, Rusyns, Serbians, Slovaks and Ukrainians.[6] Belorusian and Vietnamese minority may obtain this status in near future.[7]
Among the privileges of the officially recognized minorities are the right to have signs within the municipalities also in their language, right to have the information about elections in their language (both if the minority comprises at least 10% of the municipality's population), right to education in their language, cultural rights including state support for preservation of traditions.
Citizens belonging to the officially recognized minorities enjoy the right to use their language in communication with authorities and in front of the courts of law. The article 25 of the Czech Charter of Fundamental Rights and Basic Freedoms ensures right of the national and ethnic minorities for education and communication with authorities in their own language. Act No. 500/2004 Coll. (The Administrative Rule) in its paragraph 16 (4) (Procedural Language) ensures, that a citizen of the Czech republic, who belongs to a national or an ethnic minority, which traditionally and on long-term basis lives within the territory of the Czech Republic, have right to address an administrative agency and proceed before it in the language of the minority. In case that the administrative agency doesn't have an employee with knowledge of the language, the agency is bound to obtain a translator at the agency's own expense. According to Act No. 273/2001 (About The Rights of Members of Minorities) paragraph 9 (The right to use language of a national minority in dealing with authorities and in front of the courts of law) the same applies for the members of national minorities also in front of the courts of law.
Bulgarians
The Czech-Bulgarian relations date as far back as to the times of the Great Moravia. Their importance rose especially during the time of the Czech National Revival of the 19th century and related ideas of Pan-Slavism. Among the pioneers of the Slavic studies (including the Bulgarian studies) were the Czech and Slovak personalities such as Josef Dobrovský, František Ladislav Čelakovský, Jan Kollár, Karel Jaromír Erben and foremost Pavel Josef Šafařík, who had close ties with Bulgarian students in Prague. His interest in Bulgarian history, language and nation helped to strengthen Bulgarian self-awareness.[8]
In 1862 the Bulgarian and Czech students in Prague established a secret society Pobratim in order to support Bulgarian independence movement against the Ottoman rule and to support the unification of the Slavic nations. In 1869 the Bulharská matice - The Postojanstvo Society was established in Tábor aiming for the same purpose. This was followed by the so called Czech invasion into Bulgaria, of which Šafářík's grandson Konstantin Josef Jireček was the main personality. He took part in establishing the Bulgarian state services and became Bulgarian Minister of Education in the 1880s. Countless other Czechs took part in build-up of modern education and judiciary, cultural institutions as well as railways in Bulgaria.[9] Many Czech teachers, artists and qualified craftsmen took part in effort to build-up Bulgarian state.[10] At the same time Czech industrialists established new undertakings in Bulgaria, foremost sugar refineries and breweries. Meanwhile many Bulgarians immigrated to the Czech lands; mostly they were unskilled workers and young students wishing to obtain education at the Czech Universities.
In 1890 the first official Czecho-Bulgarian association was established (Bulharská Sednjanka), while in the independent Czechoslovakia local associations grew in the large towns. Large numbers of Bulgarians escaped to Czechoslovakia after Bulgaria (at the time ally of Nazi Germany) was occupied by the Red Army at the end of the second world war. Thousands more benefited from joint program of governments of Czechoslovakia and Bulgaria in years 1946-8, in which whole families immigrated to the areas from which the Germans were expelled. Subsequently many of these immigrants moved into larger cities, where they obtained jobs usually in industry.
During the socialist era the Bulgarian clubs were united under umbrella organisation Bulgarian Cultural Organisation.[11] The most friendly attitude of Czechs towards Bulgarians suffered hard blow as the Bulgarian army took part in the 1968 Invasion of Czechoslovakia. In 1990s the economic immigration of Bulgarians to the Czech Republic started.
4363 citizens claimed to have Bulgarian nationality in the 2001 census. They mostly live in the large cities and towns, such as Prague, Brno and Ostrava, Karlovy Vary, Kladno, Ústí nad Labem, Děčín, Havířov etc. Nowadays the newcomers from Bulgaria aim especially for these areas, in which they can hold on the established community. Many of these economical immigrants have dual citizenship of both the Czech Republic and Bulgaria. However most of the recent immigrants still have only Bulgarian citizenship.
The Bulgarian Cultural Organisation publishes magazine Roden Glas, while a folklore organisation Kytka promotes traditional Bulgarian dances. Among other organisations are Pirin, Zaedno, Vazraždane or Hyshove.[11]
As an officially recognized minority the Bulgarian citizens of the Czech Republic enjoy right to use their language in communications with authorities and in front of the courts of law. They also enjoy a number of other rights connected to the status of recognized minority, i.e. the right for education in the own language (the first Bulgarian school in the nowadays Czech Republic was established in 1946 in Prague).
Germans
 Pre-1945 areas with ethnic German majority (in black) inside the current Czech Republic's territories.
The German minority of the Czech Republic, historically the largest minority of the country, was almost entirely removed when 3 million were forcibly expelled in 1945–6. The constitution guarantees rights for minority languages, however there are 13 municipalities with German minority constituting 10% of population, which qualifies for such provisions.[12] There is no bilingual education system in Western and Northern Bohemia, where the German minority is mostly concentrated. However, this is in large part due to the absence of German-speaking youth, a heritage of the post-war policy of the Communist government.
According to the 2001 census there remain 13 municipalities and settlements in the Czech Republic with more than 10% Germans.[12]
Many representatives of expellees' organizations support the erection of bilingual signs in all formerly German speaking territory as a visible sign of the bilingual linguistic and cultural heritage of the region, yet their efforts are not supported by some of the current inhabitants, as the vast majority of the current population is not of German descent.
The German-Czech Declaration of 21 January 1997 covered the two most critical issues — the role of the Sudeten Germans in the breakup of Czechoslovakia in 1938 and their expulsion after WWII.[13]
Greeks
Another influential minority are Greeks (including Macedonians or "Slavonic Greeks"). Large numbers of Greeks arrived in Czechoslovakia when the Greek Civil War broke out. The first transports of Greek children arrived in 1948 and 1949. Later, more transports, also including adults, arrived.[14] They were partly leftists, communists and guerillas with their relatives, hence the willingness of Czechoslovak government to allow the immigration.[15] This was viewed rather as a temporary solution. After the defeat of DSE and other left-wing guerillas, the Greeks stayed in Czechoslovakia. In total more than 12,000 Greeks immigrated to Czechoslovakia between 1948 and 1950.[15] Today, there are about 7000 Greeks in the country (3219 according to 2001 census data),[15] mostly in the 3 biggest towns – Prague, Brno, Ostrava – and also in Bohumín, Havířov, Jeseník, Karviná, Krnov, Šumperk, Třinec, Vrbno pod Pradědem and Žamberk (apart from the last one these towns are in Silesia).[16]
Poles
Main article: Polish minority in the Czech RepublicThe most concentrated linguistic minority in the Czech Republic are ethnic Poles, historically the plurality, today constituting about 10% of the Karviná and Frýdek-Místek districts population. Poles have the right to use their language in official dealings, the public media (the Czech TV and the Czech Radio) regularly broadcast in Polish, and there are many Polish primary and secondary schools in the area. The Polish minority has been decreasing substantially since World War II as education in Polish was difficult to obtain, while Czech authorities did not permit bilingual signs to maintain Polish awareness among the population.
The erection of bilingual signs has technically been permitted since 2001, if a minority constitutes 10% of the population of a municipality. The requirement that a petition be signed by the members of minority was cancelled, thus simplifying whole process.[17] Still, only a couple of villages with large Polish minorities have bilingual signs (Vendryně/Wędrynia for instance).
Romanis
Main article: Relations between ethnic Czechs and RomaAnother minority is the Roma, who nonetheless have very little influence on Czech policy. Around 90% of the Roma that lived in the Czech Republic prior to World War II were exterminated by the Nazi Porajmos. The Roma there now are 80% post-war immigrants from Slovakia or Hungary, or the descendants thereof. In total, the Roma in the CR now number around 200,000.[18] There is Romani press in the CR, written in both Czech and Romani, but Romani radio is broadcast in Czech and there is no Romani television. Romani is also absent from legislative, judiciary, and other political texts but it has recently entered some university and elementary school courses. Life expectancy, literacy, median wage, school enrolment, and other socio-economic markers remain low while, according to Říčan (1998), Roma compose the majority of prison and habitual offender populations despite accounting for only a fraction of a percent of Czech population.
Minorities without official status

Vietnamese
Main article: Vietnamese people in the Czech RepublicThere are also Asian minorities in the Czech Republic. The largest is the Vietnamese one. During the communist era the governments of Czechoslovakia and Vietnam had a deal concerning the education of Vietnamese people in Czechoslovakia. Vietnamese people came to Czechoslovakia for the first time in 1956 and then the number of new migrants grew until the fall of communism. First generation Vietnamese work mostly as small-scale businessmen in markets. Still, many Vietnamese are without Czech citizenship. One of the towns with the largest Vietnamese communities is Cheb.
Languages
 The most commonly known foreign languages in the Czech Republic in 2005. According to Eurostat[19]
Czech, four Moravian dialects, Cieszyn Silesian dialect and Opava Silesian dialect as well as Polish language in Cieszyn Silesia and various Sudeten German dialects that are currently in extreme danger of extinction are spoken in the Czech Republic.
For other languages spoken in the Czech Republic, see the part about minorities.
Religion
See also: Roman Catholicism in the Czech RepublicTop religious affiliations in the Czech Republic, census 1991–2001[20] 1991 2001 change number % number % Roman Catholic Church 4,021,385 39.0 2,740,780 26.8 −31.8% Evangelical Church of Czech Brethren 203,996 2.0 117,212 1.1 −42.5% Czechoslovak Hussite Church 178,036 1.7 99,103 1.0 −44.3% no religion 4,112,864 39.9 6,039,991 59.0 +46.9% not identified 1,665,617 16.2 901,981 8.8 −45.8% total population 10,302,215 100.0 10,230,060 100.0 −0.7% Most of the Czech population claim to be atheist, agnostic, non-believer or no-organized believer (59%). The largest denomination is Roman Catholicism, estimated at 27.4% of the population, Protestant 1.2%, Hussites 1.0%, Jehovah's Witnesses 0.2%, Eastern Orthodox 0.2%, other religions 2.8%, unknown 8.8% (March 2001).[21]
According to the most recent Eurobarometer Poll 2005,[22] 19% of Czech citizens responded that "they believe there is a god", whereas 50% answered that "they believe there is some sort of spirit or life force" and 30% that "they do not believe there is any sort of spirit, god, or life force", the lowest rate of EU countries after Estonia with 16%.[23]
External links
- Czech Statistical Office, state institution responsible to provide official data about Czech Republic
- Ethnic groups living in the Czech Republic (click on menu for others)
References
- ^ "Czech Demographic Handbook 2007". Czech Statistical Office. http://www.czso.cz/csu/2008edicniplan.nsf/engp/4032-08.
- ^ http://www.czso.cz/csu/csu.nsf/enginformace/oby03141111.xls
- ^ (Czech)"Postavení národnostních menšin". http://www.fhs.cuni.cz/kos/kos_soubory/moravcova_o_postaveni_narodnostnich_mensin.doc. Retrieved 2010-12-01.
- ^ [1]
- ^ a b In census people can leave the "nationality" field empty and they can also write down any nationality or ethnicity they want. Most of Roma people fill in the Czech nationality. Thus, the real number of Roma in the country is estimated to be around 220,000. Petr Lhotka: Romové v České republice po roce 1989
- ^ See Government Council for National Minorities
- ^ (Czech)"Čeští Vietnamci chtějí status menšiny, pomoci jim může sčítání lidu". http://zpravy.idnes.cz/vietnamstina-ve-skolach-a-na-uradech-nebude-komunita-tady-zije-prilis-kratce-1vi-/domaci.asp?c=A101128_124225_domaci_jj. Retrieved 2010-12-01.
- ^ Motejlová-Manolová, Marija (2006) Uchováno v paměti: Bulharská sedjanka a její pokračovatelé v českých zemích. Prague
- ^ Dorovský, Ivan (1983) Konstantin Jireček − život a dílo Brno
- ^ Avramová, Lucie (2009), Imigrace Bulharů do Čech, http://antropologie.zcu.cz/imigrace-bulharu-do-cech, retrieved November 30, 2010
- ^ a b (Czech) "Bulharská národnostní menšina". vlada.cz. http://www.vlada.cz/scripts/detail.php?id=16103. Retrieved 2010-11-30.
- ^ a b Peter Josika: Mehrsprachig: Ein Faktor der Versöhnung at Prager Zeitung, 21 August 2007.
- ^ Wolff, Stefan (2000). German minorities in Europe: ethnic identity and cultural belonging. Berghahn Books. pp. 200. ISBN 9781571815040.
- ^ Anthula Botu: Řekové v českých zemích 1948-2000
- ^ a b c Marián Sloboda: „Až bude v Řecku mír, vrátíme se domů“. Řecká národnostní skupina v České republice, 25.3.2003
- ^ Vangelis Liolios: Podkladové materiály pro Radu vlády pro národnostní menšiny o situaci řecké menšiny v České republice
- ^ Kongres Polaków w RC, 29.10.2006
- ^ http://ec.europa.eu/education/languages/archive/languages/langmin/euromosaic/cz3_en.html
- ^ [2]
- ^ "Population by denomination and sex: as measured by 1921, 1930, 1950, 1991 and 2001 censuses" (in Czech and English). Czech Statistical Office. http://www.czso.cz/csu/2008edicniplan.nsf/engt/24003E05ED/$File/4032080119.pdf. Retrieved 2010-03-09.
- ^ Czech Statistical Office
- ^ "Eurobarometer on Social Values, Science and technology 2005 - page 11" (PDF). http://ec.europa.eu/public_opinion/archives/ebs/ebs_225_report_en.pdf. Retrieved 2007-05-05.
- ^ "Social values, Science and Technology" (PDF). Eurobarometer. June 2005. http://ec.europa.eu/public_opinion/archives/ebs/ebs_225_report_en.pdf. Retrieved 2006-12-19.
 Czech Republic
History Geography RiversGovernance Politics Economy Society Culture Symbols Flag · Coat of armsDemographics of Europe Sovereign
states- Albania
- Andorra
- Armenia
- Austria
- Azerbaijan
- Belarus
- Belgium
- Bosnia and Herzegovina
- Bulgaria
- Croatia
- Cyprus
- Czech Republic
- Denmark
- Estonia
- Finland
- France
- Georgia
- Germany
- Greece
- Hungary
- Iceland
- Ireland
- Italy
- Kazakhstan
- Latvia
- Liechtenstein
- Lithuania
- Luxembourg
- Macedonia
- Malta
- Moldova
- Monaco
- Montenegro
- Netherlands
- Norway
- Poland
- Portugal
- Romania
- Russia
- San Marino
- Serbia
- Slovakia
- Slovenia
- Spain
- Sweden
- Switzerland
- Turkey
- Ukraine
- United Kingdom
- (England
- Northern Ireland
- Scotland
- Wales)
- Vatican City
States with limited
recognition- Abkhazia
- Kosovo
- Nagorno-Karabakh
- Northern Cyprus
- South Ossetia
- Transnistria
Dependencies
and other territories- Åland
- Faroe Islands
- Gibraltar
- Guernsey
- Jan Mayen
- Jersey
- Isle of Man
- Svalbard
Other entities - European Union
Categories:- Demographics by country
- Czech society


Wikimedia Foundation. 2010.