- Demographics of Newfoundland and Labrador
-
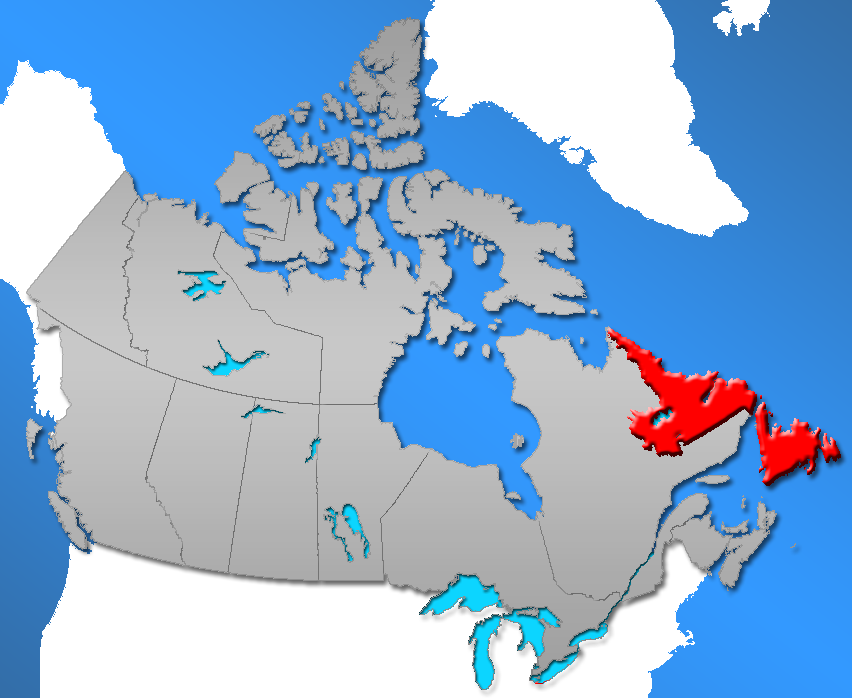
Newfoundland and Labrador (pronounced /ˈnjuːfən(d)lænd ən(d) læbrəˈdɔr/; French: Terre-Neuve-et-Labrador, Irish: Talamh an Éisc agus Labradóir, Latin: Terra Nova) is a province of Canada on the country's Atlantic coast in northeastern North America. The province has an area of 405,212 km2 and a population in 2006 of 505,469, approximately 94% of the province's population resides on the Island of Newfoundland (including its associated smaller islands), with nearly half of the population residing on the Avalon Peninsula. People from Newfoundland and Labrador are called "Newfoundlanders and Labradorians".
Contents
Population since 1951
Year Population Five Year
% changeTen Year
% changeRank Among
Provinces1951 361,416 n/a n/a 9 1956 415,074 14.8 n/a 9 1961 457,853 10.3 26.7 9 1966 493,396 7.8 18.9 9 1971 522,100 5.8 14.0 9 1976 557,720 6.8 13.0 9 1981 567,681 1.8 8.7 9 1986 568,350 0.1 1.9 9 1991 568,475 0.02 0.1 9 1996 551,790 -2.9 -2.9 9 2001 512,930 -7.0 -9.8 9 2006 505,469 -1.5 -8.4 9 Source: Statistics Canada[1][2]
Ethnicity
More than half the population identified their ethnocultural ancestry as Canadian, while two-fifths identified Irish ancestry, and one fifth identified English ancestry.
Ethnicity 2001 % Canadian 271,345 53.41% Irish 200,120 39.39% English 100,260 19.73% Scottish 30,295 5.96% French 27,785 5.47% North American Indian 16,030 3.16% Inuit 7,445 1.47% German 6,275 1.24% Métis 6,120 1.20% Newfoundlander 3,585 0.71% Welsh 2,790 0.55% Dutch (Netherlands) 1,385 0.27% Italian 1,180 0.23% Norwegian 1,180 0.23% Chinese 1,110 0.22% American (USA) 1,065 0.21% East Indian 940 0.19% British 925 0.18% Spanish 765 0.15% Portuguese 735 0.14% Polish 665 0.13% Ethnicity 2001 % Swedish 655 0.13% Ukrainian 580 0.11% Lebanese 515 0.10% Danish 455 0.09% Jewish 370 0.07% Filipino 340 0.07% Russian 285 0.06% Greek 245 0.05% Hungarian (Magyar) 245 0.05% Austrian 225 0.04% African (Black), n.i.e. 180 0.04% Egyptian 165 0.03% Finnish 145 0.03% Black 120 0.02% Jamaican 120 0.02% Acadian 115 0.02% Arab, n.i.e. 115 0.02% Belgian 115 0.02% Czech 115 0.02% Romanian 115 0.02% South African 105 0.02%
The same data on ethnocultural ancestry, grouped more geographically by Statistics Canada, are shown below:Origins 2001 % North American 274,755 54.08% British Isles 266,010 52.36% Aboriginal 28,065 5.52% French 27,835 5.48% Western European 7,705 1.52% Southern European 3,285 0.65% Northern European 2,510 0.49% Eastern European 2,050 0.40% East and Southeast Asian 1,685 0.33% Origins 2001 % South Asian 1,110 0.22% Arab 915 0.18% Other European 520 0.10% African 465 0.09% Caribbean 270 0.05% West Asian 130 0.03% Latin, Central and
South American75 0.01% Oceania 45 0.01%
Percentages are calculated as a proportion of the total number of respondents (508,075) and may total more than 100% due to dual responses.
Only groups of more than 0.02% are shown[3]Languages
The 2006 Canadian census showed a population of 505,469.
Of the 499,830 singular responses to the census question concerning mother tongue the most commonly reported languages were:2006 % 2001 % 1. English 488,405 97.71% 499,750 98.49% 2. French 1,885 0.38% 2,180 0.43% 3. Algonquian languages 1,625 0.33% 1,510 0.30% Montagnais–Naskapi 1,585 0.32% 1,495 0.29% 4. Chinese languages 1,080 0.22% 525 0.10% Cantonese 185 0.04% 55 0.01% Mandarin 120 0.02% 25 ~ 5. Spanish 670 0.13% 50 0.01% 6. German 655 0.13% 340 0.07% 7. Inuktitut 595 0.12% 550 0.11% 8. Urdu 550 0.11% 90 0.02% 9. Arabic 540 0.11% 210 0.04% 10. Dutch 300 0.06% 95 0.02% 11. Russian 225 0.05% 75 0.01% 12. Scandinavian languages 220 0.04% 125 0.02% Norwegian 85 0.02% 40 0.01% Danish 65 0.01% 55 0.01% Swedish 65 0.01% 25 ~ 13. Italian 195 0.04% 115 0.02% 14= Germanic languages n.i.e. 180 0.04% 75 0.01% 14= Tagalog (Filipino) 180 0.04% 130 0.03% 16. Serbo-Croatian (all) 170 0.03% 130 0.03% Serbian 135 0.03% 15 ~ Croatian 35 0.01% 40 0.01% Serbo-Croatian 0 ~ 75 0.01% 2006 % 2001 % 17. Bengali 165 0.03% 55 0.01% 18. Portuguese 150 0.03% 105 0.02% 19. Hungarian 140 0.03% 45 0.01% 20. Panjabi (Punjabi) 120 0.02% 95 0.02% 21= African languages n.i.e. 100 0.02% 10 ~ 21= Non-verbal languages 100 0.02% N N 23= Bantu languages 95 0.02% 0 ~ 23= Bulgarian 95 0.02% 75 0.01% 25. Niger–Congo languages n.i.e. 85 0.13% 40 0.1% 26. Romanian 75 0.02% 15 ~ 27= Greek 70 0.01% 40 0.01% 27= Japanese 70 0.01% 45 0.01% 29. Telugu 65 0.01% 45 0.01% 30= Persian 60 0.01% 70 0.01% 30= Ukrainian 60 0.01% 20 ~ 32= Czech 50 0.01% 15 ~ 32= Gujarati 50 0.01% 50 0.01% 32= Hindi 50 0.01% 55 0.01% 32= Korean 50 0.01% 50 0.01% 36. Malayalam 40 0.01% 10 ~ 37. Turkish 40 0.01% 25 ~ 38. Welsh 35 0.01% 20 ~ 39. Gaelic languages 30 0.01% 10 ~
Note: "n.i.e.": not included elsewhereThere were also about 25 single-language responses for Amharic, 25 for Bisayan languages, 20 for Sinhala and 20 for Slovak. In addition, there were also 435 responses of English and a non-official language; 30 of French and a non-official language; 295 of English and French; and 10 of English, French, and a non-official language. (Figures shown are for the number of single language responses and the percentage of total single-language responses.)[4]
Migration
Immigration
The 2006 Canadian census counted a total of 8,380 immigrants living in Newfoundland and Labrador.
The most commonly reported origins for these immigrants were:[5]Rank Origin # Immigrants 1. United Kingdom 2,335 2. United States 1,405 3. India 440 4. Germany 390 5. China 345 6. Pakistan 170 7. Philippines 160 8= Ireland (Éire) 150 8= Netherlands 150 10= Egypt 125 10= South Africa 125 12. Colombia 120 There were also about 115 immigrants from Portugal; about 105 each from Hong Kong and from Sudan; about 100 from the former Yugoslavia; about 95 each from El Salvador and from France; about 85 from Iraq; and about 75 each from Sri Lanka and from Russia.
Internal migration
A total of 41,840 people moved to Newfoundland and Labrador from other parts of Canada between 1996 and 2006 while 79,125 people moved in the opposite direction. These movements resulted in a net outmigration of 18,820 people to Alberta, 9,900 to Ontario 4,690 to Nova Scota, 1,615 to British Columbia, 940 to Saskatchewan, 825 to the Northwest Territories, and 700 to Prince Edward Island; and a net influx of 690 people from Manitoba. During this period there was also a net outmigration of 580 francophones to Quebec and 230 francophones moving to Ontario, and a net influx of 320 anglophones from Quebec. (All net inter-provincial movements of more than 500 persons and all official minority movements of more than 100 persons are given.)[6][7]
Cities and towns
Ten Largest Urban Areas in the province by population[8]
Urban Area 2006 St. John's 181,113 Corner Brook 26,623 Grand Falls-Windsor 13,558 Bay Roberts 10,507 Gander 9,951 Labrador City 7,240 Happy Valley – Goose Bay 7,572 Stephenville 6,588 Largest municipalities by population
The 10 largest municipalities in the province by population are Municipality 2001 2006 St. John's 99,182 100,646 Mount Pearl 24,964 24,671 Conception Bay South 19,772 21,966 Corner Brook 20,103 20,083 Grand Falls-Windsor 13,340 13,558 Paradise 9,598 12,584 Gander 9,651 9,951 Happy Valley – Goose Bay 7,969 7,572 Labrador City 7,744 7,240 Stephenville 7,109 6,588 See also
References
- ^ StatCan 2001 Census - population
- ^ "Population and dwelling counts (2006 Census)". Statistics Canada. http://www12.statcan.ca/english/census06/data/popdwell/Table.cfm?T=101. Retrieved 2011-01-10.
- ^ Ethnic Origin (232), Sex (3) and Single and Multiple Responses (3) (2001 Census)
- ^ Detailed Mother Tongue (186), Knowledge of Official Languages (5), Age Groups (17A) and Sex (3) (2006 Census)
- ^ Immigrant Status and Period of Immigration (8) and Place of Birth (261) (2006 Census)
- ^ Province or Territory of Residence 5 Years Ago (14), Mother Tongue (8), Age Groups (16) and Sex (3) (2006 Census)
- ^ Province or Territory of Residence 5 Years Ago (14), Mother Tongue (8), Age Groups (16) and Sex (3) (2001 census)
- ^ Population and dwelling counts, for urban areas, 2006 and 2001 censuses - 100% data
 Subdivisions of Newfoundland and Labrador
Census divisions Cities Other communities Bishop's Falls · Bonavista · Botwood · Carbonear · Channel – Port aux Basques · Clarenville · Conception Bay South · Deer Lake · Ferryland · Fogo · Gander · Grand Bank · Grand Falls-Windsor · Happy Valley – Goose Bay · Harbour Grace · Hopedale · Labrador City · Marystown · Nain · Norris Arm · Pasadena · Peterview · Placentia · Red Bay · St. Anthony · Stephenville · Twillingate · Torbay · Woody Point · Makkovik Category:Newfoundland and Labrador ·
  Portal:Newfoundland and Labrador ·
  WikiProject:Newfoundland and Labrador
 Demographics of Canada (by province or territory)Alberta · British Columbia · Manitoba · New Brunswick · Newfoundland and Labrador · Nova Scotia · Ontario · Prince Edward Island · Quebec · Saskatchewan
Northwest Territories · Nunavut · Yukon Book · Category · Portal · WikiProjectCategories:
- Demographics of Canada
- Newfoundland and Labrador society
Wikimedia Foundation. 2010.