- Demographic history of Subotica
-
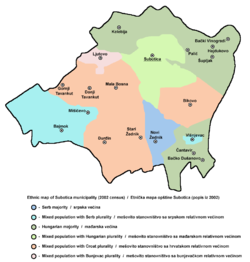 Ethnic map of the Subotica municipality, 2002 census
Demographic history of Subotica
Overview
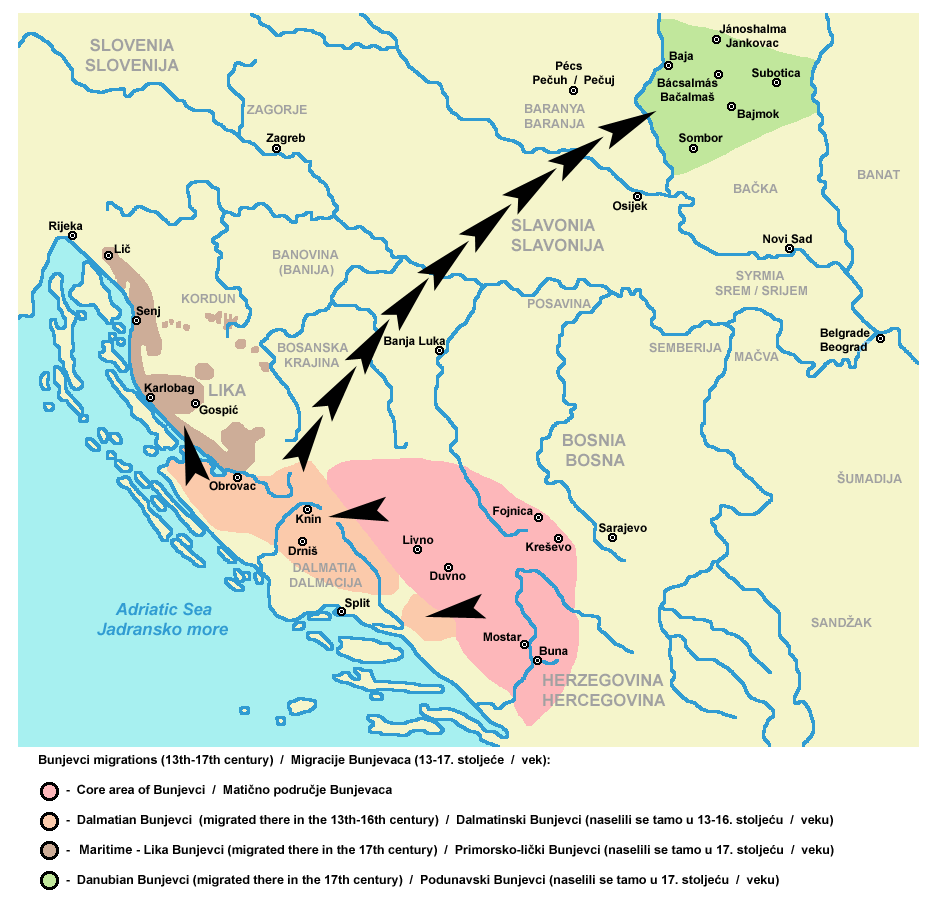
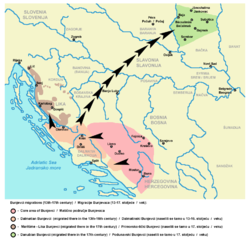 Bunjevci migration to Bačka
Before the Ottoman conquest in the 16th century, the population of the city was mostly Hungarian, while during the Ottoman rule (16th-17th centuries) was mostly Serbian and Muslim. Between the end of the 17th century and the second half of the 19th century, the population of Subotica was mostly composed of ethnic Bunjevci.
At the end of the 19th century, and the first decades of the 20th century, the census results show that speakers of the Hungarian language were more numerous than the speakers of the Bunjevac language. However, it is not certain whether Hungarians or Bunjevci were majority in the city at this time. Censuses performed in the Kingdom of Hungary during this time are considered partially inaccurate by many historians because these censuses did not record the population by ethnic origin or strictly by mother tongue, but also by the "most frequently spoken language", thus the census results overstated the number of Hungarian speakers, since this was official language at the time and many non-Hungarian native speakers stated that they most frequently speak Hungarian language in everyday communication. The Magyarization (Hungarization) policy of the Hungarian government also played a role, since numerous Bunjevci were Magyarized, that is, replaced their native South Slavic language with Hungarian. Part of the Bunjevac population was also bilingual, thus, the different results in Austro-Hungarian censuses before 1918 and Yugoslav censuses after 1918 are explained by the fact that it was a same bilingual population that in Austro-Hungarian censuses declared Hungarian language and in Yugoslav censuses declared Serbian or Croatian language.
Censuses performed in the Kingdom of Yugoslavia between the two world wars indicate that the majority in Subotica at this time were Bunjevci. According to the Yugoslav historians, this further undermine the validity of the results from previous censuses performed in the Kingdom of Hungary, and suggest that even during that time the majority of the city population were Bunjevci, who declared that they most frequently speak Hungarian language in everyday communication. According to the Hungarian historians, the 1931 census may be more accurate than those performed immediately after the creation of Yugoslavia (1919, 1921), which show exceptionally low figures for Hungarians at a time when the new Yugoslav authorities had political reasons to minimise the Hungarian population share.
The Hungarian census from 1941 (whose validity is rejected by many historians), show that 59.9% of the city population spoke Hungarian language, i.e. the number of Hungarian speakers increased for about 20,000 (from 41,401 (or 41.38%) in 1931 to 61,581 (or 59.9%) in 1941). The subsequent censuses performed in the SFR Yugoslavia recorded the ethnicity of the citizens, and according to the 1953 census ethnic Hungarians numbered 32,194 or 50.6% of population of Subotica. Next censuses also recorded that Hungarians are largest ethnic group in the city, but their participation dropped: 50.02% in 1961, 48.49% in 1971, 43.84% in 1981, 39.6% in 1991, and 34.99% in 2002.
In censuses condacted in SFRY ethnic Bunjevci were not allowed to express their ethnicity, and citizens who declared themselves in census as Bunjevci were counted as "Croats". Since 1991 census, Bunjevci and Croats are listed separately in census results.
It is interesting to note that according to 1850 data, Subotica had a population of 48,126 people. Before the First World War this number almost reached 100,000. When Subotica became part of the Kingdom of Serbs, Croats and Slovenes in 1918, Subotica was the third-largest city of the newly formed country, after Belgrade and Zagreb. It has since been overtaken by many cities in the region.
Since the 2002 censuses in Romania and Serbia, Subotica has become the largest city outside Hungary in which Hungarians are the largest ethnic group, although they are not absolute, but only relative majority with participation of 34.99%, while 55.94% of the city population are various South Slavic ethnic groups, which speak Serbian or Croatian language.
1720 data
According to 1720 census, Subotica had 264 houses with more than 2,200 inhabitants. Population was mostly composed of Bunjevci and Serbs, while census also recorded data that only 2 ethnic Hungarians lived in the town, one of them was frontiersman and another one was blacksmith. (Source: Etnolingvistička i istorijska istraživanja o Bunjevcima, Zbornik radova sa naučnog skupa održanog 25. oktobra 2008. godine u Subotici, Matica Srpska, Novi Sad, 2008, pages 24–25)
1743 data
In 1743, population of Subotica included 2/3 Dalmatians (Bunjevci) and 1/3 Rascians (Serbs). (Source: Seoske crkve i groblja u Vojvodini, Novi Sad, 2000, page 6)
1748 data
In 1748, there was 562 houses in Subotica, of whom majority Bunjevac. Citizens of Orthodox faith (Serbs) lived in 58 houses, while Hungarians lived in 48 houses. (Source: Etnolingvistička i istorijska istraživanja o Bunjevcima, Zbornik radova sa naučnog skupa održanog 25. oktobra 2008. godine u Subotici, Matica Srpska, Novi Sad, 2008, pages 24–25)
1778 data
In 1778, population of Subotica numbered 21,471 inhabitants, of whom 17,043 were Bunjevci and Serbs. (Source: Etnolingvistička i istorijska istraživanja o Bunjevcima, Zbornik radova sa naučnog skupa održanog 25. oktobra 2008. godine u Subotici, Matica Srpska, Novi Sad, 2008, pages 24–25)
1786 data
In 1786, Subotica had more than 24,000 inhabitants, of whom, apart from majority Bunjevci, there was 1/4 Serbs and 1/8 Hungarians. (Source: Dr Dušan J. Popović, Srbi u Vojvodini, knjiga 2, Novi Sad, 1990, page 322)
1868 data
According to Bunjevački kalendar for 1868, ethnic composition of Subotica in this year looked like this:
- Bunjevci = 50,000
- Hungarians = 6,000
- Serbs = 3,500
- Jews = 1,300
- Others (including Danube Swabian Germans, etc.)
1880 data
In 1880, 31,592 (or 50.5%) citizens of Subotica spoke Hungarian language.
1890 data
Linguistic composition of Subotica according to 1890 data:[citation needed]
- Hungarian language = 38,327
- Rac language = 31,824 (including Serbian, Bunjevac and Šokac)
- German language = 1,898
- Slovak language = 476
- Slovenian language = 64
- Croatian language = 19
- Vlach language (Romanian language) = 16
- Rusyn language = 2
- other languages = 111
1910 data
According to the census of 1910, Subotica's linguistic composition looked as follows: The 94,610 inhabitants were further divided by most common language used:
- Hungarian = 55,587 (58.75%)
- Bunjevac = 33,247 (35.14%)
- Serbian = 3,514 (3.71%)
- German = 1,913 (2.02%)
- Slovak = 100
- Vlach (Romanian) = 60
- Croatian = 39
- Rusyn language = 7
- other languages
1919 data
Ethnic composition of Subotica according to 1919 census data:
- Bunjevci = 65,135
- Hungarians = 19,870
- Serbs = 8,737
- Germans (Danube Swabians) = 4,251
- Jews = 3,293
1921 data
Linguistic composition of Subotica according to 1921 census data:
- Serbian or Croatian language = 60,700
- Hungarian = 26,750
- German = 2,470
1931 data
Linguistic composition of Subotica according to 1931 census data - from total population of 100,058, there was:
- Serbian or Croatian language = 53,484 (53.45%)
- Hungarian = 41,401 (41.38%)
- German = 2,865 (2.86%)
1941 data
In 1941, 61,581 (or 59.9%) citizens of Subotica spoke Hungarian language.
1948 data
1953 data
In 1953, 32,194 (or 50.6%) citizens of Subotica were of Hungarian ethnicity.
1961 data
According to 1961 census, Subotica had 75,036 citizens, of whom:
1971 data
According to 1971 census, Subotica had 88,813 citizens, of whom:
- Hungarians = 43,068 (48.49%)
- Croats = 27,109 (30.52%)
- Serbs = 11,728 (13.21%)
- Yugoslavs = 3,975 (4.48%)
1981 data
According to 1981 census, Subotica had 100,516 citizens, of whom:
- Hungarians = 44,065 (43.84%)
- Croats = 19,838 (19.74%)
- Serbs = 13,959 (13.89%)
- Yugoslavs = 13,772 (13.7%)
- Montenegrins = 1,119 (1.11%)
1991 data
According to 1991 census, Subotica had 100,386 citizens, of whom:
- Hungarians = 39,749 (39.6%)
- Yugoslavs = 17,454 (17.39%)
- Serbs = 15,734 (15.67%)
- Bunjevci = 10,874 (10.83%)
- Croats = 10,683 (10.64%)
- Montenegrins = 1,434 (1.43%)
2002 data
According to 2002 census, Subotica had 99,981 citizens, of whom:
- Hungarians = 34,983 (34.99%)
- Serbs = 26,242 (26.25%)
- Bunjevci = 10,870 (10.87%)
- Croats = 10,424 (10.43%)
- Yugoslavs = 6,787 (6.79%)
- Montenegrins = 1,596 (1.6%)
- Roma = 1,171 (1.17%)
Historical population of the city in different time periods
Date Population 1702 1,969 1720 2,200 1765 9,556 1766 9,730 1770 9,840 1771 10,252 1772 10,364 1778 21,471 1785 23,000 1786 24,000 1836 32,984 1850 48,126 1869 57,556 1880 62,556 1890 74,250 1900 82,835 1910 93,232 1921 90,961 1931 100,058 1948 63,079 1953 66,091 1961 75,036 1971 88,813 1981 100,516 1991 100,386 2002 99,981 See also
- Subotica
- Demographic history of Bačka
- Demographic history of Vojvodina
- Demographic history of Serbia
References
- Slobodan Ćurčić, Broj stanovnika Vojvodine, Novi Sad, 1996.
- Slobodan Ćurčić, Naselja Bačke - geografske karakteristike, Novi Sad, 2007.
- Etnolingvistička i istorijska istraživanja o Bunjevcima, Zbornik radova sa naučnog skupa održanog 25. oktobra 2008. godine u Subotici, Matica Srpska, Novi Sad, 2008.
- Seoske crkve i groblja u Vojvodini, Novi Sad, 2000.
- Ivan Ivanić, O Bunjevcima, Subotica, 1894.
- Bunjevački kalendar za pristupnu 1868. godinu.
- Dr Dušan J. Popović, Srbi u Vojvodini, knjiga 2, Novi Sad, 1990.
External links
Categories:- Subotica
- History of Bačka
- Histories of cities in Serbia

Wikimedia Foundation. 2010.