- IQ and Global Inequality
-
 IQ and Global Inequality
IQ and Global Inequality is a controversial 2006 book by psychologist Richard Lynn and political scientist Tatu Vanhanen.[1] IQ and Global Inequality is follow-up to their 2002 book IQ and the Wealth of Nations,[2] an expansion of the argument that international differences in current economic development are due in part to differences in average national intelligence as indicated by national IQ estimates, and a response to critics. The book was published by the controversial Washington Summit Publishers.
Lynn and Vanhanen's research on national IQs has attracted academic attention from several fields with both praise and criticism. Various authors have cited the book to reach further conclusions from the book's statements or to criticize or find support for the book's scores, methodology, and conclusions.[3][4][5][6][7][8] Several other data sets of estimated average national cognitive ability exist as explained in nations and intelligence.
Contents
Summary
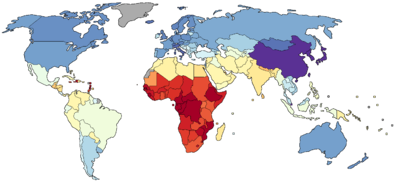 Estimated national average IQs according to IQ and Global Inequality.≤65707580859095100≥105N/A
Human intelligence Abilities and Traits Abstract thought
Communication · Creativity
Emotional Intelligence
Knowledge · Learning · Memory
Problem solving · Reaction time
Reasoning · Understanding
Visual ProcessingModels and Theories Fields of study - Chapter 1 summarizes theories of economic growth.
- Chapter 2 defines and describes intelligence.
- Chapter 3 argues that the scientific literature indicates that intelligence is a determinant of incomes and related phenomena among individuals within a number of countries.
- Chapter 4 describes the collection and determination of national IQ, presenting calculated IQs for 113 countries and estimated IQs for an additional 79 countries. This represents all countries with population greater than 40,000.
- Chapter 5 introduces a new statistic, the quality of human condition index (QHC) and 12 alternative variables that measure human conditions.
- Chapter 7 focuses on the relationship between national IQ and QHC, which Lynn and Vanhanen report to be strongly correlated.
- Chapter 8 examines the relationship between national IQ and 12 alternative variables, which Lynn and Vanhanen report are also correlated with national IQ.
- Chapter 9 discusses the genetic and environmental contributions to differences in national intelligence, and argues that racial composition of the population is a major factor.
- Chapter 10 considers the causal relationship between national IQ and important variables related to global inequality.
- Chapter 11 discusses and responds to criticisms made to Lynn and Vanhanen's theory by reviewers.
- Chapter 12 summarizes the book and discusses policy recommendations.
Significant correlations with higher national IQ were found for a number of factors: higher GDP/capita, higher adult literacy rate, higher gross tertiary education enrollment ratio, higher life expectancy at birth, higher level of democratization 2002 (Tatu Vanhanen's Index of Democratization), higher Human Development Index, higher Gender-related Development Index, higher economic growth rate, lower Gini index of inequality in income or consumption, lower population below the $2 a day international poverty line, lower measures of undernourishment, lower maternal mortality ratio, lower infant mortality rate, higher Corruption Perceptions Index, higher Economic Freedom of the World ratings, higher Index of Economic Freedom ratings, and more narrow population pyramid (MU Index).
Reception
See also: Nations and intelligenceThe book received a mixed reception ranging from praise to dismissal.
In a review J. Philippe Rushton, President of the Pioneer fund that has been a long time funder of research by Lynn,[9][10] writes that the book extends and answers criticisms against the earlier work in several ways. The number of nations for which there were IQ tests available increased from 81 to 113. The correlation between IQ and income per person was 0.68 which is virtually identical to the one reported in the earlier book. The book compared the IQ values for the 32 new nations for which IQ tests were available with the estimations for these nations in the earlier book which was based on averaging neighboring nations values. The correlation of 0.91 was very high. Rushton thus conclude that this method is remarkably accurate.[5]
Rushton states that the authors also compared the results of the IQ tests for those nations were several were available (71 nations). They found a very high correlation of 0.95 and thus concluded that the IQ testing have a very high reliability regarding measuring IQ. The authors furthermore compared the national IQs to national scores of school students in tests of mathematics and science. The correlations were between 0.79 and 0.89. This, Rushton writes, establishes that the national IQs have very high validity as measures of national differences in cognitive ability.[5]
The authors argue for a substantial role of genetics and race in explaining these differences. They were led to this conclusion from observing racial clusters regarding national IQs. Thus, the six East Asian nations all have IQs in the range between 105 and 108. The 29 European nations all have IQs in the range between 92 and 102. The 19 nations of sub-Saharan Africa all have IQs in the range between 59 and 73. Rushton thus argues that "They show that there is remarkable consistency in the IQs of nations when these are classified into racial clusters." The book also argues for feedback between genes and environment. For instance, a genetically caused high national IQ leads to high per capita incomes which enables high quality nutrition, education and health care for children which enhance their intelligence.[5]
Kanazawa when commenting on using the book as a data source makes statements similar to Rushton's.[11]
The methods of the study were criticized by Richard E. Nisbett for relying on small and haphazard samples and for ignoring data that did not support the conclusions.[7]
In an article published in European Journal of Personality, Heiner Rindermann compared the IQ scores from the book to a large number of international student assessment studies on subjects such as reading, mathematics, science, and problem solving, and found them to be highly intercorrelated. Statistical analyses indicated that the results could be explained by an underlying general cognitive ability. More than 30 commentaries on Rindermann's findings were published in the same issue of the journal.[8]
The study A systematic literature review of the average IQ of sub-Saharan Africans by Jelte M. Wicherts and colleagues stated that:
-
- "For instance, Lynn and Vanhanen (2006) accorded a national IQ of 69 to Nigeria on the basis of three samples (Fahrmeier, 1975; Ferron, 1965; Wober, 1969), but they did not consider other relevant published studies that indicated that average IQ in Nigeria is considerably higher than 70 (Maqsud, 1980a,b; Nenty & Dinero, 1981; Okunrotifa, 1976). As Lynn rightly remarked during the 2006 conference of the International Society for Intelligence Research (ISIR), performing a literature review involves making a lot of choices. Nonetheless, an important drawback of Lynn (and Vanhanen)'s reviews of the literature is that they are unsystematic."[6]
However, the study also did its own literature review on the average IQ of sub-Saharan Africans. It did not find as low a value as the book, below 70, but the estimated average value of 82 is still low compared to industrialized nations. Regarding four studies comparing and finding agreement between Lynn's estimated national IQs and the international student assessment tests, they disagree regarding sub-Saharan Africa but write "these four studies appear to validate national IQs in other parts of the world."[6]
Richard Lynn and Gerhard Meisenberg in turn replied that "critical evaluation of the studies presented by WDM shows that many of these are based on unrepresentative elite samples" and that a further literature review, including taking into account results in mathematics, science, and reading, gave "an IQ of 68 as the best reading of the IQ in sub-Saharan Africa".[12] Wicherts and colleagues in yet another reply stated: "In light of all the available IQ data of over 37,000 African testtakers, only the use of unsystematic methods to exclude the vast majority of data could result in a mean IQ close to 70. On the basis of sound methods, the average IQ remains close to 80. Although this mean IQ is clearly lower than 100, we view it as unsurprising in light of the potential of the Flynn Effect in Africa (Wicherts, Borsboom, & Dolan, 2010) and common psychometric problems associated with the use of western IQ tests among Africans."[13]
Consequently, some later studies using average national IQ data have checked their results against both data sets.[14][15]
Jones and Schneider commenting on the differences to the earlier book write "LV (2002) assembled results from 183 conventional IQ tests, both verbal and visual, given in 81 countries across the entire 20th century;they used hundreds of IQ tests from 113 countries across centuries in LV (2006). They aggregated these results using best practice methods to create estimates of “national average IQ” for these countries. LV show in those works as well as in Lynn (2006) that the IQ gaps between regions of the world have not appreciably changed during the 20th century."[16]
In the summer of 2010 Lynn presented new calculated national IQs for 25 countries which had previously only been estimated from neighboring nations IQs and revised national IQs for 16 countries. "Numerous cultural, biological, economic, political and medical correlates of country-level intelligence have been demonstrated in previous studies. It is recommended that the new and updated IQs presented in this paper should be used as the best estimates of the average IQs for these countries by scholars investigating these correlates."[17]
Associations between national IQ and other factors
Quality of human conditions index
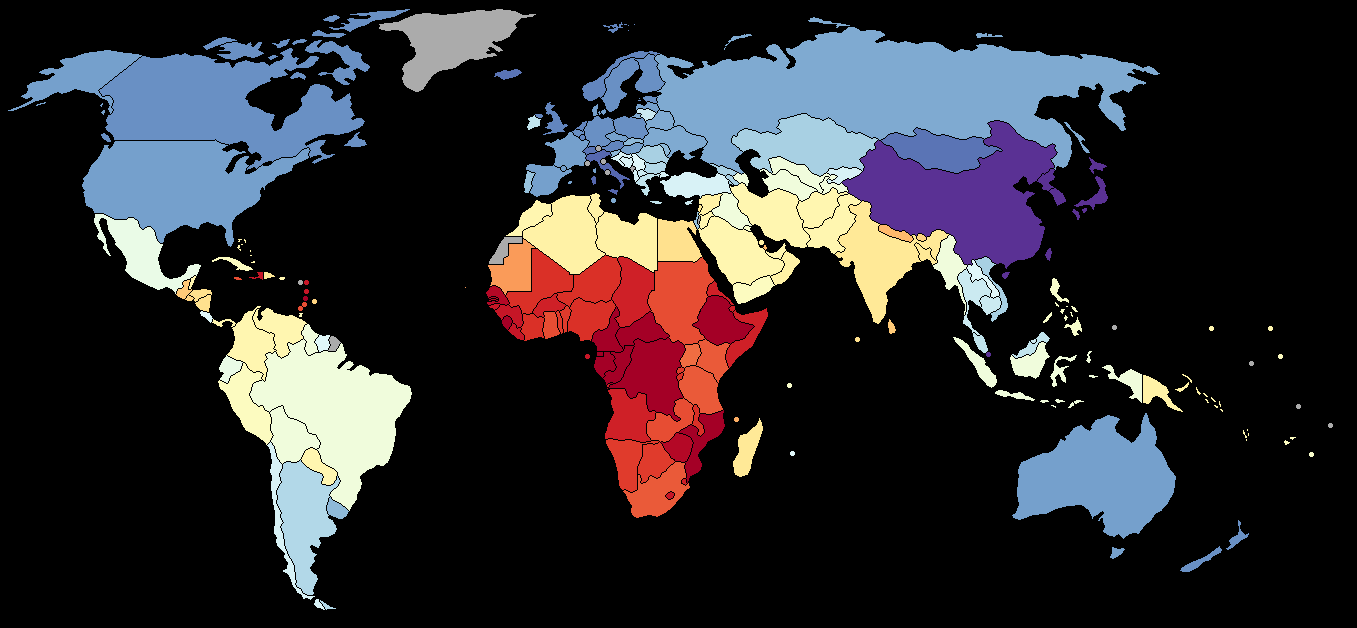
 Richard Lynn and Tatu Vanhanen's QHC index.1115203040506070808589N/A
The quality of human conditions (QHC) index was computed from five variables.
- purchasing power parity Gross National Income (PPP-GNI) per capita 2002
- adult literacy rate 2002
- gross tertiary enrollment ratio
- life expectancy at birth 2002
- the level of democratization 2002 (Tatu Vanhanen's Index of Democratization)
Values of the index range from 10.7 (Burkina Faso) to 89 (Norway). Lynn and Vanhanen write that they would have preferred to include a sixth measure, an indicator of income inequality, but that statistical data for that variable was not available for all countries. They write that the QHC index differs significantly from other widely used indexes (such as the Human Development Index) in that QHC also measures democratization. Some of their claims have received support in a 2007 study by Rindermann.[18]
All countries Calculated IQ
(113 countries)Estimated IQ
(79 countries)Total
(192 countries)QHC 0.805 0.725 0.791 PPP GNI per capita 2002 0.693 0.342 0.616 Adult literacy rate 2002 0.642 0.655 0.655 Tertiary enrollment ratio 0.746 0.699 0.745 Life expectancy at birth 2002 0.765 0.690 0.750 Index of Democratization 2002 0.569 0.322 0.530 Excluding smallest countries Calculated IQ
(98 countries)Estimate IQ
(62 countries)Total
(160 countries)QHC 0.846 0.800 0.839 PPP GNI per capita 2002 0.739 0.266 0.649 Adult literacy rate 2002 0.710 0.746 0.733 Tertiary enrollment ratio 0.778 0.734 0.780 Life expectancy at birth 2002 0.833 0.753 0.817 Index of Democratization 2002 0.598 0.408 0.584 Other measures of global inequality
The relationship of national IQ to twelve other measures of global inequality were examined.
- Human Development Index (HDI)
- Gender-related Development Index (GDI)
- Economic growth rate (EGR)
- Gini index of inequality in income or consumption (Gini)
- Population below $2 a day international poverty line (Poverty)
- Measures of undernourishment (PUN)
- Maternal mortality ratio (MMR) and infant mortality rate (IMR)
- Corruption Perceptions Index (CPI)
- Economic freedom ratings (EFR)
- the Index of Economic Freedom (IEF)
- Population pyramids (MU-index)
- Human happiness and life-satisfaction.
All twelve measures of global inequality are significantly correlated with the QHC index. According to the book, eleven of the twelve measures are significantly correlated with national IQ. The measures of human happiness and life satisfaction are not significantly correlated with national IQ.
Correlations IQ QHC HDI 0.776 0.940 GDI 0.849 0.951 EGR 3 0.747 0.840 EGR 4 0.709 0.871 Gini −0.538 −0.464 Poverty −0.653 −0.799 PUN 1 −0.500 −0.648 MMR −0.730 −0.759 IMR −0.771 −0.861 CPI 0.591 0.762 EFR 0.606 0.674 IEF 0.418 0.620 MU-index 0.806 0.902 Happiness 0.029 0.315 Life satisfaction 0.033 0.396 Latitude and temperature
Correlation Latitude Temperature Degrees latitude 1 -0.885 Annual mean temperature -0.885 1 National IQ 0.677 -0.632 QHC 0.659 -0.562 PPP GNI per capita 2002 0.528 -0.407 Adult literacy rate 2002 0.482 -0.467 Tertiary enrollment ratio 0.718 -0.649 Life expectancy at birth 2002 0.505 -0.379 Index of Democratization 2002 0.512 -0.460 National IQ and QHC values
Lynn and Vanhanen base their analysis on data gathered from a literature review. They selected IQ data from studies which covered 113 nations. For another 79 nations, they estimated the mean IQs on the basis of the arithmetic means of the measured IQs of neighboring countries. They justify this method of estimation by pointing out that the correlation between the estimated national IQs they reported in IQ and the Wealth of Nations and the measured national IQs since obtained is very high (0.913). In the chart below, these estimates have been marked with an asterisk (*). The chart also includes the measured and estimated IQs from IQ and the Wealth of Nations.
Lynn and Vanhanen calculated the national IQs in relation to a British mean of 100, with a standard deviation of 15. They adjusted all test results to account for the Flynn effect: adjustments were 2 points per decade for Raven's Progressive Matrices and 3 points per decade for all other types of tests. When two IQ studies were used from one country, their mean was calculated, whereas when three or more were available, the median was used.[1] Lynn and Vanhanen recommend the provision of iodine and other micronutrients as a way to increase cognitive functioning in the Third World. The book additionally states that part of the reason IQ's have shrunk since the prior book was published, is due to more immigration from the Third World. Sweden's IQ for example dropped from 101% to 99%, and Germany 101 to 99. Since national immigration has been active prior to the first book, ethnic IQ is most likely even higher.
Country/Region IQ (2002)[2] IQ (2006)[1] PPP-GNI per capita 2002[1] QHC[1]  Hong Kong
107 108 27,490 60.8  Singapore
103 108 23,730 60.7  North Korea
105* 106* 1,000 38  South Korea
106 106 16,960 75.4  Japan
Japan105 105 27,380 71.4  Republic of China (Taiwan)
104 105 23,400 79.4  People's Republic of China
100 105 4,520 39.7  Italy
Italy102 102 26,170 78.9  Iceland
98* 101 29,240 80  Mongolia
98* 101* 1,710 48.1  Switzerland
101 101 31,840 82.2  Austria
102 100 28,910 80.7  Luxembourg
101* 100* 53,230 76.4  Netherlands
102 100 28,350 82.8  Norway
98 100 36,690 89  United Kingdom
100 100 26,580 76.7  Germany
102 99 26,980 78  Belgium
100 99 28,130 84.1  Canada
97 99 28,930 77.8  Estonia
97* 99 11,630 64.5  Finland
97 99 26,160 85.1  New Zealand
100 99 20,550 76.2  Poland
99 99 10,450 62.7  Sweden
101 99 25,820 82.9  Andorra
N/A 98* 19,000 58.7  Spain
Spain99 98 21,910 75.8  Australia
98 98 27,440 82.8  Czech Republic
97 98 14,920 64.5  Denmark
98 98 30,600 85.4  France
98 98 27,040 78.1  Hungary
99 98 13,070 64.1  Latvia
97* 98* 9,190 65.5  United States
98* 98* 36,120 86.6  Belarus
96* 97* 5,500 57.2  Malta
Malta95* 97 17,710 66.4  Russia
96 97 8,080 64.5  Ukraine
96* 97* 4,800 61.8  Moldova
95* 96* 1,600 46.2  Slovakia
96 96 12,590 63.2  Uruguay
96 96 7,710 64  Israel
94 95 19,000 75.3  Portugal
95 95 17,820 67  Armenia
93* 94* 3,230 50.2  Georgia
93* 94* 2,270 51.2  Kazakhstan
93* 94* 5,630 49  Romania
94 94 6,490 53  Vietnam
96* 94* 2,300 39.6  Argentina
96 93 10,190 64.7  Bulgaria
93 93 7,030 59.1  Greece
92 92 18,770 76.1  Malaysia
92 92 8,500 78.5  Ireland
93 92 29,570 52.1  Brunei
92* 91* 19,210 50.8  Cambodia
89* 91* 1,970 28.6  Cyprus
92* 91* 18,650 67.6  Lithuania
97* 91 10,190 65.4  Republic of Macedonia
93* 91* 6,420 54.4  Thailand
91 91 6,890 50.3  Albania
70* 70* 4,960 51.2  Bermuda
N/A 90 36,000 75.8  Bosnia and Herzegovina
N/A 90* 5,800 51.4  Chile
Chile93* 90 9,420 59.5  Croatia
90 90 10,000 61.7  Kyrgyzstan
87* 90* 1,560 48.1  Turkey
90 90 6,300 50.2  Mexico
87 90 12,500 52.9  Cook Islands
N/A 89 5,000 45.7  Costa Rica
91* 89* 8,650 53.7  Laos
Laos89* 89 1,660 24.9  Mauritius
81* 89 10,820 52.2  Suriname
89 89 6,590 50.6  Ecuador
80 88 3,340 47.4  Samoa
Samoa87 88 5,570 49.7  Azerbaijan
87* 87* 3,010 47.2  Bolivia
85* 87 2,390 49.7  Brazil
87 87 7,450 51.1  East Timor
N/A 87* 3,940 46.7  Guyana
84* 87* 3,070 40.2  Indonesia
89 87 1,600 28.1  Iraq
Iraq87 87 1,027 30.7  Burma
Burma86* 87* 930 42.4  Tajikistan
87* 87* 1,640 27.5  Turkmenistan
87* 87* 4,780 41.7  Uzbekistan
87* 87* 1,640 39.4  Kuwait
83* 86 17,780 49.9  Philippines
86 86 4,450 51.6  Seychelles
81* 86* 18,232 60.6  Tonga
Tonga87 86 6,820 40.5  Cuba
Cuba85 85 5,259 46.2  Fiji
Fiji84 85 5,330 51.9  Kiribati
84* 85* 800 37.1  New Caledonia
N/A 85 21,960 54.9  Peru
Peru90 85 4,880 49.2  Trinidad and Tobago
80* 85* 9,000 52  Yemen
Yemen83* 85 800 24.5  Afghanistan
83* 84* 700 13.2  Belize
83* 84* 15,960 56.1  Colombia
88 84 5,490 44.2  Federated States of Micronesia
84* 84* 6,150 48.4  Iran
Iran84 84 6,690 40.2  Jordan
87* 84 4,180 43.4  Marshall Islands
84 84 1,600 44.2  Morocco
85 84 2,000 39.9  Pakistan
81* 84 1,730 31.7  Panama
84* 84* 1,960 26.2  Paraguay
85* 84 6,060 56.6  Puerto Rico
84 84 4,590 45.2  Saudi Arabia
83* 84* 15,800 63.6  Solomon Islands
84* 84* 12,660 44.1  The Bahamas
78* 84* 1,590 41.5  United Arab Emirates
83* 84* 24,030 48.8  Vanuatu
84* 84* 2,850 31.4  Venezuela
88* 84 5,220 47.4  Algeria
84* 83* 5,530 39.9  Bahrain
83* 83* 16,190 49.3  Libya
Libya84* 83* 7,570 49.3  Oman
Oman83* 83* 13,000 40.6  Papua New Guinea
84* 83 2,180 38.4  Syria
Syria87* 83 5,348 38.9  Tunisia
84* 83* 6,440 40.6  Bangladesh
81* 82* 1,720 29.8  Dominican Republic
84* 82 6,270 46.8  India
India81 82 2,650 36.3  Lebanon
86 82 4,600 55.8  Madagascar
79* 82 730 28.6  Egypt
Egypt83 81 3,810 37.3  Honduras
84* 81 2,540 41.9  Maldives
81* 81* 4,798 38.5  Nicaragua
84* 81* 2,350 41.3  Northern Mariana Islands
N/A 81 12,500 51.3  Barbados
78 80 14,660 60.9  Bhutan
78* 80* 1,969 24.1  El Salvador
84* 80* 4,790 42.6  Guatemala
79 79 4,040 34.6  Sri Lanka
81* 79 3,510 47.7  Nepal
Nepal78 78 1,370 26.9  Qatar
Qatar78 78 19,844 45.6  Comoros
79* 77* 1,640 24.6  Cape Verde
78* 76* 4,920 40.5  Mauritania
73* 76* 1,790 20.5  Uganda
73 73 1,360 25.4  Kenya
Kenya72 72 1,010 27.3  South Africa
72 72 9,810 38.3  Tanzania
72 72 580 23.2  Ghana
Ghana71 71 2,080 33.7  Grenada
75* 71* 6,600 45.3  Jamaica
72 71 3,680 46.5  Saint Vincent and the Grenadines
75* 71 5,190 48.4  Sudan
Sudan72 71 1,740 24.6  Zambia
77 71 800 21.8  Antigua and Barbuda
75* 70* 10,390 53.2  Benin
Benin69* 70* 1,060 20.5  Botswana
72* 70* 7,740 29.4  Namibia
72* 70* 6,880 31.1  Rwanda
70* 70* 1,260 18.5  Togo
Togo69* 70* 1,450 26  Burundi
70* 69* 630 15.2  Côte d'Ivoire
71* 69* 1,450 18.1  Malawi
71* 69* 570 24.3  Mali
Mali68* 69* 840 13.4  Niger
Niger67* 69* 800 13.5  Nigeria
67 69 800 27.3  Angola
69* 68* 1,840 13.7  Burkina Faso
66* 68* 1,090 10.7  Chad
Chad72* 68* 1,010 20.4  Djibouti
68* 68* 2,040 22  Eritrea
68* 68* 1,040 21.4  Somalia
68* 68* 500 15.2  Swaziland
72* 68* 4,730 22.2  Dominica
75* 67 4,960 48.8  Guinea
63 67 2,060 22.5  Guinea-Bissau
63* 67* 680 20.3  Haiti
Haiti72* 67* 1,610 20.4  Lesotho
72* 67* 2,970 24.3  Liberia
64* 67* 1,000 21.2  Saint Kitts and Nevis
75* 67* 10,750 45.5  São Tomé and Príncipe
59* 67* 1,317 37.9  Senegal
64* 66* 1,660 20.7  The Gambia
64* 66* 1,540 21.3  Zimbabwe
66 66 2,180 25.2  Republic of the Congo
73 65 630 17.9  Cameroon
70* 64 1,910 23.1  Central African Republic
68* 64 1,170 19.1  Democratic Republic of the Congo
65 64 700 26.9  Ethiopia
71 71 780 29.7  Gabon
Gabon66* 64* 5,530 32.2  Mozambique
72* 64 990 18  Sierra Leone
64 64 500 13.8  Saint Lucia
75* 62 4,950 51.1  Equatorial Guinea
59 59 9,100 30.4 - "*" Denotes National IQ values estimated by Lynn and Vanhanen.
- PPP-GNI = purchasing power parity gross national income.
- QHC = is a composite index called quality of human conditions.
See also
Theories of Race and Intelligence:
- Evolution of human intelligence
- Cattell Culture Fair III
- Intelligence and public policy
- Racism
Publications of Race and Intelligence:
- IQ and the Wealth of Nations
- The Mismeasure of Man
- Race Differences in Intelligence
- The Global Bell Curve
External links
- Lynns posting of a favorable review that characterizes the 2006 work as a reply to criticisms of their earlier results
- A site critical of Lynn's claims
- National IQ means, calibrated on the basis of PISA scores and transformed from educational attainment
References
- ^ a b c d e Richard Lynn and Tatu Vanhanen (2006). IQ and Global Inequality. Washington Summit Publishers: Augusta, GA. ISBN 1593680252
- ^ a b Lynn, R. and Vanhanen, T. (2002). IQ and the wealth of nations. Westport, CT: Praeger. ISBN 0-275-97510-X
- ^ "Relevance of education and intelligence at the national level for politics: Democracy, rule of law and political liberty" (PDF). http://groups.uni-paderborn.de/rindermann/materialien/PublikationsPDFs/ISIRSF.pdf. Paper by Heiner Rindermann.
- ^ Älykkyyden tabu murtuu? Review by J.P. Roos in Sosiologia 3/2007.
- ^ a b c d Review by J. Philippe Rushton in Personality and Individual Differences, 2006, 41, 983-5. http://www.rlynn.co.uk/index.php?page=richard-lynn-and-tatu-vanhanen-iq-and-global-inequality-2006
- ^ a b c Wicherts, J. M., et al., A systematic literature review of the average IQ of Sub-Saharan Africans, Intelligence (2009), http://dx.doi.org/10.1016/j.intell.2009.05.002
- ^ a b Nisbett, Richard. 2009. Intelligence and how to get it. pp. 215.
- ^ a b Rindermann,H. (2007). The g-factor of international cognitive ability comparisons: The homogeneity of results in PISA, TIMSS, PIRLS and IQ-tests across nations. European Journal of Personality, 21, 6 67−706
- ^ http://www.pioneerfund.org/Grantees.html
- ^ Lynn & Vanhanen 2002 p.2
- ^ Temperature and evolutionary novelty as forces behind the evolution of general intelligence, Satoshi Kanazawa, Intelligence, Volume 36, Issue 2, March–April 2008, Pages 99-108 http://dx.doi.org/10.1016/j.intell.2007.04.001
- ^ "The average IQ of sub-Saharan Africans: Comments on Wicherts, Dolan, and van der Maas", Richard Lynna and Gerhard Meisenberg, Intelligence, Volume 38, Issue 1, January–February 2010, Pages 21-29 http://dx.doi.org/10.1016/j.intell.2009.09.009
- ^ The dangers of unsystematic selection methods and the representativeness of 46 samples of African test-takers, Jelte M. Wicherts, Conor V. Dolana and Han L.J. van der Maas, Intelligence Volume 38, Issue 1, January–February 2010, Pages 30-37
- ^ IQ in the Utility Function: Cognitive skills, time preference, and cross-country differences in savings rates, Garett Jones and Marta Podemska, (Presented at Canadian Economics Association meetings, June 2010) http://mason.gmu.edu/~gjonesb/
- ^ Christopher Eppig, Corey L. Fincher, and Randy Thornhill Parasite prevalence and the worldwide distribution of cognitive ability Proc R Soc B 2010: rspb.2010.0973v1-rspb20100973. http://rspb.royalsocietypublishing.org/content/early/2010/06/29/rspb.2010.0973.abstract
- ^ IQ IN THE PRODUCTION FUNCTION: EVIDENCE FROM IMMIGRANT EARNINGS, GARETT JONES1, W. JOEL SCHNEIDER2, conomic Inquiry, Volume 48, Issue 3, pages 743–755, July 2010 http://onlinelibrary.wiley.com/doi/10.1111/j.1465-7295.2008.00206.x/full
- ^ Mankind Quarterly, Vol. 50, No. 4 (Summer 2010) pp. 275-296, "National IQs updated for 41 Nations", Richard Lynn. http://www.mankindquarterly.org/summer2010_lynn.html
- ^ Rindermann, Heiner: The g-factor of international cognitive ability comparisons: the homogeneity of results in PISA, TIMSS, PIRLS and IQ-tests across nations. European Journal of Personality 21 (2007) 667-706 [1]
Lists of countries by financial rankings Trade Investment Funds Forex reserves · Gold reserves · Sovereign wealth funds · Pension funds · List of sovereign states by external assetsBudget and debt Income and taxes Banking Central bank interest rate · Commercial bank prime lending rateCurrency Exchange rates to US$ · Inflation rateOther Lists of countries by GDP rankings · Lists by country · List of international rankings · List of top international rankings by country Lists of countries by GDP rankings Nominal Purchasing power parity (PPP) Per capita · Past to 1 AD (per capita) · Future (per capita) · Per hour · Per person employed · Relative differences between bordering countries per capitaGrowth Gross national income (GNI) Nominal · PPPCountries by region Africa (nominal · PPP) · Latin America & Caribbean (nominal · PPP) · North America (nominal · PPP) · South America (nominal · PPP) · Arab League · Asia · Asia & Pacific (nominal · nominal per capita · PPP) · Former Soviet Republics · Europe (nominal · nominal per capita · PPP · PPP per capita) · OceaniaSubnational divisions Argentina · Australia · Brazil · Canada · Chile (per capita) · China (per capita · top cities) · Croatia · France · Germany · India · Indonesia · Italy · Japan · Mexico · Pakistan · Russia · South Korea (per capita) · Spain · U.S. (comparison with countries)
Top country subdivisions by GDP (nominal)Lists of countries by financial rankings · Lists by country · List of international rankings · List of top international rankings by country Categories:- Race and intelligence controversy
- Psychology books
- Economics books
Wikimedia Foundation. 2010.