- Demographics of Estonia
-
The demographics of Estonia in the twenty-first century are the result of historical trends over more than a thousand years, just as for most European countries, but have been disproportionately affected by events in the last half of the twentieth century. Impact from the rise and fall of the Soviet Union, including the annexation and eventual independence of Estonia, has had a major effect on Estonia's ethnic makeup and educational achievement.
Languages spoken in Estonia are largely reflective of the ethnic groups composing the country, and thus have changed with historical trends affecting the ethnic makeup of the country. Religion plays a small part in the lives of most Estonians, largely as a result of the Soviet occupation from 1944–1991.
Overall, the quality of life indices for Estonia are reflective of a modern industrial state, with one major exception: The population of Estonia is shrinking. While there are other European countries like Estonia with a birthrate that is at less than replacement levels, Estonia lacks the immigration found, for example, in Germany. As such, the population is on a slow downward trend. However, in the most recent years the decline has slowed down considerably and according to preliminary figures the population stabilized in 2010.[1] If the current trends continue, some population growth can be foreseen for the coming years.
Contents
Historical ties
See also: History of EstoniaEstonians have strong ties to the Nordic countries and Germany stemming from the strong cultural and religious influences gained over centuries during Danish, German and Swedish rule and settlement. This highly literate society places strong emphasis upon education, which is free and compulsory until age 16.
In the twentieth century, Estonia's ethnic makeup was altered radically by policies implemented by the Soviet government. Large numbers of ethnic Russians were incentivized to move into the non-Russian republics, including Estonia. The population was further altered by Joseph Stalin's mass deportations and executions while many people simply left as a result of World War II.
Population
Population decline in Estonia
 Population of Estonia (1970–2010). Data by Statistics Estonia (2010).[1]
 Natural population increase of Estonia from 1945–2008. Data is taken from Statistics Estonia.[2]
-
Number of births
-
Number of deaths
-
Natural population increase
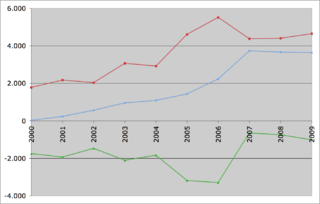 External migration of Estonia from 2000–2009. Data is taken from Statistics Estonia.[3]
-
Number of immigrants
-
Number of emigrants
-
Total external migration
According to data from Statistics Estonia, the population of Estonia is shrinking. While there are other European countries like Estonia with a birthrate that is below replacement levels, Estonia lacks immigration to compensate for the negative natural growth. In fact, the number of emigrants is larger than the number of immigrants. As such, the population is on a slow downward trend. The population increased from 1,351,640 in January 1970 to 1,570,599 in January 1990. Since 1990, Estonia lost about 15% of its population (230,000 people). The population decreased to 1,340,194 in January 2011, which is even lower than the number of people that lived in Estonia in 1970.
- 1,340,194 (January 1, 2011; Statistics Estonia)[1]
- 1,340,415 (January 1, 2009; Statistics Estonia)[4][5]
- 1,376,743 (March 31, 2000; last census)[6]
Although there is a downward population curve, explained by a larger death than birth rate, as well as a larger number of emigrants than immigrants, the line graph of the natural population increase shows the rate of population decrease is slowly diminishing.
Age structure
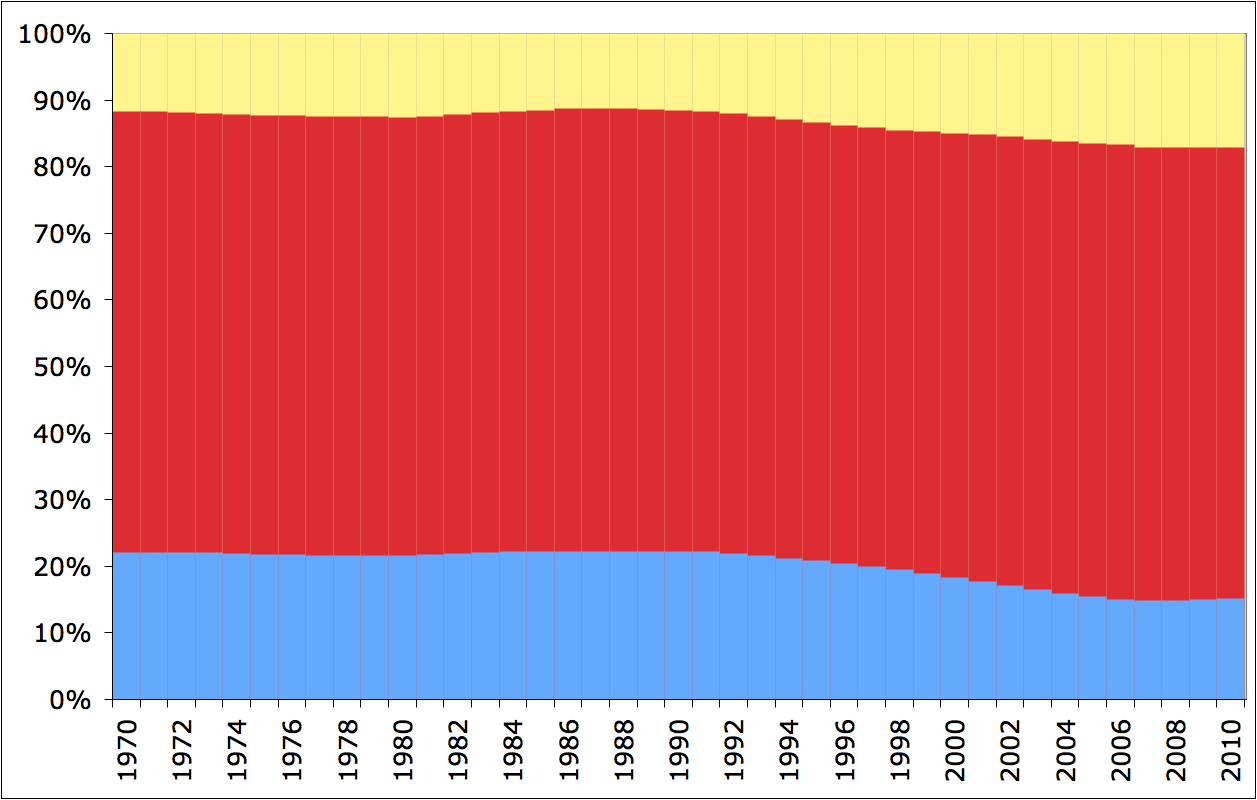
 Age structure of Estonia from 1970–2010. Data is taken from Statistics Estonia.[1]
 Age: 0–14Age: 15–64Age: 65+
 Population pyramid of Estonia (in thousands) from 2009. Data is from January 1, 2009 and taken from Statistics Estonia.[1]
Between 1970 and 1990 the age structure of Estia was rather stable with around 22% of the population in the age group 0–14 years, 66% between 15 and 65, while 12% was 65 years or older [1]. Due to the low birth rates after 1990, the proportion of the population 0–14 years of age dropped to 15% in 2009, while the proportion of 65 years or older gradually increased to 17% in 2009. The proportion of the age group 15-64 also slightly increased to 68% in 2009.
Births and deaths
From 1947–1989 the number of births was higher than the number of deaths, but from 1990 onwards the number of deaths outnumbered the number of births. The crude birth rate of 2008 was 11.76 (15,763 births) and the crude death rate of 2008 was 12.00 (16,081 deaths), making the rate of natural increase −0.24 (−318).[2] For more detailed historic data, see the table of birth and death rates below.
Total fertility rate
Between 1970 and 1990, the total fertility rate (TFR) was little over 2 children born per woman [2]. A fast decrease of the TFR occurred after independence. In 1998 the lowest rate was recorded: 1.28 children born per women. The TFR slightly recovered in the subsequent years. The TFR was 1.66 in 2008 en 1.63 in 2009.
Infant mortality rate
The infant mortality rate in Estonia has decreased considerably during the past decades. In 1970 the rate was 17.7 per 1,000 liver births [3]. The rate decreased to 17.1 in 1980, 12.3 in 1990 and 8.4 in 2000. The lowest infant mortality rate was recorded in 2009: 3.6.
Life expectancy at birth
Life expectancy in Estonia is lower than in most Western European countries. During the Soviet era life expactancy in males was between 64 en 66 years and in females between 73 and 75 years [4]. After the independence, life expectancy decreased for a number of years. In 1994, the lowest life expectancy was recorded: 60.5 years in males and 72.8 in females. After 1994, life expectancy gradually increased to reach 69.8 years in males and 80.1 in females in 2009.
Migration
As the cumulative negative natural growth was about 82,000 during 1991-2010, the remainder of the population decline of Estonia since 1990 (230,000 people in total) was caused by emigration (150,000 people or about 10% of the population of Estonia in 1990). Mainly ethnic Russians, Ukrainians and Belarussians emigrated. Consequently the proportion of these ethnic groups decreased as can be seen in the results of the 2000 census (see below). Data from 2000–2009 also shows that the number of emigrants is larger than the number of immigrants, but on a much lower lever than in the 1990s.[3]
Ethnic groups
See also: Estonian Swedes, Baltic Germans, Baltic Russians, Russians in Estonia, Armenians in Estonia, Võros, and SetosToday, Estonia is a ethnically fairly diverse country, ranking 97th out of 239 countries and territories in 2001 study by Kok Kheng Yeoh.[7] In 2008, thirteen of Estonia's fifteen counties were over 80% ethnic Estonian. The counties with the highest percentage Estonians are Hiiu County (98.4%) and Saare County (98.3%). However, in Harju County (which includes the national capital, Tallinn) and Ida-Viru County, ethnic Estonians make up only 59.6% (55.0% in Tallinn) and 19.7% of the population, respectively. In those two counties, Russians account for 32.4% (36.4% in Tallinn) and 71.2% of the population, respectively. In the nation as a whole, Russians make up 25.6% of the total population.[8]
After gaining independence following World War I a population census was held in 1922 and 1934. At that time Estonians were still the predominant ethnic group, while all others constituted 12% of the population of Estonia.
Major Jewish communities were present in Estonia between 1918 and 1940 in Tallinn, Pärnu, Kilingi-Nõmme, Narva, Tartu, Valga, and Võru.[9]
Population of Estonia according to ethnic group 1922–2006 Ethnic
groupcensus 19221 census 19341 census 19592 census 19703 census 19794 census 19895 census 2000 [5] 20096 Number % Number % Number % Number % Number % Number % Number % Number % Estonians 969,976 87.6 992,520 88.1 892,653 74.6 925,157 68.2 947,812 64.7 963,281 61.5 930,219 67.9 921,484 68.7 Russians 91,109 8.2 92,656 8.2 240,227 20.1 334,620 24.7 408,778 27.9 474,834 30.3 351,178 25.6 342,966 25.6 Ukrainians — 92 0.0 15,769 1.3 28,086 2.1 36,044 2.5 48,271 3.1 29,012 2.1 27,878 2.1 Belarusians — — 10,930 0.9 18,732 1.4 23,461 1.6 27,711 1.8 17,241 1.3 15,717 1.2 Finns 401 0.0 1,088 0.1 16,699 1.4 18,537 1.4 17,753 1.2 16,622 1.1 11,837 0.9 10,767 0.8 Tatars — 166 0.0 1,534 0.1 2,204 0.2 3,195 0.2 4,058 0.3 2,582 0.2 2,461 0.2 Latvians 1,966 0.2 5,435 0.5 2,888 0.2 3,286 0.2 3,963 0.3 3,135 0.2 2,330 0.2 2,199 0.2 Poles 969 0.1 1,608 0.1 2,256 0.2 2,651 0.2 2,897 0.2 3,008 0.2 2,193 0.2 2,035 0.2 Jews 4,566 0.4 4,434 0.4 5,433 0.5 5,282 0.4 4,954 0.3 4,613 0.3 2,145 0.2 1,830 0.1 Lithuanians 436 0.0 253 0.0 1,616 0.1 2,356 0.2 2,379 0.2 2,568 0.2 2,116 0.2 2,072 0.2 Germans 18,319 1.7 16,346 1.5 670 0.1 7,850 0.6 3,944 0.3 3,466 0.2 1,870 0.1 1,905 0.1 Swedes 7,850 0.7 7,641 0.7 — 435 0.0 254 0.0 297 0.0 300 0.0 — Others 11,467 1.0 4,266 0.4 6,116 0.5 6,883 0.5 9,042 0.6 13,798 0.9 17,0297 1.2 9,101 0.7 Total 1,107,059 1,126,413 1,196,791 1,356,079 1,464,476 1,565,662 1,370,052 1,340,415 1 Source: [6]. 2 Source: [7]. 3 Source: [8]. 4 Source: [9]. 5 Source: [10]. 6 Source: [11] 7 including 1,444 Armenians, 880 Azeri, 645 Moldavians, 562 Mordvins, 542 Romani, 495 Chuvash, 430 Georgians, 430 Karelians, 358 Izhorians, 245 Mari, 241 Udmurts, 204 Bulgarians, 172 Hungarians, 169 Koreans, 152 Bashkirs, 150 Greeks, 138 Komi, 133 US Americans, 132 Uzbeks, 127 Kazakhs, 121 Lezghins, 116 Ossetians, 1,224 others (all less than 100) and 7,919 ethnicity unknown
As a result of the aforementioned Soviet policies, the share of ethnic Estonians in the population resident within currently defined boundaries of Estonia dropped to 61.5% in 1989, compared to 88% in 1934.[10] But in the decade following the reconstitution of independence, large scale emigration by ethnic Russians, as well as ethnic groups of other former Soviet countries, and the removal of the Russian military bases in 1994 caused the proportion of ethnic Estonians in Estonia to increase from 61.5% in 1989 to 68.7% in 2008. In the same period the proportion of ethnic Russians decreased from 30.0% to 25.6%, the proportion of ethnic Ukrainians decreased from 3.1% to 2.1%, and the proportion of ethnic Belarusians decreased from 1.8% to 1.2%.[8][10]
 Citizenship of the population of Estonia in 2010. Data is taken from Statistics Estonia.[11]Estonian: 1.148.895Russian: 95.939Others: 21.517Undetermined: 99.173
As of 2008, the largest ethnic groups in Estonia are Estonians (68.7%), Russians (25.6%), Ukrainians (2.1%), Belarusians (1.2%), and Finns (0.8%). These five groups made up 98.4% of Estonia's population.[8]
Languages
Many languages are spoken in Estonia, including Estonian (official), Russian, Ukrainian, English, Finnish, German and others.
Estonian and Finnish are closely related, belonging to the same Finnic branch of the Uralic language family. Nevertheless, the two languages are not mutually intelligible, although educated native speakers can read the other language with a greater or lesser degree of understanding. Estonian and Finnish are only distantly related to the Hungarian language.
Written with the Latin alphabet, Estonian is the language of the Estonian people and the official language of the country. One-third of the standard vocabulary is derived from adding suffixes to root words. The oldest known examples of written Estonian originate in 13th century chronicles. During the Soviet era, the Russian language was imposed in parallel to, and often instead of, Estonian in official use.
Religion
According to the most recent Eurobarometer Poll 2005,[12] 16% of Estonian citizens responded that "they believe there is a god", whereas 54% answered that "they believe there is some sort of spirit or life force" and 26% that "they do not believe there is any sort of spirit, god, or life force". This, according to the survey, would have made Estonians the most non-religious people in the then 25-member European Union. A survey conducted in 2006–2008 by Gallup showed that 14% of Estonians answered positively to the question: "Is religion an important part of your daily life?", which was the lowest among 143 countries polled.[13] Historically, however, Estonia used to be a stronghold of Lutheranism due to its strong links to the Nordic countries.[citation needed]
Less than a third of the population define themselves as believers, of those the majority are Lutheran, whereas the Russian minority is Eastern Orthodox. Ancient equinoctial traditions (like St John's Day) are held in high regard. In 2000, according to the census, 29.2% of the population considered themselves to be related to any religion, thereof:[14]
- 13.6% Lutheran Christians
- 12.8% Orthodox Christians
- 6,009 Baptists
- 5,745 Roman Catholics
- 4,268 Jehovah's Witnesses
- 2,648 Pentecostals
- 2,515 Old Believers
- 1,561 Adventists
- 1,455 Methodists
- 1,387 Muslims
- 5,008 followers of other religions
There are also a number of smaller Protestant, Jewish, and Buddhist groups. The organisation Maavalla Koda unites adherents of animist traditional religions.[15][16][17]
Table of birth and death rates
- Source: Statistics Estonia
Average population (x 1000) Live births Deaths Natural change Crude birth rate (per 1000) Crude death rate (per 1000) Natural change (per 1000) 1914 1,197 26,865 20,882 5,983 22.4 17.4 5.0 1915 1,188 24,680 21,841 2,839 20.8 18.4 2.4 1916 1,154 21,282 25,429 −4,147 18.4 22.0 −3.6 1917 1,120 18,333 27,336 −9,003 16.4 24.4 −8.0 1918 1,086 21,659 32,488 −10,829 19.9 29.9 −10.0 1919 1,064 18,456 28,800 −10,344 17.3 27.1 −9.7 1920 1,068 19,625 21,363 −1,738 18.4 20.0 −1.6 1921 1,087 22,067 17,143 4,924 20.3 15.8 4.5 1922 1,102 22,255 18,401 3,854 20.2 16.7 3.5 1923 1,111 22,347 16,630 5,717 20.1 15.0 5.1 1924 1,116 21,441 16,918 4,523 19.2 15.2 4.1 1925 1,117 20,445 16,680 3,765 18.3 14.9 3.4 1926 1,117 19,977 18,047 1,900 17.9 16.2 1.7 1927 1,116 19,705 19,356 500 17.7 17.3 0.4 1928 1,116 20,064 17,785 2,279 18.0 15.9 2.0 1929 1,116 19,110 20,178 −1,068 17.1 18.1 −1.0 1930 1,116 19,471 16,610 2,861 17.4 14.9 2.6 1931 1,118 19,509 18,077 1,432 17.4 16.2 1.3 1932 1,122 19,742 16,641 3,101 17.6 14.8 2.8 1933 1,124 18,208 16,472 1,736 16.2 14.7 1.5 1934 1,126 17,305 15,853 1,452 15.4 14.1 1.3 1935 1,129 17,891 16,864 1,027 15.8 14.9 0.9 1936 1,130 18,222 17,594 628 16.1 15.6 0.6 1937 1,131 18,190 16,614 1,576 16.1 14.7 1.4 1938 1,133 18,453 16,496 1,957 16.3 14.6 1.7 1939 1,128 18,475 17,101 1,374 16.4 15.2 1.2 1940 1,096 18,407 19,024 −617 16.8 17.4 −0.6 1941 1,044 19,574 23,702 −4,128 18.8 22.7 −4.0 1942 1,017 19,242 20,276 −1,034 18.9 19.9 −1.0 1943 1,006 16,001 18,120 −2,119 15.9 18.0 −2.1 1944 990 15,180 24,700 −9,520 15.3 24.9 −9.6 1945 879 14,968 20,708 −5,740 17.0 23.6 −6.5 1946 928 19,408 19,969 −561 20.9 21.5 −0.6 1947 977 22,721 21,492 1,229 23.3 22.0 1.3 1948 1,026 21,777 17,549 4,228 21.2 17.1 4.1 1949 1,074 21,770 16,730 5,040 20.3 15.6 4.7 1950 1,101 20,279 15,817 4,462 18.4 14.4 4.1 1951 1,114 20,730 15,354 5,376 18.6 13.7 4.8 1952 1,126 21,111 15,817 5,294 18.7 14.0 4.7 1953 1,138 20,146 14,420 5,726 17.7 12.7 5.0 1954 1,149 20,909 13,981 6,928 18.2 12.2 6.0 1955 1,160 20,786 13,638 7,148 17.9 11.8 6.2 1956 1,171 19,660 12,748 6,912 16.8 10.9 5.9 1957 1,181 19,509 13,026 6,483 16.5 11.0 5.5 1958 1,192 19,598 12,971 6,627 16.4 10.9 5.6 1959 1,203 19,938 13,130 6,808 16.5 10.9 5.7 1960 1,216 20,187 12,738 7,449 16.6 10.5 6.1 1961 1,229 20,230 13,036 7,194 16.5 10.6 5.9 1962 1,243 19,959 13,495 6,464 16.1 10.9 5.2 1963 1,258 19,275 13,251 6,024 15.3 10.5 4.8 1964 1,276 19,629 12,754 6,875 15.4 10.0 5.4 1965 1,291 18,909 13,520 5,389 14.6 10.5 4.2 1966 1,303 18,629 13,800 4,829 14.3 10.6 3.7 1967 1,314 18,671 13,699 4,972 14.2 10.4 3.8 1968 1,327 19,782 14,225 5,557 14.9 10.7 4.2 1969 1,345 20,781 15,150 5,631 15.5 11.3 4.2 1970 1,360 21,552 15,186 6,366 15.8 11.2 4.7 1971 1,377 22,118 15,038 7,080 16.1 10.9 5.1 1972 1,393 21,757 15,520 6,237 15.6 11.1 4.5 1973 1,406 21,239 15,573 5,666 15.1 11.1 4.0 1974 1,418 21,461 15,393 6,068 15.1 10.9 4.3 1975 1,429 21,360 16,572 4,788 14.9 11.6 3.4 1976 1,440 21,801 17,351 4,450 15.1 12.0 3.1 1977 1,450 21,977 17,094 4,883 15.2 11.8 3.4 1978 1,460 21,842 17,812 4,030 15.0 12.2 2.8 1979 1,468 21,879 18,062 3,817 14.9 12.3 2.6 1980 1,477 22,204 18,199 4,005 15.0 12.3 2.7 1981 1,488 22,937 18,349 4,588 15.4 12.3 3.1 1982 1,498 23,128 17,893 5,235 15.4 11.9 3.5 1983 1,509 24,155 18,190 5,965 16.0 12.1 4.0 1984 1,519 24,234 19,086 5,148 16.0 12.6 3.4 1985 1,529 23,630 19,343 4,287 15.5 12.7 2.8 1986 1,540 24,106 17,986 6,120 15.7 11.7 4.0 1987 1,552 25,086 18,279 6,807 16.2 11.8 4.4 1988 1,562 25,060 18,551 6,509 16.0 11.9 4.2 1989 1,568 24,318 18,536 5,762 15.5 11.8 3.7 1990 1,569 22,304 19,531 2,778 14.2 12.4 1.8 1991 1,561 19,413 19,715 −302 12.4 12.6 −0.2 1992 1,533 18,038 20,126 −2,088 11.8 13.1 −1.4 1993 1,494 15,253 21,286 −6,033 10.2 14.2 −4.0 1994 1,463 14,176 22,212 −8,036 9.7 15.2 −5.5 1995 1,437 13,509 20,828 −7,319 9.4 14.5 −5.1 1996 1,416 13,242 19,020 −5,778 9.4 13.4 −4.1 1997 1,400 12,577 18,572 −5,995 9.0 13.3 −4.3 1998 1,386 12,167 19,445 −7,278 8.8 14.0 −5.3 1999 1,376 12,425 18,447 −6,022 9.0 13.4 −4.4 2000 1,369 13,067 18,403 −5,336 9.5 13.4 −3.9 2001 1,364 12,632 18,516 −5,884 9.3 13.6 −4.3 2002 1,359 13,001 18,355 −5,354 9.6 13.5 −3.9 2003 1,354 13,036 18,152 −5,116 9.6 13.4 −3.8 2004 1,349 13,992 17,685 −3,693 10.4 13.1 −2.7 2005 1,346 14,350 17,316 −2,966 10.7 12.9 −2.2 2006 1,344 14,877 17,316 −2,439 11.1 12.9 −1.8 2007 1,342 15,775 17,409 −1,634 11.8 13.0 −1.2 2008 1,341 16,028 16,675 −647 12.0 12.4 −0.5 2009 1,340 15,763 16,081 −318 11.8 12.0 −0.2 2010 1,340 15,825 15,790 35 11.8 11.8 0.0 See also
References
- ^ a b c d e "Population by sex and age group, 1 January". Statistics Estonia. 2010-01-22. http://pub.stat.ee/px-web.2001/Dialog/varval.asp?ma=PO021&ti=POPULATION+BY+SEX+AND+AGE+GROUP%2C+1+JANUARY&path=../I_Databas/Population/01Population_indicators_and_composition/04Population_figure_and_composition/&lang=1. Retrieved 2010-03-29.
- ^ a b "Births, deaths and natural increase". Statistics Estonia. 2009-05-12. http://pub.stat.ee/px-web.2001/Dialog/varval.asp?ma=PO030&ti=BIRTHS%2C+DEATHS+AND+NATURAL+INCREASE&path=../I_Databas/Population/01Population_indicators_and_composition/02Main_demographic_indicators/&lang=1. Retrieved 2009-09-30.
- ^ a b "Migration by administrative unit/type of settlement, sex and type of migration". Statistics Estonia. 2010-05-26. http://pub.stat.ee/px-web.2001/Dialog/varval.asp?ma=POR01&ti=MIGRATION+BY+ADMINISTRATIVE+UNIT%2FTYPE+OF+SETTLEMENT%2C+SEX+AND+TYPE+OF+MIGRATION&path=../I_Databas/Population/03Vital_events/14Migration/&lang=1. Retrieved 2010-08-23.
- ^ Enim nõutud statistika (Most wanted statistics), Statistics Estonia (retrieved 2011-06-16)
- ^ Eesti Statistika aastaraamat. 2009. Statistical yearbook of Estonia. Statistics Estonia. 2009-07-31. ISBN 9789985744529. http://www.stat.ee/file.php?36947.
- ^ (in Estonian and English) (PDF) 2000. Aasta rahva ja eluruumide loendus (Population and Housing Census). 2. Statistikaamet (Statistical Office of Estonia). 2001. ISBN 9985-74-202-8. http://www.stat.ee/dokumendid/26495. Retrieved 2009-09-23.
- ^ "TOWARDS AN INDEX OF ETHNIC FRACTIONALIZATION". University of Malaya. 2008-10-17. http://cmsad.um.edu.my/images/fep/doc/2001%20Pdf/FEA-WP-2001-003.pdf. Retrieved 2010-10-11.
- ^ a b c "Population by sex, ethnic nationality and county, 1 January". Statistics Estonia. 2008-10-17. http://pub.stat.ee/px-web.2001/Dialog/varval.asp?ma=PO0222&ti=POPULATION+BY+SEX%2C+ETHNIC+NATIONALITY+AND+COUNTY%2C+1+JANUARY&path=../I_Databas/Population/01Population_indicators_and_composition/04Population_figure_and_composition/&lang=1. Retrieved 2009-10-05.
- ^ Encyclopaedia Judaica. 6. 1971. http://www.geschichteinchronologie.ch/eu/estland/EncJud_juden-in-Estland-ENGL.html.
- ^ a b (in Estonian and English) (PDF) Eesti rahvastik rahvaloenduste andmetel (Population of Estonia by population censuses). 2. Eesti Statistikaamet (Statistical Office of Estonia). 1996. ISBN 9985-826-44-2. http://www.stat.ee/dokumendid/26380. Retrieved 2009-10-05.
- ^ "Citizenship". Estonia.eu. 2010-07-02. http://estonia.eu/about-estonia/society/citizenship.html. Retrieved 2010-08-20.
- ^ "Eurobarometer on Social Values, Science and technology 2005" (PDF). p. 11. http://ec.europa.eu/public_opinion/archives/ebs/ebs_225_report_en.pdf. Retrieved 2007-05-05.
- ^ Crabtree, Steve; Pelham, Brett (February 9, 2009). "What Alabamians and Iranians Have in Common". Gallup. http://www.gallup.com/poll/114211/Alabamians-Iranians-Common.aspx. Retrieved 21 February 2010.
- ^ "Statistical database: Population Census 2000 – Religious affiliation". Statistics Estonia. 22 October 2002. http://pub.stat.ee/px-web.2001/I_Databas/Population_census/16Religious_affiliation/16Religious_affiliation.asp. Retrieved 2011-02-18.
- ^ http://www.maavald.ee/eng/uudised.html?rubriik=50&id=363&op=lugu
- ^ http://www.einst.ee/culture/II_MMIII/kaasik.html
- ^ Barry, Ellen (2008-11-09). "Some Estonians return to pre-Christian animist traditions". The New York Times. http://www.nytimes.com/2008/12/09/world/europe/09iht-estonia.4.18535971.html.
Demographics of Europe Sovereign
states- Albania
- Andorra
- Armenia
- Austria
- Azerbaijan
- Belarus
- Belgium
- Bosnia and Herzegovina
- Bulgaria
- Croatia
- Cyprus
- Czech Republic
- Denmark
- Estonia
- Finland
- France
- Georgia
- Germany
- Greece
- Hungary
- Iceland
- Ireland
- Italy
- Kazakhstan
- Latvia
- Liechtenstein
- Lithuania
- Luxembourg
- Macedonia
- Malta
- Moldova
- Monaco
- Montenegro
- Netherlands
- Norway
- Poland
- Portugal
- Romania
- Russia
- San Marino
- Serbia
- Slovakia
- Slovenia
- Spain
- Sweden
- Switzerland
- Turkey
- Ukraine
- United Kingdom
- (England
- Northern Ireland
- Scotland
- Wales)
- Vatican City
States with limited
recognition- Abkhazia
- Kosovo
- Nagorno-Karabakh
- Northern Cyprus
- South Ossetia
- Transnistria
Dependencies
and other territories- Åland
- Faroe Islands
- Gibraltar
- Guernsey
- Jan Mayen
- Jersey
- Isle of Man
- Svalbard
Other entities - European Union
Categories: -


Wikimedia Foundation. 2010.