- Cheadle (UK Parliament constituency)
-
Coordinates: 53°23′46″N 2°12′14″W / 53.396°N 2.204°W
Cheadle Borough constituency for the House of Commons 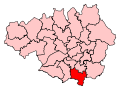
Boundary of Cheadle in Greater Manchester.County Greater Manchester Electorate 71,797 (December 2010)[1] Major settlements Cheadle Current constituency Created 1950 Member of Parliament Mark Hunter (Liberal Democrat) Number of members One Overlaps European Parliament constituency North West England Cheadle is a borough constituency represented in the House of Commons of the Parliament of the United Kingdom. It elects one Member of Parliament (MP) by the first-past-the-post voting system.
It is a marginal seat between the Conservatives and the Liberal Democrats. From 1970 until 2001 it was held by the Conservatives, but is now held by the Liberal Democrats.
Contents
Boundaries
 Cheadle election results (click for larger version)
When originally created in 1950, the Cheadle county constituency was defined as being the Urban Districts of Bredbury and Romiley, Cheadle and Gatley, Hazel Grove and Bramhall, and Marple. The area was predominantly urban in the south-eastern suburbs of the Manchester conurbation, and reasonably prosperous. The boundary was changed in 1955 when the boundaries of Bredbury and Romiley Urban District with the County Borough of Stockport were altered, but this change was very minor.
The growth of suburbs of Manchester led to a rapidly rising electorate from the late 1950s and by the 1970 election there were 107,225 electors and some reduction was inevitable. At the February 1974 General Election the constituency was divided in two, with the eastern parts forming the new Hazel Grove constituency. The creation of Hazel Grove took too many electors away and to replace them came the town of Wilmslow. The new constituency, which was a borough seat rather than a county one, was defined as the Urban Districts of Cheadle and Gatley, and Wilmslow.
As a result of changes in the county boundaries, the constituency crossed between Greater Manchester and Cheshire. Realigning with the county boundaries in 1983, the constituency was refashioned as a part of the Metropolitan Borough of Stockport, losing Wilmslow to Tatton, and smaller parts to Macclesfield and Stockport. It retook some 20,000 voters from Hazel Grove to make up the loss. It was now defined as the following wards of Stockport: Cheadle and Gatley, Cheadle Hulme North, Cheadle Hulme South, Bramhall South, Heald Green, Stepping Hill and Bramhall North.
At the 1997 general election, minor changes were made around the north-western part to align the boundary with changes in the municipal boundaries, which resulted in gaining a small amount of Gatley from Manchester Wythenshawe.
Members of Parliament
The current MP is the Liberal Democrat Mark Hunter who was elected on 14 July 2005 in a by-election triggered by the death of fellow Liberal Democrat Patsy Calton on 29 May 2005.
The seat had safe Conservative majorities until the 1997 election,when the Liberal Democrats reduced the margin to around 3,000 votes. Patsy Calton scraped home in 2001 by a majority of 33 votes, the narrowest in the House of Commons, but returned with a much safer 4,000 votes in 2005.
Election Member[2] Party 1950 William Shepherd Conservative 1966 Dr Michael Winstanley Liberal 1970 Tom Normanton Conservative 1987 Stephen Day Conservative 2001 Patsy Calton Liberal Democrat 2005 by-election Mark Hunter Liberal Democrat Elections
Elections in the 2010s
General Election 2010: Cheadle Party Candidate Votes % ±% Liberal Democrat Mark Hunter 24,717 47.1 -0.7 Conservative Ben Jeffreys 21,445 40.8 +0.5 Labour Martin Miller 4,920 9.4 -0.5 UKIP Tony Moore 1,430 2.7 N/A Majority 3,272 6.2 -1.2 Turnout 52,512 72.5 +3.7 Liberal Democrat hold Swing -0.6 Elections in the 2000s
By-election 2005: Cheadle Party Candidate Votes % ±% Liberal Democrat Mark Hunter 19,593 52.2 +3.3 Conservative Stephen Day 15,936 42.4 +2.0 Labour Martin Miller 1,739 4.6 -4.2 Veritas Leslie Leggett 218 0.6 N/A Alliance for Change (UK) John Allman 81 0.2 N/A Majority 3,657 9.7 Turnout 37,567 55.2 -14.4 Liberal Democrat hold Swing +0.6 General Election 2005: Cheadle Party Candidate Votes % ±% Liberal Democrat Patsy Calton 23,189 48.9 +6.5 Conservative Stephen Day 19,169 40.4 -1.9 Labour Martin Miller 4,169 8.8 -5.2 UKIP Vincent Cavanagh 489 1.0 -0.4 BNP Richard Chadfield 421 0.9 N/A Majority 4,020 8.5 Turnout 47,437 69.6 +6.4 Liberal Democrat hold Swing +4.2 General Election 2001: Cheadle Party Candidate Votes % ±% Liberal Democrat Patsy Calton 18,477 42.4 +4.6 Conservative Stephen Day 18,444 42.3 -1.3 Labour Howard Dawber 6,086 14.0 -1.7 UKIP Vincent Cavanagh 599 1.4 Majority 33 0.1 Turnout 43,606 63.2 -14.1 Liberal Democrat gain from Conservative Swing +2.95 Elections in the 1990s
The Cheadle constituency underwent minor boundary changes after the 1992 general election and as such the change in share of vote is based on a national calculation.
General Election 1997: Cheadle Party Candidate Votes % ±% Conservative Stephen Day 22,944 43.7 -14.0 Liberal Democrat Patsy Calton 19,755 37.7 +8.1 Labour Paul Diggett 8,253 15.7 +3.3 Referendum Party Paul Brook 1,511 2.9 Majority 3,189 6.0 Turnout 52,463 77.3 Conservative hold Swing -11.05 General Election 1992: Cheadle[3] Party Candidate Votes % ±% Conservative Stephen Day 32,504 58.2 +3.2 Liberal Democrat Patsy Calton 16,726 30.0 −5.9 Labour Sandra Broadhurst 6,442 11.5 +2.4 Natural Law Phillipa Whittle 168 0.3 N/A Majority 15,778 28.2 +9.1 Turnout 55,840 84.4 +3.4 Conservative hold Swing +4.6 Elections in the 1980s
General Election 1987: Cheadle Party Candidate Votes % ±% Conservative Stephen Day 30,484 55.0 -0.7 Liberal Brian Leah 19,853 35.9 -1.4 Labour Ann Coffey 5,037 9.1 +2.1 Majority 10,631 19.1 Turnout 55,374 81.0 +4.2 Conservative hold Swing The boundaries of the constituency changed in 1983. Changes in the vote are based on the estimated results for 1979 had the 1983 boundaries been in operation then.
General Election 1983: Cheadle Party Candidate Votes % ±% Conservative Tom Normanton 28,452 55.7 -4.5 Liberal Paul Clark 19,072 37.3 +9.0 Labour Kenneth Parker 3,553 7.0 -4.5 Majority 9,380 18.4 Turnout 51,077 76.8 -5.0 Conservative hold Swing Elections in the 1970s
General Election 1979: Cheadle Party Candidate Votes % ±% Conservative Tom Normanton 32,407 58.8 +9.6 Liberal David Austick 15,268 27.7 -7.8 Labour Frances Done 7,415 13.5 -1.8 Majority 17,139 31.1 Turnout 55,090 81.8 +1.6 Conservative hold Swing General Election October 1974: Cheadle Party Candidate Votes % ±% Conservative Tom Normanton 25,863 49.2 -0.5 Liberal Christopher Green 18,687 35.5 -3.0 Labour Paul Castle 8,048 15.3 +3.4 Majority 7,176 13.7 Turnout 52,598 80.2 Conservative hold Swing After the 1970 general election boundary changes created the Hazel Grove constituency which reduced the size of the Cheadle one. The previous Member of Parliament for Cheadle, Dr. Michael Winstanley became the first member returned by Hazel Grove.
General Election February 1974: Cheadle Party Candidate Votes % ±% Conservative Tom Normanton 27,556 49.7 Liberal Christopher Green 21,332 38.5 +2.3 (est.) Labour Paul Castle 6,584 11.9 Majority 6,224 11.2 Turnout 85.4 Conservative hold Swing General Election 1970: Cheadle Party Candidate Votes % ±% Conservative Tom Normanton 39,728 46.3 +4.8 Liberal Michael Winstanley 37,974 44.2 +1.8 Labour Roger Stott 8,062 9.4 -6.8 Majority 1,754 2.0 Turnout 79.9 Conservative gain from Liberal Swing Elections in the 1960s
General Election 1966: Cheadle Party Candidate Votes % ±% Liberal Michael Winstanley 32,071 42.4 +7.8 Conservative William Shepherd 31,416 41.5 -5.3 Labour Sholto Moxley 12,244 16.2 -2.2 Majority 655 0.9 Turnout 82.4 Liberal gain from Conservative Swing General Election 1964: Cheadle Party Candidate Votes % ±% Conservative William Shepherd 33,911 46.8 -8.2 Liberal Roger Cuss 25,220 34.8 +8.8 Labour Sholto Moxley 13,379 18.4 -0.6 Majority 8,691 12.0 Turnout 83.6 Conservative hold Swing Elections in the 1950s
General Election 1959: Cheadle Party Candidate Votes % ±% Conservative William Shepherd 32,787 55.0 -7.3 Liberal Roger Cuss 15,469 26.0 +10.4 Labour Charles Morris 11,373 19.0 -3.1 Majority 17,318 29.0 Turnout 83.7 Conservative hold Swing General Election 1955: Cheadle Party Candidate Votes % ±% Conservative William Shepherd 30,940 62.3 -0.3 Labour Harry Stone 10,966 22.1 -2.9 Liberal Ronald Palmer 7,756 15.6 +3.2 Majority 19,974 40.2 Turnout 80.6 Conservative hold Swing General Election 1951: Cheadle Party Candidate Votes % ±% Conservative William Shepherd 32,369 62.6 +4.4 Labour Rev. Hatton Jones 12,910 25.0 -0.3 Liberal George Samways 6,388 12.4 -4.2 Majority 19,459 37.6 Turnout 85.7 Conservative hold Swing General Election 1950: Cheadle Party Candidate Votes % ±% Conservative William Shepherd 30,740 58.2 Labour Rev. Hatton Jones 13,389 25.3 Liberal George Samways 8,801 16.6 Majority 17,351 32.8 Turnout 88.9 See also
- List of Parliamentary constituencies in Greater Manchester
Notes and references
- ^ "Electorate Figures - Boundary Commission for England". 2011 Electorate Figures. Boundary Commission for England. 4 March 2011. http://www.boundarycommissionforengland.org.uk/electoral-figures/electoral-figures.htm. Retrieved 13 March 2011.
- ^ Leigh Rayment's Historical List of MPs – Constituencies beginning with "C" (part 3)
- ^ "UK General Election results April 1992". Richard Kimber's Political Science Resources. Politics Resources. 9 April 1992. http://www.politicsresources.net/area/uk/ge92/i05.htm. Retrieved 2010-12-06.
Sources
- Election result, 2005
- Election results, 1997 - 2001
- Election results, 1983 - 1992
- Election results, 1959 - 2001
- F.W.S. Craig. British Parliamentary Election Results 1950-1973. ISBN 0-900178-07-8
Categories:- Parliamentary constituencies in Greater Manchester
- United Kingdom Parliamentary constituencies established in 1950
- Politics of Stockport


Wikimedia Foundation. 2010.