- Magnetic circular dichroism
-
Magnetic circular dichroism (MCD) is the differential absorption of left and right circularly polarized (LCP and RCP) light, induced in a sample by a strong magnetic field oriented parallel to the direction of light propagation. MCD measurements can detect transitions which are too weak to be seen in conventional optical absorption spectra; they can also probe paramagnetic properties and the symmetry of the electronic levels of the studied systems, such as metal ion sites. [1]
Contents
History
It was first shown by Faraday that optical activity could be induced in matter by a longitudinal magnetic field (a field in the direction of light propagation).[2] The development of MCD really began in the 1930s when a quantum mechanical theory of MOR (magnetic optical rotatory dispersion) in regions outside absorption bands was formulated. The expansion of the theory to include MCD and MOR effects in the region of absorptions, which were referred to as “anomalous dispersions” was developed soon thereafter. There was, however, little effort made to refine MCD as a modern spectroscopic technique until the early 1960s. Since that time there have been numerous studies of MCD spectra for a very large variety of samples, including stable molecules in solutions, in isotropic solids, and in the gas phase, as well as unstable molecules entrapped in noble gas matrices. More recently, MCD has found useful application in the study of biologically important systems including metalloenzymes and proteins containing metal centers.[3][4]
Differences between CD and MCD
In natural optical activity, the difference between the LCP light and the RCP light is caused by the asymmetry of the molecules. Because of the handedness of the molecule, the absorption of the LCP light would be different from the RCP light. However, in MCD in the presence of a magnetic field, LCP and RCP no longer interact equivalently with the absorbing medium. Thus there is not the same direct relation between magnetic optical activity and molecular stereochemistry which would be expected, because it is found in natural optical activity. So, natural CD is much more rare than MCD.[5]
Although there is much overlap in the requirements and use of instruments, ordinary CD instruments are usually optimized for operation in the ultraviolet, approximately 170–300 nm, while MCD instruments are typically required to operate in the visible to near infrared, approximately 300–2000 nm. The physical processes that lead to MCD are substantively different from those of CD. However, like CD, it is dependent on the differential absorption of left and right hand circularly polarized light. MCD will only exist at a given wavelength if the studied sample has an optical absorption at that wavelength.[1] This is distinctly different from the related phenomenon of optical rotatory dispersion (ORD), which can be observed at wavelengths far from any absorption band.
Measurement
The MCD signal ΔA is derived via the absorption of the LCP and RCP light as
This signal is often presented as a function of wavelength λ, temperature T or magnetic field H.[1] MCD spectrometers can simultaneously measure absorbance and ΔA along the same light path.[6] This eliminates error introduced through multiple measurements or different instruments that previously occurred before this advent. An MCD spectrometer begins with a light source that emits a monochromatic wave of light. This wave is passed through a Rochon prism linear polarizer, which separates the incident wave into two beams that are linearly polarized by 90 degrees. The two beams split into different paths- one beam (the extraordinary beam) traveling directly to a photomultiplier (PMT), and the other beam (the ordinary beam) passing through a photoelastic modulator (PEM). The PMT for the extraordinary beam detects the light intensity of the input beam, while the PEM causes a 1/4 wavelength shift that converts linearly polarized light into circularly polarized light. Linearly polarized light has two circular components with intensity represented as I0 = 1/2(I– + I+)
The PEM will delay one component of linearly polarized light with a time dependence that advances the other component by 1/4 λ (hence, quarter-wave shift). The departing circularly polarized light oscillates between RCP and LCP in a sinusoidal time-dependence as depicted below:

The light finally travels through a magnet containing the sample, and the transmittance is recorded by another PMT. The schematic is given below:

The intensity of light from the ordinary wave that reaches the PMT is governed by the equation:

Here A– and A+ are the absorbances of LCP or RCP, respectively; ω is the modulator frequency – usually a high acoustic frequency such as 50 kHz; t is time; and δ0 is the time-dependent wavelength shift.
This intensity of light passing through the sample is converted into a two component voltage via a current/voltage amplifier. A DC voltage will emerge corresponding to the intensity of light passed through the sample. If there is a ΔA, then a small AC voltage with be present that corresponds to the modulation frequency, ω. From such voltage, ΔA and A can be derived using the following relations:


where Vex is the (DC) voltage measured by the PMT from the extraordinary wave, and Vdc is the DC component of the voltage measured by the PMT for the ordinary wave (measurement path not shown in the diagram).
Some superconducting magnets have a small sample chamber, far too small to contain the entire optical system. Instead, the magnet sample chamber has windows on two opposite sides. Light from the source enters one side, interacts with the sample (usually also temperature controlled) in the magnetic field, and exits through the opposite window to the detector. Optical relay systems that allow the source and detector each to be about a meter from the sample are typically employed. This arrangement avoids many of the difficulties that would be encountered if the optical apparatus had to operate in the high magnetic field, and also allows for a much less expensive magnet.
Applications
MCD can be used as an optical technique for the detection of electronic structure of both the ground states and excited states. It is also a strong addition to the more commonly used absorption spectroscopy, and there are two reasons that explain this. First, a transition buried under a stronger transition can appear in MCD if the first derivative of the absorption is much larger for the weaker transition or it is of the opposite sign. Second, MCD will be found where no absorption is detected at all if ΔA > (ΔAmin) but A<Amin, where (ΔA)min and Amin are the minimum of ΔA and A that are detectable. Typically, (ΔAmin) and Amin are of the magnitudes around 10−5 and 10−3 respectively. So, a transition can only be detected in MCD, not in the absorption spectroscopy, if ΔA/A > 10−2. This happens in paramagnetic systems that are at lower temperature or that have sharp lines in the spectroscopy.[7]
In biology, metalloproteins are the most likely candidates for MCD measurements, as the presence of metals with degenerate energy levels leads to strong MCD signals. In the case of ferric heme proteins,[8] MCD is capable of determining both oxidation and spin state to a remarkably exquisite degree. In regular proteins, MCD is capable of stoichiometrically measuring the tryptophan content of proteins, assuming there are no other competing absorbers in the spectroscopic system. In addition,the application of MCD spectroscopy greatly improved the level of understanding in the ferrous non-heme systems because of the direct observation of the d–d transitions, which generally can not be obtained in optical absorption spectroscopy owing to the weak extinction coefficients and are often electron paramagnetic resonance silent due to relatively large ground-state sublevel splittings and fast relaxation times.[9]
Theory
Consider a system are of localized, non-interacting absorbing centers. Based on the semi-classical radiation absorption theory within the electric dipole approximation, the electric vector of the circularly polarized waves propagates in the +z direction, where + and -denote to RCP light and LCP light respectively. In this system, ω = 2nν is the circular frequency, and Ii = n – ik is the complex refractive index. As the light travels, the attenuation of the beam is expressed as
- I(z) = I0exp(−2ωkz/c)
where k is the absorption coefficient of the medium in the z direction. Circular dichroism (CD) is then defined as Δk = k– – k+, and it follows the sign convention of natural optical activity. In the presence of the static, uniform external magnetic field, the Hamiltonian for the absorbing center takes the form Ĥ = Ĥ0 + Ĥ1 which is parallel to the direction of the propagation of the electric field k.[2] Because the transition occur between the two eigenstates of Ĥ0, a and j, the absorption and the CD intensity are determined as follows:

Discrete line spectrum
In a certain frequency range, if the transitions of the absorbing centers are relatively sparse, the absorption spectrum in this region would be of a series of lines. Each line would correspond to a single transition and be either completely or partially resolved from neighboring lines. Since it is of the discrete form, then the absorption coefficient and CD of the line are given by

When the Zeeman effect is small compared to zero-field state separations, line width, and kT and when the line shape is independent of H, it could be obtain to first order in H for the expression of Δk, assuming j to be sufficiently high in energy that Nj = 0, and it is given by:

Here Δk is the field-dependent difference between LCP and RCP absorption, α is the electric permeability, n is the index of refraction, H is the applied magnetic field, k is the Boltzmann constant and T is the temperature. Further, f is a band shape function and f' is the correspondent first derivative. D is the dipole strength parameter defined as[7]

There are various form of the formulas above. A more common form is in terms of A (absorption), which would be:

The terms A, B, and C are characteristic parameters specific to a given molecule and to a particular transition.[7]

A term arises due to Zeeman splitting of the ground or excited degenerate states, like what is shown in the (2) in figure 1 The small Zeeman splitting would make the oppositely signed transitions RCP light and LCP light almost cancel out with each other, which leads to the derivative shape of the band. B term is due to the field-induced mixing of states. As shown in (3) of the figure 1, in order for there to be an appearance of B term, there must be another state K, which is closely related in energy to either the ground state or the excited states. Also, the energy between the ground state and the excited state should be high enough so that the excited state is not highly populated. Usually, B term would have the absorption band shape. Otherwise, it will lead to the C term (4) of figure 1, which requires the degeneracy of the ground state. This happens due to a change in the population of molecules over the Zeeman sublevels of a paramagnetic ground state. In addition, the C term is observed only for molecules with ground state paramagnetism. Importantly, A and B terms are independent of temperature while the C term is dependent on temperature.[10] Decrease of the temperature and increase of the magnetic field would further increase the C term intensity until it reaches the maximum(saturation limit). Experimentally, the C term spectrum can be obtained from MCD raw data by subtraction of MCD spectra measured in the same applied magnetic field at different temperatures, while A and B terms can be distinguished via their different band shapes.[9] The relative contributions of A, B and C terms to the MCD spectrum are proportional to the inverse line width, energy splitting, and temperature:
where ΔΓ is line width and ΔE is zero-field state separation. For typical values of ΔГ = 1000 cm−1, ΔE = 10,000 cm−1 and kT = 6 cm−1 (at 10 K), the three terms make relative contributions 1:0.1:150. So, at low temperature the C term dominates over A and B.[11]
Example on C terms

In the visible and near-ultraviolet regions, the hexacyanoferrate(III) ion (Fe(CN)63−) exhibits three strong absorptions at 24500, 32700, and 40500 cm−1, which have been ascribed to ligand to metal charge transfer (LMCT) transitions. They all have lower energy than the lowest-energy intense band for the Fe(II) complex Fe(CN)62- found at 46000 cm−1.[12] The red shift with increasing oxidation state of the metal is characteristic of LMCT bands.
These features can be explained as follows. The ground state of the anion is 2T2g, which derives from the electronic configuration (t2g)5. So, there would be an unpaired electron in the d orbital of Fe3+ From that, the three bands can be assigned to the transitions 2t2g→2t1u1, 2t2g →2t1u2, 2t2g →2t2u. Two of the excited states are of the same symmetry, and, based on the group theory, they could mix with each other so that there are no pure σ and π characters in the two t1u states, but for t2u, there would be no intermixing. The A terms are also possible from the degenerate excited states, but the studies of temperature dependence showed that the A terms are not as dependent as the C term.[13]
An MCD study of Fe(CN)63- embedded in a thin polyvinyl alcohol (PVA) film revealed a temperature dependence of the C term. The room-temperature C0/D0 values for the three bands in the Fe(CN)63- spectrum are 1.2, −0.6, and 0.6, respectively, and their signs (positive, negative, and positive) establish the energy ordering as 2t2g→2t1u2<2t2g→2t2u<2t2g→2t1u1
Example on A and B terms
To have an A- and B-term in the MCD spectrum, a molecule must contain degenerate excited states (A-term) and excited states close enough in energy to allow mixing (B-term). One case exemplifying these conditions is a square planar, d8 complex such as [(n-C4H9)4N]2Pt(CN)4. In addition to containing A- and B-terms, this example demonstrates the effects of spin-orbit coupling in metal to ligand charge transfer (MLCT) transitions. As shown in figure 1, the molecular orbital diagram of [(n-C4H9)4N]2Pt(CN)4 reveals MLCT into the antibonding π* orbitals of cyanide. The ground state is diamagnetic (thereby eliminating any C-terms) and the LUMO is the a2u. The dipole-allowed MLCT transitions are a1g-a2u and eg-a2u. Another transition, b2u-a2u, is a weak (orbitally forbidden singlet) but can still be observed in MCD.[14]
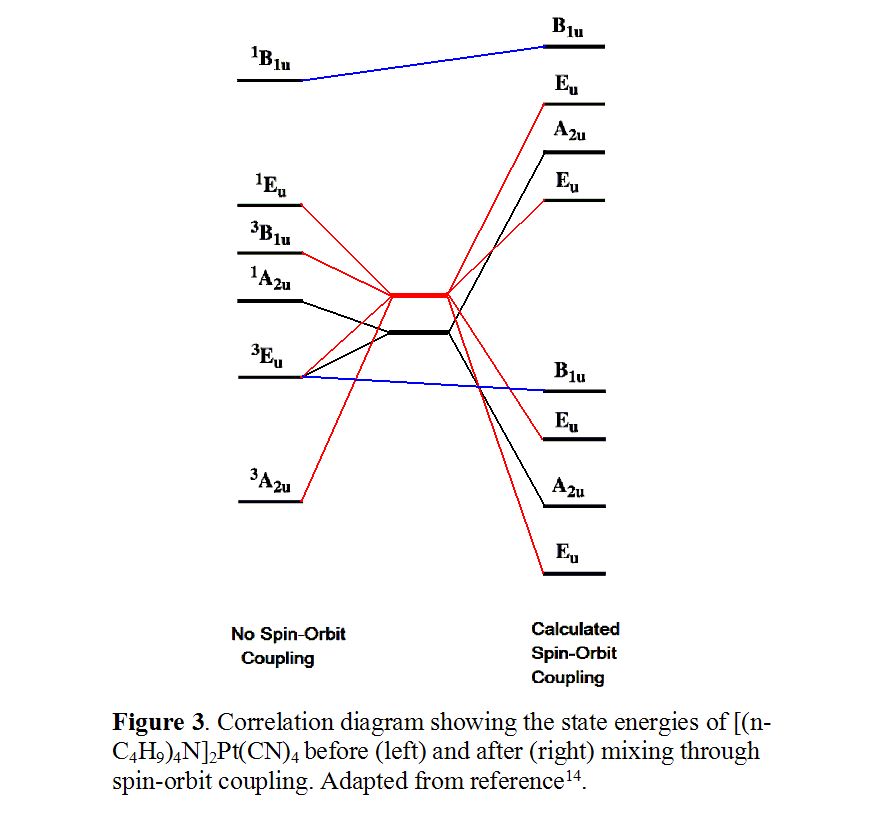
Because A- and B-terms arise from the properties of states, all singlet and triplet excited states are given in figure 2.

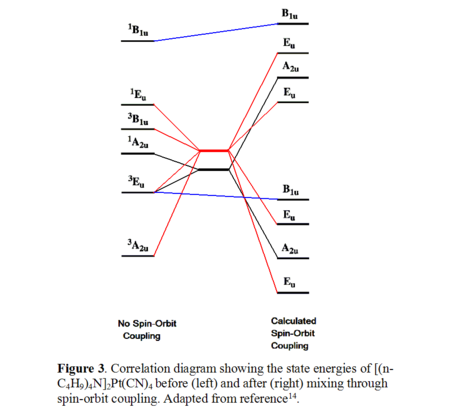
Mixing of all these singlet and triplet states will occur and is attributed to the spin orbit coupling of platinum 5d orbitals (ζ ~ 3500 cm−1), as shown in figure 3. The black lines on the figure indicate the mixing of 1A2u with 3Eu to give two A2u states. The red lines show the 1Eu, 3Eu, 3A2u, and 3B1u states mixing to give four Eu states. The blue lines indicate remnant orbitals after spin-orbit coupling that are not a result of mixing.
See also
References
- ^ a b c IUPAC, Compendium of Chemical Terminology, 2nd ed. (the "Gold Book") (1997). Online corrected version: (2006–) "magnetic circular dichroism".
- ^ a b A. D. Buckingham and P. J. Stephens (1966). Ann. Rev. Phys. Chem 17: 399.
- ^ W. Roy Mason (2007). A practical guide to magnetic circular dichroism spectroscopy. Wiley-Interscience. doi:10.1002/9780470139233. ISBN 9780470069783. http://books.google.com/books?id=AhU8bwAACAAJ. Retrieved 16 April 2011.
- ^ P. N. Schatz, A. J. McCafferyd (1969). "The Faraday effect". Quarterly Reviews, Chemical Society 23 (4): 552. doi:10.1039/QR9692300552.
- ^ Dennis Caldwell; Thorne, J M; Eyring, H (1971). "Magnetic Circular Dichroism". Annu. Rev. Phys. Chem. 22: 259–278. Bibcode 1971ARPC...22..259C. doi:10.1146/annurev.pc.22.100171.001355.
- ^ G. A. Osborne (1973). "A Near-Infrared Circular Dichroism and Magnetic Circular Dichroism Instrument". The Review of Scientific Instruments 44: 10. Bibcode 1973RScI...44...10O. doi:10.1063/1.1685944.
- ^ a b c Stephens, P. J. (1974). "Magnetic Circular Dichroism". Annu. Rev. Phys. Chem. 25: 201. Bibcode 1974ARPC...25..201S. doi:10.1146/annurev.pc.25.100174.001221.
- ^ G. Zoppellaro et al. (2009). "Review: Studies of ferric heme proteins with highly anisotropic/highly axial low spin (S = 1/2) electron paramagnetic resonance signals with bis-Histidine and histidine-methionine axial iron coordination". Biopolymers 91 (12): 1064. doi:10.1002/bip.21267. PMID 19536822.
- ^ a b E.I. Solomon et al. (1995). "Magnetic circular dichroism spectroscopy as a probe of the geometric and electronic structure of non-heme ferrous enzymes". Coordination Chemistry Reviews 144: 369–460. doi:10.1016/0010-8545(95)01150-N.
- ^ Lehnert, N.; DeBeer George, S.; Solomon, E. I. (2001). "Recent advances in bioinorganic spectroscopy". Curr. Opin. Chem. Biol 5 (2): 176–187. doi:10.1016/S1367-5931(00)00188-5. PMID 11282345.
- ^ Neese, F.; Solomon, E. I. (1999). "MCD C-Term Signs, Saturation Behavior, and Determination of Band Polarizations in Randomly Oriented Systems with Spin S >/= (1)/(2). Applications to S = (1)/(2) and S = (5)/(2)". Inorg. Chem. 38 (8): 1847–1865. doi:10.1021/ic981264d. PMID 11670957.
- ^ Stephens, P. J. (1965). "The Faraday Rotation of Allowed Transitions: Charge-Transfer Transitions in K3Fe(CN)6". Inorg. Chem. 4 (12): 1690–1692. doi:10.1021/ic50034a003.
- ^ Upton, A. H. P.; Williamson, B. E. (1994). "Magnetic circular dichroism and absorption spectra of hexacyanoferrate(III) in a poly(vinyl alcohol) film". J. Phys. Chem. 98: 71. doi:10.1021/j100052a013.
- ^ Isci, H.; Mason, W. R. (1975). "Electronic structure and spectra of square-planar cyano and cyanoamine complexes of platinum(II)". Inorg. Chem. 14 (4): 905. doi:10.1021/ic50146a038.
Categories:


Wikimedia Foundation. 2010.