- 1997–98 South Pacific cyclone season
-
1997–98 South Pacific cyclone season 
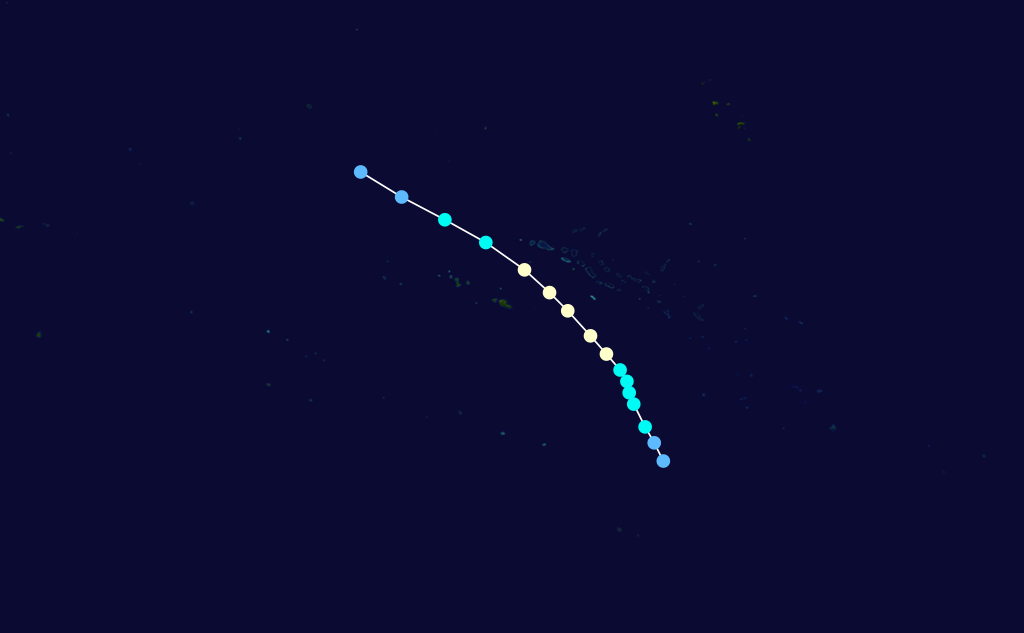
Season summary mapFirst storm formed: October 8, 1997 Last storm dissipated: May 3, 1998 Strongest storm: Ron and Susan – 900 hPa (mbar), 230 km/h (145 mph) (10-minute sustained) Total depressions: 21 Tropical cyclones: 16 Severe tropical cyclones: 7 Total fatalities: 40 direct, 1 indirect Total damage: > $7.6 million (1998 USD) South Pacific cyclone seasons
1995–96, 1996–97, 1997–98, 1998–99, 1999–00Related articles: The 1997–98 South Pacific cyclone season was one of the most active and the longest tropical cyclone seasons on record, with 16 tropical cyclones occurring within the South Pacific Ocean basin between 160°E and 120°W. The season started earlier than normal with 3 tropical depressions recorded before the official start of the season on November 1, 1997 while the final depression of the season dissipated on May 3, 1998. There was a tie for the strongest tropical cyclone of the season as both Cyclones Ron and Susan had a minimum pressure of 900 hPa (26.58 inHg), and were the most intense tropical cyclones on record in the South Pacific Ocean until Cyclone Zoe in 2002–03. After the season ended, 10 names had their names either removed or retired from the lists of names, after they caused significant impacts to South Pacific islands.
During the season, tropical cyclones were officially monitored by the Regional Specialized Meteorological Center (RSMC) in Nadi, Fiji and the Tropical Cyclone Warning Centers in Brisbane, Australia and Wellington, New Zealand. The United States Navy through its Joint Typhoon Warning Center (JTWC) and Naval Pacific Meteorology and Oceanography Center (NPMOC), also monitored the basin and issued unofficial warnings for American interests. During the season RSMC Nadi issued warnings and assigned names to any tropical cyclones that developed between the Equator and 25°S while TCWC Wellington issued warnings for any that were located to the south of 25°S. The JTWC issued warnings for American interests on any significant tropical cyclone that was located between 160°E and the 180° while the NPMOC issued warnings for tropical cyclones forming between 180° and the American coast. RSMC Nadi and TCWC Wellington measure sustained windspeeds over a 10-minute and used the Australian tropical cyclone intensity scale, while the JTWC and the NPMOC measured sustained windspeeds over a 1-minute period and are compared to the Saffir-Simpson Hurricane Scale (SSHS).
Seasonal predictions
Tropical cyclones in the South Pacific Record Season TC STC Average activity (1969–70 – 1996–97) 7–8 4 [1] Record high activity 1982-83 14 9 Record low activity 1994–95 3 1 Activity during this season 16 7 In October 1997, ahead of the season starting on November 1, the Cook Islands Meteorological Office and the National Disasters Committee, warned that the Cook Islands should expect its worst cyclone season in years.[2] On November 27, New Zealand's National Institute of Water and Atmospheric Research, issued a press release, which predicted that because of the strong El Niño phenomenon, there would be more tropical cyclones than average.[3] In particular they predicted that due to the strong El Niño, countries within the western part of the basin were likely to see fewer tropical cyclones during the season than countries within the eastern part of the basin.[3] The Southern Cook islands, Tonga, Tuvalu and French Polynesia, were predicted to have an increased risk, while Fiji was forecast to have an average risk of being affected by a tropical cyclone.[3] NIWA also reported that Cyclone Martin's impact on the Northern Cook Islands was an early sign of what could be expected during the season, because the system had occurred further east than normal.[3]
Seasonal summary

After one of the latest ends to a season on record during 1996–97, the 1997–98 season started early with the formation of Tropical Cyclone Lusi on October 8, about 3 weeks before the season officially started on November 1. Lusi took a so called gentleman's track between Fiji and Vanuatu and had no impact on either country, before dissipating on October 13. Severe Tropical Cyclone Martin then developed
Storms
Tropical Cyclone Lusi
Category 2 tropical cyclone (Australian scale) Tropical storm (SSHS) 

Duration October 8 – October 12 Intensity 100 km/h (65 mph) (10-min), 980 mbar (hPa) On October 4, the JTWC started to monitor an area of disturbed weather, that was located about 500 km (310 mi) to the southeast of Yaren in Nauru.[4] The system initially moved towards the southeast before during October 5, the disturbance recurved and started to move towards the southwest.[4] Over the next few days the disturbance gradually developed further, before at 0000 UTC on October 8, RSMC Nadi reported that the system had developed into a tropical depression while the JTWC issued a tropical cyclone formation alert five hours later.[4][5][6] During that day the developing depression consolidated further before at 2100 UTC, the JTWC initiated advisories on the depression and designated it as Tropical Cyclone 02P.[6] At 1200 UTC on October 9, RSMC Nadi named the depression, Lusi as the system had intensified into the earliest tropical cyclone since 1970 while located about 1020 km (635 mi) to the northwest of Port Villa, Vanuatu.[5][7][8] Over the next few days, Lusi moved towards the south-southeast taking a so-called "gentleman's track" between Vanuatu and Fiji.[9] On October 11 RSMC Nadi reported that Lusi had reached its peak 10-minute sustained windspeeds of 100 km/h (65 mph), while the JTWC also reported that Lusi had peaked with 1-minute sustained windspeeds of 110 km/h (70 mph).[4][7] After it had peaked in intensity, Lusi started to weaken in an area of cooler sea surface temperatures and increasing vertical wind shear, before both RSMC Nadi and the JTWC reported early on October 12 that Lusi had weakened into an extratropical cyclone.[5][10] The extratropical remnants of Lusi were tracked for another day by RSMC Nadi and the JTWC before they dissipated to the northeast of New Zealand.[4][11] There was no impact caused by Lusi on any island, though heavy rainfall and gale force windspeeds were reported on several Fijian Islands including Rotuma.[9][12]
Tropical Depression 03P
Tropical depression (Australian scale) Tropical storm (SSHS) 

Duration October 26 – October 28 Intensity 65 km/h (40 mph) (1-min), 997 mbar (hPa) On October 24, the United States Navy started to monitor an area of disturbed weather, that was located about 800 km (500 mi) to the north of Nadi, Fiji.[13] Over the next couple of days the system moved towards the southwest before early on October 26, as convection surrounding the system organized further, RSMC Nadi reported that the system had developed into a tropical depression before the JTWC issued a Tropical Cyclone Formation Alert on it.[5][14] Later that day the JTWC initiated advisories on the depression designating it as Tropical Cyclone 03P, while it was at its peak 1-minute sustained windspeeds of 65 km/h (40 mph).[14] Over the next couple of days, a trough of low pressure approached the system, and caused the depression to re-curve towards the southeast before on October 28, the JTWC and RSMC Nadi issued their final bulletins on the system as it dissipated to the northwest of Fiji.
Severe Tropical Cyclone Martin
Category 3 severe tropical cyclone (Australian scale) Category 3 tropical cyclone (SSHS) 

Duration October 31 – November 5 Intensity 155 km/h (100 mph) (10-min), 945 mbar (hPa) On October 27, RSMC Nadi reported that a tropical disturbance had developed about 1500 km (930 mi) to the northeast of Pago-Pago in American Samoa. Over the next few days, convection surrounding the system remained disorganized as the disturbance was determinately affected by strong upper level winds and a moderate to high amount of vertical windshear. During October 30, the disturbance started to organize slightly before at 1800 UTC the NPMOC initiated advisories on the disturbance and designated it as Tropical Cyclone 04P, with winds equivalent to a weak tropical depression. RSMC Nadi then reported at 0000 UTC that 04P had developed into a tropical depression and was rapidly developing further.
Tropical Cyclone Nute
Category 2 tropical cyclone (Australian scale) Category 1 tropical cyclone (SSHS) 

Duration November 18 – November 19 Intensity 110 km/h (70 mph) (10-min), 975 mbar (hPa) On November 15, the United States Navy started to monitor an area of disturbed weather about 1000 km (620 mi), to the northeast of Suva, Fiji.[15] Over the next few days the system moved towards the west, before it came under the influence of the subtropical ridge of high pressure.[15] At 0000 UTC on November 18, RSMC Nadi reported that the system had become a tropical depression, before the JTWC issued a tropical cyclone formation alert on the depression while it was located about 100 km (60 mi), to the southwest of the Solomon Island: Santa Cruz.[16][17] The JTWC initiated advisories on the depression at 0600 UTC and designated it as 05P, before six hours later, RSMC Nadi named the depression Nute, as it had intensified into a category one tropical cyclone.[9][17] Over the next day, Nute continued to intensify and developed an eye feature before at 0600UTC on November 19, as the system approached 160°E, RSMC Nadi reported that Nute, had peaked as a category two tropical cyclone with 10-minute sustained windspeeds of 110 km/h (70 mph).[9][16] Later that day, the JTWC reported that Nute had reached a 1-minute peak intensity of 140 km/h (85 mph), before RSMC Nadi passed the primary warning responsibility to TCWC Brisbane, as Nute had moved into the Australian region.[9][15] As Nute did not affect any islands while it was in the South Pacific there was no impact reported.[16]
Severe Tropical Cyclone Osea
Category 3 severe tropical cyclone (Australian scale) Category 2 tropical cyclone (SSHS) 

Duration November 24 – November 28 Intensity 150 km/h (90 mph) (10-min), 950 mbar (hPa) A new tropical depression formed on November 22 at 0000 UTC, northeast of Manihiki Atoll.[18] Tropical Depression 06P stayed weak for the next few days as the NPMOC did not start issuing warnings on this depression until the afternoon of November 23. TD-06P moved on a southeasterly course and was christened the name Osea by the Tropical Cyclone Warning Center in Fiji on November 24.[18] Osea began to intensify and reached hurricane intensity the next day. Osea’s winds peaked at 80 mph (135 km/h) in 10-min winds (105 mph in 1-min winds). Afterwards, Osea began to weaken and passed close Tahiti on November 28 with winds of only 40 mph (60 km/h). The last advisory was released on November 28 at 600 UTC.[18] Peak intensity was 950 millibars.
The damage in French Polynesia was catastrophic.[18] Over 700 buildings were destroyed in Bora-Bora, Raiatea and Maupiti. On Manupiti, about 95 percent of the island was destroyed, including the town hall, two schools, and an airfield. On Bora-Bora, only about 30 percent of the infrastructure was destroyed. No fatalities were reported however.[18]
Tropical Cyclone Pam
Category 2 tropical cyclone (Australian scale) Category 1 tropical cyclone (SSHS) 

Duration December 6 – December 10 Intensity 110 km/h (70 mph) (10-min), 975 mbar (hPa) The first bulletin was issued for a developing depression, Tropical Depression 07P, on December 5.[19] Pam caused little damage on the island. TD-07P was located near American Samoa and southeast of the newly formed Tropical Storm Paka in the Central North Pacific. Paka and TD-07P were cyclonic twins, forming from the same equatorial wind burst.[19] The system developed slowly while it drifted to the south-southeast. By 1800 UTC, TD-07P was west of Manihiki Atoll with winds of 35 mph (55 km/h). Maximum sustained winds reached gale-force on December 6, as Paka and TD-07P were splitting farther and farther apart (Paka, which was reaching the International Date Line). The storm was named Pam and moved close to Suwarrow Atoll on December 6. On December 8, Pam passed due east of Palmerston Island, sustaining winds of 65 mph (105 km/h).[19]
Pam passed by Rarotonga early on December 9 as a weakening cyclone.[19] Rarotonga recorded winds of 44 mph (71 km/h) and gusts of 74 mph (119 km/h). Coincidentally, the low pressure of 986 millibars was not recorded until the next day. Instead of dropping in pressure, Pam decreased gradually and then a gradual increase in the next 12 hours. This occurrence may have shown that Pam was becoming extratropical. The weakening cyclone passed southeast of Mangaia around 1200 UTC December 9. The island recorded winds of 30 mph (50 km/h) and a minimal pressure of 996 millibars. Pam weakened gradually, losing tropical characteristics. The RSMC in Nadi downgraded Pam into a tropical storm on December 10.[19]
Damage on Rarotonga was light, being limited from down power lines to fallen trees.[19] A few houses lost their roofs and low-lying roads sustained flooding. 149 millimeters of rain fell on Rarotonga during a six-hour period. No fatalities were reported in accordance with Tropical Cyclone Pam.[19]
Severe Tropical Cyclone Susan
Category 5 severe tropical cyclone (Australian scale) Category 5 tropical cyclone (SSHS) 

Duration December 20 – January 9 Intensity 260 km/h (160 mph) (10-min), 900 mbar (hPa) On December 20, the USN and RSMC Nadi, started to monitor a weak tropical disturbance that was located about 915 km (570 mi), to the north-northwest of Pago-Pago in American Samoa. Over the next 12 days the system remained weak while gradually moving towards the southwest, before on January 2 the disturbance started to develop further. At 0000 UTC on January 3, the USN's JTWC designated the disturbance 11P and initiated advisories on the system while it had 1-minute wind speeds of 65 km/h (40 mph), which are equivalent to a tropical storm. Six hours later at 0600 UTC, RSMC Nadi reported that the disturbance had intensified into a category one tropical cyclone on the Australian tropical cyclone intensity scale and named it Susan. However in its post storm analysis RSMC Nadi reported that they should off named it, 18 hours earlier at 1200 UTC, January 2. By 0600 UTC on January 3, the cyclone was located about 765 km (475 mi) to the northeast of Port Villa on the Vanuatuan island of Efate. During that day Susan rapidly intensified further in an area of low vertical wind shear, while moving towards the west. As a result of the intensification RSMC Nadi reported at 0000 UTC the next day, that Susan had become a category 3 severe tropical cyclone, while the JTWC reported that the cyclone had become equivalent to a category 1 hurricane on the Saffir-Simpson Hurricane Scale. Throughout January 4, Susan continued to rapidly intensify while moving towards the west-southwest towards Vanuatu, before at 0000 UTC on January 5, RSMC Nadi reported that the system had become a category 5 severe tropical cyclone, with 10-minute sustained wind speeds of 120 knots. The JTWC also reported at this time that Susan had become equivalent to a Super Typhoon with 1-minute wind speeds of 130 knots. Six hours later RSMC Nadi reported that Susan had reached its peak 10-minute peak sustained wind speeds of 145 mph (225 km/h). The JTWC also reported at this time that the system had peaked but with 1-minute wind speeds of 260 km/h (160 mph) which is equivalent to a weak category 5 hurricane on the SSHS. As it reached its peak intensity, Susan was still moving towards the southwest and as a result, it "posed a severe threat to Vanuatu," however during that afternoon, Susan recurved towards the southeast "just in time to spare Vanuatu, a direct hit.” After turning away from Vanuatu, Susan accelerated towards the southeast while remaining near or at its peak intensities, before starting to weaken significantly during January 7. RSMC Nadi then reported early the nest day, that Susan had weakened into a category 4 severe tropical cyclone while it was located about 435 km (270 mi), to the southeast of Nadi, Fiji. Later that day, as Susan interacted with Ron RSMC Nadi passed the primary warning responsibility for Susan to TCWC Wellington, while the NPMOC took over the responsibility for issuing warnings for American interests from the JTWC. By 0000 UTC on January 9, Susan had completely absorbed Ron, before at 0600 UTC TCWC Wellington and the NPMOC reported that the Susan had become extratropical. Susans remnants were monitored by TCWC Wellington for another day until they were last noted at 1200 UTC about 2500 km to the southeast of Wellington, New Zealand.
Total damage from Susan was minor.[20] High seas in accordance with Susan inundated the village of Talaulia on Kadavu, Fiji. There was also some destroyed waterfront buildings, roads, jetties and bridges on Kadavu. In Beqa Island, only high seas and swells were experienced. In the town of Lautoka, on Viti Levu, roofs were blown off shops. This damage was possibly caused by a tornado that formed from one of the outer rain bands. One death was reported in accordance with Susan. This death was on Ambrym Island in Vanuatu, where a woman was killed by a falling coconut palm tree.[20]
Severe Tropical Cyclone Ron
Category 5 severe tropical cyclone (Australian scale) Category 5 tropical cyclone (SSHS) 

Duration January 1 – January 8 Intensity 230 km/h (145 mph) (10-min), 900 mbar (hPa) The first tropical depression advisory was released on January 1 at 600 UTC to a depression that was to become Tropical Cyclone Ron. Ron drifted slowly for the next four days and reached tropical cyclone intensity on January 2 near Samoa. As a cyclone, Ron passed close to Swains Island on January 3 and intensified gradually after that. Peak 10-minute winds of 145 mph (225 km/h) were reached on January 5 north of Apia, American Samoa. Ron maintained that intensity for about 36 hours and began to move in a south-southeasterly course on January 6. Around 1800 UTC that day, Ron passed near Niuafo'ou, which reported sustained winds of 70 mph (110 km/h). The RSMC Nadi discussion at 1800 UTC noted that Ron may have had a smaller gale radius than had been thought. After passing Niuafo'ou, Ron passed to the south of Samoa and weakened. Ron started to move faster and weakened rapidly, merging with Tropical Cyclone Susan on January 9. Ron's lowest pressure was 900 millibars and 1-minute winds of 165 mph (265 km/h).[20]
Damage on Niuafo'ou was catastrophic. About 67 percent of the buildings on were either damaged or destroyed completely. Agricultural losses included 80–90 percent of the coconut and breadfruit trees were damaged. Crops such as taro, kape, manioc, and bananas were lost. The Tonga Chronicle reported that it would take at least five years to return crops to pre-cyclone stages. Damages and rehabilitation totaled out 1.1 million in Tongan dollars. However, no fatalities were reported on the island. Neighboring islands Niuatoputapu, Tafahi, and Vava'u sustained damage as well, but not as severe as Niuafo'ou. No reports of damage came from Swain's Island and Wallis Island. Ron's peak intensity of 900 millibars was the strongest of the season in the Southern Pacific and the strongest since Tropical Cyclone Hina in March 1985.[20]
Severe Tropical Cyclone Katrina
Category 3 severe tropical cyclone (Australian scale) Category 2 tropical cyclone (SSHS) 

Duration January 7 – January 11 Intensity 150 km/h (90 mph) (10-min), 955 mbar (hPa) Cyclone Katrina was one of the longest-lived South Pacific cyclones on record, lasting 24 days while moving erratically east of Australia. Katrina formed on January 1, 1998 340 nautical miles (630 km) east-northeast of Cairns and 425 nautical miles (787 km) southeast of Port Moresby, Papua New Guinea.[20] Katrina became a tropical storm on January 3 and was moving slowly to the east-northeast. The cyclone was affected by Cyclone Susan which was 1,000 nautical miles (1,900 km) east of Katrina. On January 7, Susan moved further south allowing Katrina to intensify as it neared the Solomon Islands, this proved to be the northernmost point of Katrina's track as the storm turned east-southeast and then southeast, fluctuating in hurricane strength. On January 9, Cyclone Katrina threatened Vanuatu when it stalled about 200 nautical miles (370 km) west-northwest of Port Vila and reversed direction and moved west due a high pressure system. On January 11, Katrina moved south of Rennell Island and then crossed back into the Brisbane area six hours later where it crossed the 160E on its eastward journey, then the storm turned west where it maintained that course until January 15.[20] On the 15th, the storm moved south-southwest where it reached Saffir–Simpson Hurricane Scale Category 2 strength with a barometric pressure of 940 mbar. Katrina weakened rapidly and slowed before making a tight loop on January 17 and January 18.[20] After completing the loop, Cyclone Katrina moved east for 12 hours before moving east-southeast for three days. During that time, Katrina briefly reached Category 1 strength once more before slowing down and being affected by wind shear. By January 24, Katrina had weakened to a tropical depression and on January 25, Katrina dissipated 250 nautical miles (463 km) east of Townsville.[20]
One person drowned off the coast of Vanuatu in rough seas produced by the storm. Throughout the Solomon Islands, 650 homes were destroyed by Katrina, most of which were on the islands of Rennel and Bellona.[21]
Tropical Cyclone Tui
Category 1 tropical cyclone (Australian scale) Tropical storm (SSHS) 

Duration January 25 – January 27 Intensity 75 km/h (45 mph) (10-min), 990 mbar (hPa) On January 25, both RSMC Nadi and the NPMOC reported that Tropical Depression 16P, had developed about 360 km (225 mi) to the northwest of Apia, Samoa.[7][9][22] During that day, as the depression moved towards the southeast it gradually intensified further before at 2100 UTC, RSMC Nadi reported that the depression had intensified into a category one tropical cyclone, and named it as Tui, while it was located about 80 km (50 mi) to the northwest of Apia.[9] After it was named, Tui passed over the Samoan Islands of Upolu and Savai'i, before at 0600 UTC, both RSMC Nadi and the NPMOC reported that Tui had peaked with 10 and 1 minute sustained windspeeds of 75 km/h (45 mph).[7][23] After it had crossed Samoa, the system remained near stationary, just to the south of Samoa, before early on January 27 both the NPMOC and RSMC Nadi, reported that Tui had weakened into a depression and issued their final advisories.[9][20][23] After being downgraded to a depression, the system remained in the vicinity of the Samoan islands, before it possibly redeveloped into Tropical Cyclone Wes.[1][9] Large crop losses and some infrastructure damage was reported in American Samoa and Western Samoa after gale force windspeeds, heavy rain and rough seas brought down, power lines, trees and other debris.[24] On the Western Samoan island of Savai'i, a young boy was killed when he stepped into an electrified puddle of water.[9]
Tropical Cyclone Ursula
Category 2 tropical cyclone (Australian scale) Category 1 tropical cyclone (SSHS) 

Duration January 29 – February 2 Intensity 110 km/h (70 mph) (10-min), 975 mbar (hPa) At 1800 UTC on January 29, RSMC Nadi reported that a depression had developed about 465 km (290 mi), to the northeast of Papeete on the French Polynesian island of Tahiti.[1] During the next day, the depression gradually developed further as it moved towards the southeast before at 1800 UTC RSMC Nadi named the depression Ursula as it had developed into a category one tropical cyclone on the Australian tropical cyclone intensity scale.[7][20] Over the next few days, Ursula gradually intensified and got caught up in the westerly flow, before accelerating towards the southeast and passing through the Tuamotu archipelago.[7] Early on February 1, RSMC Nadi passed the primary warning responsibility for Ursula to TCWC Wellington, as the system reached its peak 10-minute windspeeds of 110 km/h (65 mph), equivalent to a category two tropical cyclone on the Australian scale.[7][25] Around the same time, the NPMOC designated Ursula as Tropical Cyclone 17P and started to issue warnings, while it was at its peak 1-minute windspeeds of 120 km/h (75 mph).[20][26] During that day, the system went through an extratropical transition with the NPMOC issuing their final warning at 1800 UTC, before TCWC Wellington declared Ursula extratropical at 0600 UTC on February 2.[1][25] The extratropical remnants of Ursula, were then tracked by TCWC Wellington until they dissipated on February 5 over the southeastern Pacific Ocean, about 4350 km (2700 mi) to the south of Lima, Peru.[11] In association with Tropical Cyclone Veli, Ursula brought significant waves which caused minor damages to three Tuamotuan islands of Mataiva, Rangiroa, Makatea.[1] Mataiva was the worst hit island with roads and bridges washed away, and 39 homes damaged.[1] On Makatea island five houses were damaged while operations at Rangiroa's airstrip were disrupted after coral and sand washed up onshore.[1]
Tropical Cyclone Veli
Category 2 tropical cyclone (Australian scale) Category 1 tropical cyclone (SSHS) 

Duration February 1 – February 3 Intensity 100 km/h (65 mph) (10-min), 980 mbar (hPa) Two tropical depressions formed on January 31.[27] The first, about 125 nautical miles (232 km) off of Western Samoa, went on to become Tropical Cyclone Wes (see below). The Regional Specialized Meteorological Centre named the second and more eastern depression Veli the next day in Nadi with winds of 40 mph (60 km/h). Veli continued in a more southeasterly direction and reached a peak intensity of 65 mph (105 km/h) on February 2. At 2100 UTC that day, an NPMOC warning stated that a scatterometer reading found winds of 55 mph (89 km/h). Like the storm before this, Ursula, Veli crossed the Tuamotus Islands. However, unlike Ursula, Veli was not caught in the westerlies and shoot off to the southeast. The last warning was released on February 3, when Veli 500 nautical miles (930 km) southeast of Tahiti.
Tropical Cyclone Wes
Category 2 tropical cyclone (Australian scale) Tropical storm (SSHS) 

Duration February 1 – February 4 Intensity 95 km/h (60 mph) (10-min), 985 mbar (hPa) On January 31, RSMC Nadi reported that a tropical depression had developed about
Tropical Depression
Tropical depression (Australian scale) 
Duration February 11 – February 15 Intensity Winds unknown, Unknown Tropical Depression
Tropical depression (Australian scale) Duration February 18 – February 19 Intensity Winds unknown, Unknown This Tropical Depression affected Fiji on February 18–19, and caused severe flooding in Labasa, and other low lying parts of Fiji.[28]
Tropical Depression
Tropical depression (Australian scale) Duration February 28 – March 2 Intensity Winds unknown, Unknown On February 28, RSMC Nadi reported that a tropical depression had developed about 270 nm to the southeast of Honiara in the Solomon Islands. During that day convection surrounding the system organized rapidly and the depression was given a good chance of developing further. Over the next couple of days the depression drifted slowly to the southeast without strengthening significantly before on March 2, RSMC Nadi issued their final advisory on the depression.
Tropical Depression
Tropical depression (Australian scale) Duration February 28 – March 1 Intensity Winds unknown, Unknown On February 28, RSMC Nadi reported that a weak tropical depression had developed about 300 nm to the northwest of Tahiti. During that day the depression did not develop any further and RSMC Nadi issued their final advisory early on March 1. No warnings were issued by the NPMOC on this system.
Severe Tropical Cyclone Yali
Category 3 severe tropical cyclone (Australian scale) Category 2 tropical cyclone (SSHS) 

Duration March 19 – March 25 Intensity 130 km/h (80 mph) (10-min), 965 mbar (hPa) A well-defined low formed in the Southwest Pacific on March 18.[29] Yali drifted west between Vanatu and the Solomon Islands, while strengthening slowly. The RSMC in Nadi named the system Yali on March 19 at 1800 UTC. The first Joint Typhoon Warning Center warning was issued on March 18, placing the low 350 nautical miles (650 km) north-northwest of Port Vila. Until this point, Yali had been moving to the southwest, but by March 20, the cyclone began moving on a southeasterly course, due to a strengthening monsoon flow. For the next 2½ days, Yali moved to the southeast, passing west of the Vanatu Islands. Yali came close enough to affect the isles of Tanna and Aneityum. Yali reached hurricane-force on the afternoon of March 21 and passed 60 nautical miles (110 km) west of Port Vila the next day.[29] Yali's peak intensity of 80 mph (130 km/h) and 965 millibars was reached on March 22 at 600 UTC.[29] At this time, Yali was just south of Port Vila, brushing it with 15 mph (24 km/h) winds and a minimal pressure of 992 millibars. There was a possibility that the low wind reading based on poor exposure of the instrument. By 1800 UTC March 22, Yali reached its most easternmost position at 220 nautical miles (410 km) southeast of Port Vila. The upper ridge to its north intensified, increasing wind shear and limiting convection. Due to this, Yali began to weaken and dropped below hurricane force.[29] At around the same time, a mid-level subtropical ridge began to influence its motion, sending it to the west. As Yali moved to the southwest, the wind field became asymmetric. At 1200 UTC March 23, Yali was just east of Noumea, New Caledonia with winds of 50 mph (80 km/h). The weakening Yali passed just south of New Caledonia on the night of March 23. By March 25, an upper-level low had caught the cyclone and influenced the circulation with cold air.[29]
The Tropical Cyclone Warning Centre in Fiji downgraded Yali into an extratropical system and stopped issuing advisories.[29] The Joint Typhoon Warning Center continued to track Yali in the general direction of Australia. The now semi-tropical Yali moved to the west and crossed 160°E on March 25. By the next day, Yali's center was 300 nautical miles (560 km) east-northeast of Brisbane, Australia. Some convection was re-developing just south of the center with gales possibly affecting the Australian coast on March 27. On the morning of March 27, the JTWC released its final bulletin on Yali, 325 nautical miles (602 km) east-southeast of Brisbane. The remnants of Yali went under a transformation in the Tasman Sea. The remnants came under a double jet structure and strong cyclone voritcity advection at 500 millibars.[29] The remnants of Yali deepened and moved towards the southern end of New Zealand.[29] The central pressure of the remnants reached 970–975 millibars as it crossed the coast of South Island on March 29. After passing New Zealand, Yali's remnants passed below the Antarctic Circle and was absorbed by a circumpolar trough between 65°S and 75°S.[29] Tanna received rather severe damage from Yali, however monetary estimates are not available.[29] About 60–70 percent of crops were destroyed and about 30% of the houses were damaged by the storm. Both Tanna and Aniwa were suffering a severe drought, so food stocks were low. Other places in Vanatu only received minor damage. The passage of Yali in New Zealand caused high seas and flooding over South Island, Westport and Nelson. One fatality occurred when a youth died in New Plymouth. Trees toppled, roofs were ripped off and power lines fell.[29]
Severe Tropical Cyclone Zuman
Category 3 severe tropical cyclone (Australian scale) Category 3 tropical cyclone (SSHS) 

Duration March 30 – April 5 Intensity 150 km/h (90 mph) (10-min), 955 mbar (hPa) A tropical depression formed on March 29 about 300 nautical miles (560 km) northeast of Port Vila. The depression became Tropical Cyclone Zuman on March 30. Zuman moved westward until March 31, when it rapidly strengthened and turned southward. Zuman struck the island of Espiritu Santo with winds of 90 mph (145 km/h). Nothing changed as the month of April opened as Zuman stayed at about 90 mph (145 km/h).[30] On April 3, Zuman reached its peak pressure of 955 millibars. Zuman drifted to the south and then to the southeast. Zuman was slowly weakening due to wind shear. Zuman hugged the entire eastern coast of New Caledonia on April 5. Winds had decreased to 45 mph (72 km/h) and the advisories discontinued in Fiji, which downgraded it to a depression.
Zuman caused heavy damage in Espiritu Santo as there were serious damage to dwellings and coconut trees. Nevertheless, there were no deaths resulting from the storm.
Tropical Cyclone Alan
Category 1 tropical cyclone (Australian scale) Tropical storm (SSHS) 

Duration April 17 – April 25 Intensity 75 km/h (45 mph) (10-min), 992 mbar (hPa) On April 17, RSMC Nadi reported that a tropical disturbance had developed to the east of the northern Cook Islands. During April 18, the disturbance gradually developed further while moving towards the southeast before on April 19, RSMC Nadi reported that the disturbance had developed, into a tropical depression while located about 555 km (345 mi), to the southeast of Manihiki Atoll. Over the next couple of days the depression gradually organized further before at 1800 UTC on April 21, RSMC Nadi reported that the depression had intensified into a category one tropical cyclone and named it Alan. During the next day, the NPMOC started to issue warnings on Alan and accidentally designated it as 32P rather than 36P, before reporting later that day that Alan had reached its peak 1-minute sustained windspeeds of 85 km/h (50 mph). RSMC Nadi also reported that the system had peaked as a category one tropical cyclone with peak 10-minute sustained windspeeds of 75 km/h (45 mph).
Tropical Cyclone Bart
Category 1 tropical cyclone (Australian scale) Tropical storm (SSHS) 

Duration April 28 – May 3 Intensity 85 km/h (50 mph) (10-min), 987 mbar (hPa) On April 28, RSMC Nadi reported that a tropical depression had developed about 655 km (405 mi) to the northeast of Papeete, on the French Polynesian island of Tahiti.[7][9] Over the next 24 hours the depression moved quickly to the southeast, while gradually intensifying with nearby automatic weather stations reporting strong winds and significant pressure drops.[9][31] At 1800 UTC on April 29, RSMC Nadi named the depression Bart, as it had intensified into a tropical cyclone while the NPMOC issued a tropical cyclone formation alert on the system.[32][33] RSMC Nadi then reported 12 hours later that Bart had reached its peak 10-minute sustained windspeeds of 85 km/h (50 mph), as the system slowed down due to a blocking ridge of high pressure strengthening.[7][9] Later that day at 1500 UTC, the NPMOC initiated advisories on Bart and designated it as Tropical Cyclone 37P, while it was at its peak 1-minute sustained windspeeds of 65 km/h (40 mph).[31][33] Later that day Bart started to weaken, before on May 1, satellite imagery showed that Bart's, low level center had become exposed as the main area of convection had become sheared.[9] Despite gale force windspeeds occurring in Bart's southern semicircle, the NPMOC and RSMC Nadi reported that the system had weakened into a tropical depression, with the NPMOC subsequently issuing their final advisory on Bart.[9][34] Later that day the depression accelerated towards the southeast, before Bart dissipated early on May 3, about 100 km (60 mi) to the north of Pitcairn Island.[9][32] Minor damage was recorded in French Polynesia from Cyclone Bart while 10 deaths were associated with Bart, after waves from the system capsized a boat.[1][9][35]
Season effects
This table lists all the storms that developed in the South Pacific basin during the 1997–98 season. It includes their intensity on the Australian Tropical cyclone intensity scale, duration, name, areas affected, deaths, and damages. For most storms the data is taken from RSMC Nadi's and or TCWC Wellington's archives, however data for 03P has been taken from the JTWC/NPMOC archives as opposed to RSMC Nadi's or TCWC Wellington's, and thus the winds are over 1-minute as opposed to 10-minutes.
Storm
NameDates active Storm category
at peak intensityPeak 10-min
sustained windsPressure Areas affected Damage
(USD)Deaths Refs 02P Lusi October 8 - 12 Category 2 tropical cyclone 95 km/h (60 mph) 985 hPa (28.09 inHg) Vanuatu, Fiji None None 03P None October 26 – 28 Tropical Depression 55 km/h (35 mph) 997 hPa (29.44 inHg) Fiji None None 04P Martin October 27 – November 5 Category 3 severe tropical cyclone 155 km/h (100 mph) 945 hPa (27.91 inHg) Northern Cook Islands, French Polynesia 28 05P Nute November 18 – 19 Category 2 tropical cyclone 110 km/h (70 mph) 975 hPa (28.79 inHg) None None None 06P Osea November 24 – 28 Category 3 severe tropical cyclone 150 km/h (90 mph) 950 hPa (28.05 inHg) French Polynesia 07P Pam December 6–10 Category 2 tropical cyclone 110 km/h (70 mph) 975 hPa (28.79 inHg) Cook Islands 10P Ron January 2 – 8 Category 5 severe tropical cyclone 230 km/h (145 mph) 900 hPa (26.56 inHg) Samoan Islands, Tonga 11P Susan January 2 – 9 Category 5 severe tropical cyclone 230 km/h (145 mph) 900 hPa (26.56 inHg) Vanuatu, Fiji 12P Katrina January 7 – 11 Category 3 severe tropical cyclone 150 km/h (90 mph) 955 hPa (28.20 inHg) Solomon Islands, Vanuatu 16P Tui January 25 – 27 Category 1 tropical cyclone 75 km/h (45 mph) 990 hPa (29.25 inHg) Samoan islands $1 million 1 [36] 17P Ursula January 30 – February 1 Category 2 tropical cyclone 110 km/h (70 mph) 975 hPa (28.79 inHg) French Polynesia Minor None 18P Veli February 1 – February 3 Category 2 tropical cyclone 100 km/h (65 mph) 985 hPa (29.09 inHg) French Polynesia Minor None 19P Wes January 31 – February 5 Category 2 tropical cyclone 95 km/h (60 mph) 985 hPa (28.09 inHg) None None None N/A None February 11 – 15 Tropical Depression Unknown Unknown None None None N/A None February 18 – 19 Tropical Depression Unknown Unknown Fiji Unknown Unknown N/A None February 28 – March 1 Tropical Depression Unknown Unknown None None None N/A None February 28 – March 2 Tropical Depression Unknown Unknown None None None 29P Yali March 19 – 25 Category 3 severe tropical cyclone 130 km/h (80 mph) 965 hPa (28.50 inHg) Melanesia, Australia, New Zealand 31P Zuman March 30 – April 5 Category 3 severe tropical cyclone 150 km/h (90 mph) 955 hPa (28.20 inHg) Vanuatu, New Caledonia 36P Alan April 17 – 25 Category 1 tropical cyclone 75 km/h (45 mph) 992 hPa (29.31 inHg) French Polynesia 37P Bart April 28 – May 5 Category 1 tropical cyclone 85 km/h (50 mph) 987 hPa (29.15 inHg) French Polynesia Minor 10 Season Aggregates 21 depressions October 8 – May 5 230 km/h (145 mph) 900 hPa (26.56 inHg) Retirement
After the season ended, the names Martin, Osea, Ron, Susan, Tui, Ursula and Veli were retired from the list.[37] They were replaced with Mike, Odile, Reuben, Solo, Tuni, Ula, and Victor.[38]
See also
- List of Southern Hemisphere tropical cyclone seasons
- Atlantic hurricane seasons: 1997, 1998
- Pacific hurricane seasons: 1997, 1998
- Pacific typhoon seasons: 1997, 1998
- North Indian Ocean cyclone seasons: 1997, 1998
References
- ^ a b c d e f g h Chappel, L.C.; Bate, P.W. (2000-06-02). "The South Pacific and Southeast Indian Ocean Tropical Cyclone Season 1997–98". Australian Meteorological and Oceanographic Journal (Bureau of Meteorology) 49: 121–138. http://www.bom.gov.au/amm/docs/2000/chappel.pdf. Retrieved 2011-05-29.
- ^ Unattributed (1997-10-09). "Cook Islands face possibility of worst cyclone season in years". Pacific Islands Report. Pacific Islands Development Program/Center for Pacific Islands Studies. http://archives.pireport.org/archive/1997/october/10-09-02.html. Retrieved 2011-07-26.
- ^ a b c d Unattributed (1997-11-27). "El Niño predicted to cause more frequent tropical cyclones in South Pacific". National Institute of Water and Atmospheric Research. National Oceanic and Atmospheric Administration. http://www.ideademo.org/MET/Enso/peu/update.dir/NIWA-TCPR.html. Retrieved 2011-06-19.
- ^ a b c d e Unattributed (2002). "Tropical Cyclone 02P (Lusi) best track analysis". Naval Pacific Meteorology and Oceanography Center, Joint Typhoon Warning Center. United States Navy. http://www.usno.navy.mil/NOOC/nmfc-ph/RSS/jtwc/best_tracks/1998/1998s-bsh/bsh021998.txt. Retrieved 2011-05-30.
- ^ a b c d Padgett, Gary (1997). "Monthly Global Tropical Cyclone Summary October 1997". Australian Severe Weather. http://www.australiasevereweather.com/cyclones/1998/summ9710.htm. Retrieved 2011-06-30.
- ^ a b Unattributed (1997-10-08). "Tropical Cyclone 02P (Lusi) warning 1997-10-08 20z". Joint Typhoon Warning Center. United States Navy. http://www.nrlmry.navy.mil/atcf_web/docs/warnings/1998/sh021998.97100818.wrn. Retrieved 2011-06-29.
- ^ a b c d e f g h i Unattributed (2009-05-22). "RSMC Nadi Best Track Data for the 1997–98 season". Fiji Meteorological Service. National Oceanic and Atmospheric Administration. ftp://eclipse.ncdc.noaa.gov/pub/ibtracs/original-bt-data-files/nadi/RSMC%20Nadi%209798%20BT%20Data.txt.txt. Retrieved 2011-05-29.
- ^ Terry, James P. (2007). Tropical cyclones: climatology and impacts in the South Pacific. Springer. pp. 49. ISBN 978-03-387-71542-1. http://books.google.com/?id=CUh3FXQFiDMC&pg=PA77&lpg=PA77&dq=Vanuatu+tropical+cyclones#v=onepage&q=Vanuatu%20tropical%20cyclones&f=false.
- ^ a b c d e f g h i j k l m n o p q Marsden, Ross (2007-08-29). "Tropical Cyclone Season Summary 1997–98". Fiji Meteorological Service. Archived from the original on 2010-08-01. http://www.webcitation.org/5rfDHEnbo. Retrieved 2010-08-01.
- ^ Unattributed (1997-10-12). "Tropical Cyclone 02P (Lusi) warning 1997-10-12 09z". Joint Typhoon Warning Center. United States Navy. http://www.nrlmry.navy.mil/atcf_web/docs/warnings/1998/sh021998.97101206.wrn. Retrieved 2011-06-29.
- ^ a b Unattributed (2009-05-22). "TCWC Wellington Best Track Data 1967–2006". Fiji Meteorological Service, Meteorological Service of New Zealand Limited, Bureau of Meteorology. National Oceanic and Atmospheric Administration. ftp://eclipse.ncdc.noaa.gov/pub/ibtracs/original-bt-data-files/wellington/TC_BT_1967_2006.xls. Retrieved 2011-05-18.
- ^ "A cyclone fact file". Fiji Meteorological Service (Fiji Times). 2003-01-16.
- ^ Unattributed (2002-12-17). "Tropical Cyclone 03P best track anaylsis". Naval Pacific Meteorology and Oceanography Center, Joint Typhoon Warning Center. United States Navy. http://www.usno.navy.mil/NOOC/nmfc-ph/RSS/jtwc/best_tracks/1998/1998s-bsh/bsh031998.txt. Retrieved 2011-06-05.
- ^ a b Unattributed (1997-10-26). "Tropical Cyclone 03P Warning 1997-10-26 1500 UTC". Joint Typhoon Warning Center. United States Navy. http://www.nrlmry.navy.mil/tc-bin/tc_display.cgi?STATUS=inactive&ACTION=Latest_Photos&ACTIVES=None&MOSAIC_SCALE=20&PHOT=yes&ATCF_BASIN=sh&BASIN=SHEM&STORM_NAME=03S.ZELIA&CGI=SATPRODUCTS&AGE=Prev&ARCHIVE=all&SIZE=full&NAV=tc&YR=98&ATCF_YR=1998&YEAR=1998&ATCF_FILE=/SATPRODUCTS/kauai_data/www/atcf_web/public_html/docs/warnings/1998/sh031998.97102618.wrn&CURRENT=sh031998.97102612.wrn&CURRENT_ATCF=sh031998.97102612.wrn&ATCF_NAME=sh031998&ATCF_DIR=/SATPRODUCTS/kauai_data/www/atcf_web/public_html/docs/warnings/1998&STYLE=frames&USE_THIS_DIR=/SATPRODUCTS/TC/tc98/SHEM/03S.ZELIA/CloudSat&DIR=/SATPRODUCTS/TC/tc98/SHEM/03S.ZELIA/ssmi/85h/2degreeticks&TYPE=ssmi&PROD=warn. Retrieved 2011-06-30.
- ^ a b c Unattributed (2002). "Tropical Cyclone 05P (Nute) best track analysis". Naval Pacific Meteorology and Oceanography Center, Joint Typhoon Warning Center. United States Navy. http://www.usno.navy.mil/NOOC/nmfc-ph/RSS/jtwc/best_tracks/1998/1998s-bsh/bsh051998.txt. Retrieved 2011-05-30.
- ^ a b c Unattributed (2010). "Tropical Cyclone Nute". Tropical Cyclone Warning Center Brisbane. Bureau of Meteorology. http://www.bom.gov.au/cyclone/history/nute.shtml. Retrieved 2011-05-30.
- ^ a b Unattributed (1997). "Tropical Cyclone 05P (Nute) Advisories". Joint Typhoon Warning Center. Australian Severe Weather. http://www.australiasevereweather.com/tropical_cyclones/1997_1998/warnings/tropical_cyclone_nute_jtwc_advisories.htm. Retrieved 2011-05-30.
- ^ a b c d e http://www.australiasevereweather.com/cyclones/1998/summ9711.txt
- ^ a b c d e f g Pam report
- ^ a b c d e f g h i j k Padgett, Gary (1998). "Monthly Global Tropical Cyclone Summary January 1998". Australian Severe Weather. http://www.australiasevereweather.com/cyclones/1998/summ9801.htm. Retrieved 2011-06-27.
- ^ Staff Writer (July 26, 2006). "Southwestern Pacific Cyclones – 1998". National Oceanic and Atmospheric Administration. http://www.ngdc.noaa.gov/dmsp/hurricanes/swpacific98.html. Retrieved June 29, 2009.
- ^ Unattributed (1998). "Annual Tropical Cyclone Report: 1998". Naval Pacific Meteorology and Oceanography Center, Joint Typhoon Warning Center. United States Navy. pp. 127–137. http://www.usno.navy.mil/NOOC/nmfc-ph/RSS/jtwc/atcr/1998atcr/pdf/1998_complete.pdf. Retrieved 2011-05-29.
- ^ a b Unattributed (2002-12-17). "Tropical Cyclone 16P best track anaylsis". Naval Pacific Meteorology and Oceanography Center, Joint Typhoon Warning Center. United States Navy. http://www.usno.navy.mil/NOOC/nmfc-ph/RSS/jtwc/best_tracks/1998/1998s-bsh/bsh161998.txt. Retrieved 2011-06-02.
- ^ Unattributed (1998-01-27). "Samoans examining damage from Cyclone Tui". Pacific Islands Report (Pacific Islands Development Program/Center for Pacific Islands Studies). Archived from the original on 2011-07-26. http://www.webcitation.org/60SGDjQca. Retrieved 2011-07-26.
- ^ a b Padgett, Gary (1998). "Monthly Global Tropical Cyclone Summary February 1998". Australian Severe Weather. http://www.australiasevereweather.com/cyclones/1998/summ9802.htm. Retrieved 2011-06-27.
- ^ Unattributed (2002-12-17). "Tropical Cyclone 17P best track anaylsis". Naval Pacific Meteorology and Oceanography Center, Joint Typhoon Warning Center. United States Navy. http://www.usno.navy.mil/NOOC/nmfc-ph/RSS/jtwc/best_tracks/1998/1998s-bsh/bsh171998.txt. Retrieved 2011-06-05.
- ^ Tropical Cyclone Veli (TC-18P) --- 31 January-3 February
- ^ http://www.pacificdisaster.net/pdnadmin/data/original/FJI_MET_2001_floods1840_2000.pdf
- ^ a b c d e f g h i j k Yali report
- ^ Tropical Cyclone Zuman (TC-31P) 29 March-6 April[dead link]
- ^ a b Unattributed (2002-12-17). "Tropical Cyclone 37P (Bart) best track analysis". Naval Pacific Meteorology and Oceanography Center, Joint Typhoon Warning Center. United States Navy. http://www.usno.navy.mil/NOOC/nmfc-ph/RSS/jtwc/best_tracks/1998/1998s-bsh/bsh371998.txt. Retrieved 2011-05-29.
- ^ a b Padgett, Gary (1998). "Monthly Global Tropical Cyclone Summary April 1998". Australian Severe Weather. http://www.australiasevereweather.com/cyclones/1998/summ9804.htm. Retrieved 2011-05-29.
- ^ a b Unattributed (1998-04-30). "Tropical Cyclone 37P (Bart) warning 1998-04-30 18z". Naval Pacific Meteorology and Oceanography Center. United States Navy. Archived from the original on 2011-06-05. http://www.webcitation.org/5zDMlZNhA. Retrieved 2011-06-05.
- ^ Unattributed (1998-04-30). "Tropical Cyclone 37P (Bart) warning 1998-05-02 06z". Naval Pacific Meteorology and Oceanography Center. United States Navy. Archived from the original on 2011-06-05. http://www.webcitation.org/5zDOhSIAB. Retrieved 2011-06-05.
- ^ May, Jutta (2008-09-17). "Event Information: Tropical Cyclone Bart". Pacific Disaster.Net. http://www.pacificdisaster.net/pdn2008/ExportPdfServlet?header=Event%20Information&sql=Select%20*%20From%20Event%20Where%20Id=174&photo=. Retrieved 2011-06-02.
- ^ McKenzie, Emily; Prasad, Biman; Kaloumaira, Atu (2005). "Economic Impact of Natural Disasters on development in the Pacific Volume 1: Research Report". Australian Agency for International Development, The University of the South Pacific, South Pacific Applied Geoscience Commission. Pacific Disaster.net. pp. 10–89. Archived from the original on 2010-02-25. http://www.webcitation.org/5noEcWKP4. Retrieved 2010-06-29.
- ^ "Retired Tropical Cyclone Names". Hurricane Alley.net. 2005. http://www.hurricanealley.net/retired.htm#Nadi/Fiji_Area_of_Responsibility. Retrieved 2008-08-15.[dead link]
- ^ "Tropical Cyclone Operational Plan for the South Pacific and South-East Indian Ocean". World Meteorological Organization. 1999. http://www.wmo.int/pages/prog/www/tcp/documents/doc/Op-pln99.doc. Retrieved 2008-08-15.
External links
- World Meteorological Organization
- Fiji Meteorological Service
- Meteorological Service of New Zealand
- Joint Typhoon Warning Center
1990–2000 South Pacific cyclone seasons Categories:- 1997–98 Southern Hemisphere tropical cyclone season
- 1997–98 South Pacific cyclone season


Wikimedia Foundation. 2010.