- Clark County, Illinois
-
Clark County, Illinois 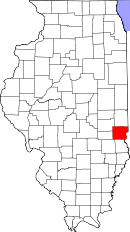
Location in the state of Illinois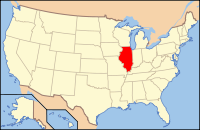
Illinois's location in the U.S.Founded 1819 Seat Marshall Largest city Marshall Area
- Total
- Land
- Water
504.82 sq mi (1,307 km²)
501.42 sq mi (1,299 km²)
3.40 sq mi (9 km²), 0.67%Population
- (2010)
- Density
16,335
34/sq mi (13/km²)Time zone Central: UTC-6/-5 Website www.clarkcountyil.org Clark County is a county located in the U.S. state of Illinois. According to the 2010 census, it has a population of 16,335, which is a decrease of 4.0% from 17,008 in 2000.[1] Its county seat is Marshall.[2]
Contents
History
Clark County was formed in 1819 out of Crawford County. At the time of its formation, Clark County included about a third of Illinois. It acquired its present boundaries in 1831 as new counties were formed out of it. Clark County was named for George Rogers Clark (older brother of William Clark of the Lewis and Clark Expedition), an officer of the army of Virginia that captured the Northwest Territory from the British at the close of the Revolutionary War.
-

Clark County from the time of its creation to 1821
-

Clark between 1821 and 1823
-

Clark between 1823 and 1830
-
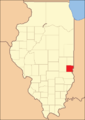
Clark reduced to its current size in 1830 by the creation of Coles County
Geography
According to the 2010 census, the county has a total area of 504.82 square miles (1,307.5 km2), of which 501.42 square miles (1,298.7 km2) (or 99.33%) is land and 3.40 square miles (8.8 km2) (or 0.67%) is water.[3] Part of the county's eastern border is defined by the Wabash River.
Adjacent counties
- Edgar County - north
- Vigo County, Indiana - northeast
- Sullivan County, Indiana - southeast
- Crawford County - south
- Jasper County - southwest
- Cumberland County - west
- Coles County - northwest
Major highways
 Interstate 70
 US Route 40
 Illinois Route 1
 Illinois Route 49
Townships
Clark County is divided into fifteen townships:
Cities and towns
- Casey
- Clarksville (unincorporated town)
- Marshall
- Martinsville
- Westfield
- West Union (unincorporated town)
Education
There are three school districts in Clark County (Marshall, Martinsville and Casey-Westfield) with a total enrollment (2004) of 3,014 students. Each district has one high school (grades 9-12) and one junior high school (grades 7-8). Marshall has two elementary schools and the other districts have one each.
Political districts
- Illinois' 15th congressional district
- State House District 109
- State Senate District 55
Demographics
 2000 census age pyramid for Clark County.
Historical populations Census Pop. %± 1900 24,033 — 1910 23,517 −2.1% 1920 21,165 −10.0% 1930 17,872 −15.6% 1940 18,842 5.4% 1950 17,362 −7.9% 1960 16,546 −4.7% 1970 16,216 −2.0% 1980 16,913 4.3% 1990 15,921 −5.9% 2000 17,008 6.8% IL Counties 1900-1990 As of the census[4] of 2000, there were 17,008 people, 6,971 households, and 4,809 families residing in the county. The population density was 34 people per square mile (13/km²). There were 7,816 housing units at an average density of 16 per square mile (6/km²). The racial makeup of the county was 98.78% White, 0.20% Black or African American, 0.18% Native American, 0.14% Asian, 0.03% Pacific Islander, 0.08% from other races, and 0.59% from two or more races. 0.32% of the population were Hispanic or Latino of any race. 26.4% were of German, 24.4% American, 16.1% English and 10.3% Irish ancestry according to Census 2000. 98.6% spoke English as their first language.
There were 6,971 households out of which 31.20% had children under the age of 18 living with them, 56.90% were married couples living together, 8.70% had a female householder with no husband present, and 31.00% were non-families. 28.10% of all households were made up of individuals and 14.00% had someone living alone who was 65 years of age or older. The average household size was 2.40 and the average family size was 2.94.
In the county the population was spread out with 24.90% under the age of 18, 7.40% from 18 to 24, 26.60% from 25 to 44, 23.10% from 45 to 64, and 18.00% who were 65 years of age or older. The median age was 39 years. For every 100 females there were 94.70 males. For every 100 females age 18 and over, there were 90.80 males.
The median income for a household in the county was $35,967, and the median income for a family was $43,213. Males had a median income of $32,035 versus $20,954 for females. The per capita income for the county was $17,655. About 6.40% of families and 9.20% of the population were below the poverty line, including 12.20% of those under age 18 and 7.50% of those age 65 or over.
Climate and weather
Marshall, Illinois Climate chart (explanation) J F M A M J J A S O N D 2.234162.240213.35131463414.374514.283614.486654.484622.978552.866433.751333.13922Average max. and min. temperatures in °F Precipitation totals in inches Source: The Weather Channel[5] Metric conversion J F M A M J J A S O N D 571-9574-68311-110117510923111082816113301811229177526137119693111794-6Average max. and min. temperatures in °C Precipitation totals in mm In recent years, average temperatures in the county seat of Marshall have ranged from a low of 16 °F (−9 °C) in January to a high of 86 °F (30 °C) in July, although a record low of −23 °F (−31 °C) was recorded in January 1930 and a record high of 109 °F (43 °C) was recorded in July 1936. Average monthly precipitation ranged from 2.23 inches (57 mm) in January to 4.43 inches (113 mm) in July.[5]
See also
References
- United States Census Bureau 2007 TIGER/Line Shapefiles
- United States Board on Geographic Names (GNIS)
- United States National Atlas
- ^ "Clark County QuickFacts". United States Census Bureau. http://quickfacts.census.gov/qfd/states/17/17023.html. Retrieved 2011-11-05.
- ^ "Find a County". National Association of Counties. http://www.naco.org/Counties/Pages/FindACounty.aspx. Retrieved 2011-06-07.
- ^ "Census 2010 U.S. Gazetteer Files: Counties". United States Census. http://www.census.gov/geo/www/gazetteer/files/Gaz_counties_national.txt. Retrieved 2011-11-05.
- ^ "American FactFinder". United States Census Bureau. http://factfinder.census.gov. Retrieved 2008-01-31.
- ^ a b "Monthly Averages for Marshall, Illinois". The Weather Channel. http://www.weather.com/weather/wxclimatology/monthly/graph/USIL0732. Retrieved 2011-01-27.
External links

Coles County Edgar County Vigo County, Indiana Cumberland County 
 Clark County, Illinois

Jasper County Crawford County Sullivan County, Indiana Municipalities and communities of Clark County, Illinois Cities Casey‡ | Marshall | Martinsville

Town Townships Unincorporated
communitiesAdenmoor | Allright | Castle Fin | Choctaw | Clark Center | Clarksville | Cleone | Darwin | Dennison | Doyles | Ernst | Farrington | Golf Lakes | Hogue Town | Livingston | McKeen | Melrose | Moonshine | Moriah | Neadmore | Oak Point | Oakcrest | Oilfield | Orange | Patton‡ | Snyder | Walnut Prairie | Weaver | Weir | West Union | York
Ghost town Griffin
Footnotes ‡This populated place also has portions in an adjacent county or counties
Categories:- Illinois counties
- 1819 establishments in the United States
- Populated places established in 1819
- Clark County, Illinois
-


Wikimedia Foundation. 2010.