- Description of the Medieval Warm Period and Little Ice Age in IPCC reports
-
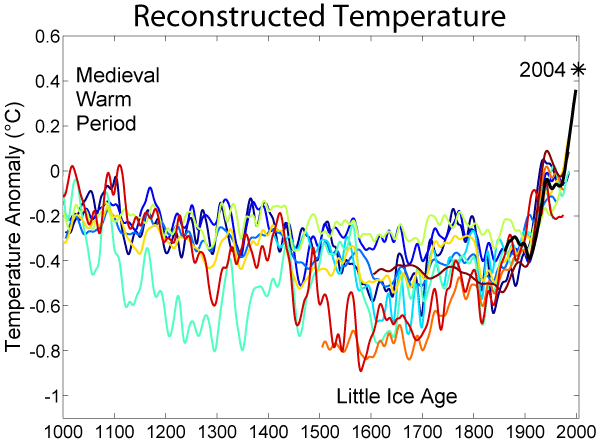
 A selection of temperature reconstructions published between 1998 and 2005
The description of the Medieval Warm Period and Little Ice Age in IPCC reports has changed since the first report in 1990 as scientific understanding of the temperature record of the past 1000 years has improved. The Medieval Warm Period (MWP) and Little Ice Age (LIA) are the best-known temperature fluctuations in the last millennium.
Critics of the "hockey stick graph" of later reports have claimed that the record of the MWP and LIA were suppressed in the IPCC Third Assessment Report, although every report has discussed the phenomena.
Contents
1990 report (FAR)
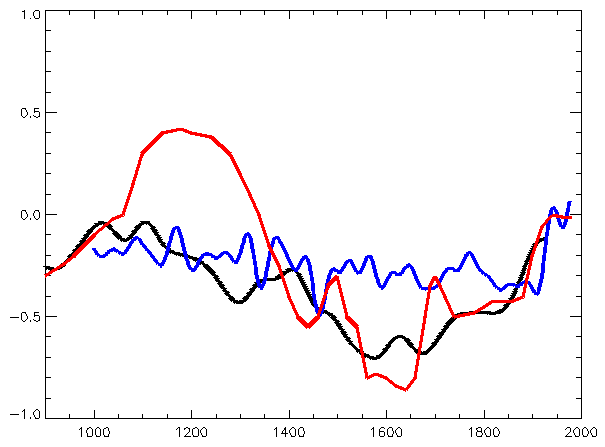
See also: IPCC First Assessment Report IPCC 1990 Figure 7.1.c (red), MBH 1999 40 year average used in IPCC TAR 2001 (blue), and Moberg et al. 2005 low frequency signal (black)
With the growth of interest in global warming in the 1980s came renewed interest in the past temperature record, and the question of whether past times had been warmer or colder than "present". However, at that time available records were few. The discussion in chapter 7 "Observed climate variations and change" of the last 1000 years (excluding the instrumental period) occupies less than a page.
A schematic (non-quantitative) curve was used to represent temperature variations over the last 1000 years in chapter 7. The vertical temperature scale was labelled as "Temperature change (°C)" but no numerical labels were given; it could be taken to imply that temperature variations of the MWP and LIA were each of the order of 0.5 °C from the temperature around 1900. The section specifically states recent climate changes were in a range of probably less than 2 °C. The 1990 report noted that it was not clear whether all the fluctuations indicated were truly global (p 202). The graph had no clear source (but can be traced to publications by Hubert Lamb representing the Central England Temperature. Those publications have no explicit calibration against instrumental data, [and are] just Lamb’s qualitative judgement and interpretation of what he refers to as the ‘evidence’ [1]), and disappeared from the 1992 supplementary report.
Within the 1990 report, the LIA is taken to be global in extent but the MWP is not. Climate over the last 1000 years is mentioned very briefly in the SPM of the 1990 report. The MWP is not mentioned at all, and the LIA described by ...probably fluctuated by little more than 1°C. Some fluctuations lasted several centuries, including the LIA which ended in the [19th century] and which appears to have been global in extent. The MWP is mentioned in the executive summary to chapter 7, as MWP around 1000 AD (which may not have been global).
1992 supplement
The 1992 report (appendix C) used only two graphs of pre-instrumental temperatures, from Wang and Wang (1991). They show air temperature based on documentary evidence in East and North China from 1350–1950. Fluctuations are of the order of 0.5-0.75 °C and indicate, variably, colder-than-present temperatures before the 20th century. The graph stops in 1350 and does not show an MWP. The only text reference to the MWP is qualified by in this region in boldface.
1995 report (SAR)
See also: IPCC Second Assessment ReportBy 1995, research in the subject had advanced and hemispherical reconstructions of temperature were available, though only for the summer season (because tree rings are often most strongly influenced by summer temperatures). The 1995 IPCC report used a northern hemisphere summer temperature reconstruction (fig 3.20) from 1400 to 1979 by Bradley and Jones (1993). This too shows no MWP (it only goes back to 1400) and colder temperatures otherwise before the 20th century, of the order of 0.5 °C colder. Fig 3.21 shows 8 ice core records from 1200 to present, which display a mixed pattern. The MWP and LIA are introduced, in the text, as two periods which have received special attention... These have been interpreted, at times, as periods of global warmth and coolness, respectively. Recent studies have re-evaluated the interval commonly known as the MWP... the available evidence is limited (geographically) and is equivocal.
2001 report (TAR)
See also: IPCC Third Assessment ReportThe 2001 report used northern hemisphere warm-season and annual reconstructions from 1000 AD to present by Mann et al. (1999), Jones et al. (1998) and Briffa (2000) [2].
The IPCC TAR says of the MWP that the posited Medieval Warm Period appears to have been less distinct, more moderate in amplitude, and somewhat different in timing at the hemispheric scale than is typically inferred for the conventionally-defined European epoch. The Northern Hemisphere mean temperature estimates of Jones et al. (1998), Mann et al. (1999), and Crowley and Lowery (2000) show temperatures from the 11th to 14th centuries to be about 0.2°C warmer than those from the 15th to 19th centuries, but rather below mid-20th century temperatures [3].
The TAR discusses Was there a "Little Ice Age" and a "Medieval Warm Period"? and says Thus current evidence does not support globally synchronous periods of anomalous cold or warmth over this timeframe, and the conventional terms of "Little Ice Age" and "Medieval Warm Period" appear to have limited utility in describing trends in hemispheric or global mean temperature changes in past centuries.[3]
2007 report (AR4)
See also: IPCC Fourth Assessment ReportThe 2007 report used more recent temperature reconstructions including Esper et al. (2002), Bradley et al. (2003a), Jones and Mann (2004), D’Arrigo et al. (2006). The IPCC concluded the warmest period prior to the 20th century very likely occurred between 950 and 1100...The evidence currently available indicates that NH mean temperatures during medieval times (950–1100) were indeed warm in a 2-kyr context and even warmer in relation to the less sparse but still limited evidence of widespread average cool conditions in the 17th century (Osborn and Briffa, 2006). However, the evidence is not sufficient to support a conclusion that hemispheric mean temperatures were as warm, or the extent of warm regions as expansive, as those in the 20th century as a whole, during any period in medieval times (Jones et al., 2001; Bradley et al., 2003a,b; Osborn and Briffa, 2006). [4]
See also
References
- ^ P. D. Jones et al., The Holocene 19,1 (2009) pp. 3–49, High-resolution palaeoclimatology of the last millennium: a review of current status and future prospects [1] Appendix A
- ^ Climate Change 2001: The Scientific Basis
- ^ a b Climate Change 2001: The Scientific Basis
- ^ Climate Change 2007: Chapter 6 Paleoclimate
Categories: Climate change assessment and attribution
Wikimedia Foundation. 2010.