- 2004–05 South Pacific cyclone season
-
2004–05 South Pacific cyclone season 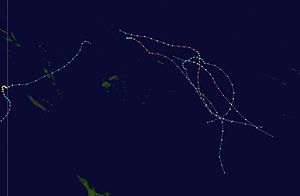
Season summary mapFirst storm formed: October 28, 2004 Last storm dissipated: April 22, 2005 Strongest storm: Percy – 900 hPa (mbar), 230 km/h (145 mph) (10-minute sustained) Total disturbances: 19 Total depressions: 18 Tropical cyclones: 9 Severe tropical cyclones: 5 Total fatalities: Unknown Total damage: $55 million (2005 USD) South Pacific cyclone seasons
2002–03, 2003–04, 2004–05, 2005–06, 2006–07Related articles: The 2004–05 South Pacific cyclone season was an event in the annual cycle of tropical cyclone formation. It began on November 1, 2004 and ended on April 30, 2005. These dates conventionally delimit the period of each year when most tropical cyclones form in the southern Pacific Ocean east of 160°E. Additionally, the regional tropical cyclone operational plan defines a tropical cyclone year separately from a tropical cyclone season, and the "tropical cyclone year" runs from July 1, 2004 to June 30, 2005.[1]
Tropical cyclones between 160°E and 120°W and north of 25°S are monitored by the Fiji Meteorological Service in Nadi. Those that move south of 25°S are monitored by the Tropical Cyclone Warning Centre in Wellington, New Zealand.[1]
Seasonal summary

The 2004–05 South Pacific cyclone season, got off to an early start with the first tropical depression of the season forming on October 28 about 420 km, (260 miles) to the northeast of Honiara in the Solomon Islands. This came about four days before the official start to the season. The Depression gradually moved towards the west and moved into TCWC Brisbane's area of responsibility late on October 30. The South Pacific remained quiet during November with no tropical disturbances forming. This quietness lasted until December 3 when Tropical Depression 02F formed to the north of Vanautu. After being relocated a couple of times the depression then dissipated on December 14 with no impact being reported from the depression. Whilst 02F was active another weaker tropical depression formed to the northwest of Fiji. Remaining weak the depression lasted until December 10 when Nadi issued their final advisory on it as it had dissipated.
Storms
Tropical Depression 01F
Tropical depression (Australian scale) 
Duration October 28 – October 30 Intensity 45 km/h (30 mph) (10-min), 1001 mbar (hPa) Late on October 28, RSMC Nadi reported that a tropical depression had formed about 420 km, (260 mi) to the northeast of Honiara in the Solomon Islands.[2][3] The depressions low level circulation center at this time was located under the deep convection and lied in a weak monsoonal trough which had a low to moderate amount of wind shear.[4] Over the next couple of days the system moved towards the west until late on October 30, when RSMC Nadi released their final advisory on the depression as it was now located within TCWC Brisbane’s area of responsibility.[5][6] TCWC Brisbane mentioned the depression in their tropical weather outlooks for a couple of days but never released any full warnings on the system.[3] There was no impact reported from Tropical Depression 01F.[3]
Tropical Depression 02F
Tropical depression (Australian scale) 
Duration December 3 – December 14 Intensity 55 km/h (35 mph) (10-min), 1000 mbar (hPa) Late on December 3, RSMC Nadi reported that Tropical Depression 02F had formed about 280 km (170 mi) to the north of Port Villa in Vanuatu.[7][8] The depression was located within an area of moderate shear, as a consequence of this major convection was displaced to the east of the low level circulation center. Over the next few days the depression moved towards the east and gradually weakened.[7] However late on December 9 RSMC Nadi reported that the depression had re-intensified and had reached its peak wind speeds of 55 km/h (35 mph).[9] Early the next day RSMC Nadi reported that a new circulation center had developed and relocated the depression's position to about 600 km (370 mi) to the northeast of Fiji.[7] However later that day RSMC Nadi relocated the disturbance to about 600 km (370 mi) to the northwest of Fiji.[7] During December 12 as the depression moved to the south and was located a few hundred miles to the east of northern Vanuatu, the depression's low level circulation center consolidated and thus Nadi started to issue gale warnings on the depression however the depression then weakened and Nadi issued their final warning on December 14.[7] There was no impact reported from Tropical Depression 02F.[7]
Tropical Depression 03F
Tropical depression (Australian scale) Duration December 5 – December 10 Intensity 35 km/h (25 mph) (10-min), 1003 mbar (hPa) Early on December 5, a weak tropical disturbance formed within a moderately sheared environment to the northwest of Fiji.[10] Later that day it was designated as Tropical Depression 03F by RSMC Nadi.[7][10] Deep convection was detached from the Low level circulation center and remained to the north and south of the depression.[11] Over the next couple of days the depression remained weak reaching a peak pressure of 1003 hPa, before being absorbed into a trough of low pressure on December 8.[12][13] RSMC Nadi then issued its final advisory on December 10 as the depression had dissipated after remaining weak throughout its lifetime.[14][15]
Tropical Cyclone Judy
Category 1 tropical cyclone (Australian scale) 
Duration December 21 – December 27 Intensity 85 km/h (50 mph) (10-min), 989 mbar (hPa) On December 21, RSMC Nadi reported that Tropical Disturbance 04F had developed, along an active and slow-moving monsoon trough near French Polynesia.[16] The depression was in an area of high shear, with the deep convection located to the northeast of the center. The low level circulation center at this time was exposed but was developing despite the high shear associated with the system. Early on December 24 deep convection associated with the system moved over the low level circulation center whilst the system was getting better organized. Later that day at 1800 UTC the Depression was upgraded to a category one tropical cyclone and was named Judy whilst located about 510 km (320 mi) southeast of Tahiti and moving towards the southwest. During the next few hours under strengthening shear, Judy struggled to maintain itself. However as it moved further to the south if came under a strengthening steering field which was being enhanced by a trough of low pressure to the west of the steering field which helped to neutralize the effect of the shear over the cyclone. Judy then intensified slightly further and reached its peak intensity of 85 km/h, (50 mph), with a peak pressure of 989 hPa late on December 25 whilst turning towards the south towards TCWC Wellington's area of responsibility. RSMC Nadi then released their final advisory on Cyclone Judy early the next day as they passed primary warning responsibility of the cyclone to TCWC Wellington. The cyclone had started to weaken by this time due to it moving in to cooler waters. TCWC Wellington kept Judy as a tropical cyclone for 12 hours before declaring it had become extratropical. The remnants of Judy eventually merged with a low pressure system to the southeast of Tahiti.
Severe Tropical Cyclone Kerry
Category 3 severe tropical cyclone (Australian scale) Category 2 tropical cyclone (SSHS) 

Duration January 5 – January 14 Intensity 140 km/h (85 mph) (10-min), 970 mbar (hPa) Tropical Cyclone Kerry developed from Tropical Depression 05F on January 5, 315 nautical miles (583 km) northeast of Port Vila, Vanuatu. Kerry moved to the southwest with 40-knot (70 km/h) winds as it moved over Vanuatu. Once past the island, Kerry moved on a west-southwest course and it began to intensify after turning to the west. The storm reached a peak intensity of 85 knots (157 km/h) before turning towards the south-southeast. The storm began to weaken under vertical shear and was downgraded to a depression on January 13.[17]
Tropical Cyclone Lola
Category 1 tropical cyclone (Australian scale) Duration January 26 – February 2 Intensity 75 km/h (45 mph) (10-min), 990 mbar (hPa) Tropical Storm Lola developed from Tropical Depression 06F on January 31, 100 nautical miles (200 km) west-southwest of Tongatapu. Lola reached a peak intensity of 40 knots (70 km/h), but was downgraded to a depression on February 2.[18]
Severe Tropical Cyclone Meena
Category 5 severe tropical cyclone (Australian scale) Category 4 tropical cyclone (SSHS) 

Duration February 1 – February 8 Intensity 215 km/h (130 mph) (10-min), 915 mbar (hPa) On February 1, the RSMC Nadi began monitoring a tropical disturbance, which they designated as 07F, to the west of the northern Cook Islands.[16] The next day, a small area of deep convection developed.[19]
Severe Tropical Cyclone Olaf
Category 5 severe tropical cyclone (Australian scale) Category 5 tropical cyclone (SSHS) 

Duration February 10 – February 20 Intensity 215 km/h (130 mph) (10-min), 915 mbar (hPa) Main article: Cyclone OlafThe most intense system of the season, Tropical Cyclone Olaf developed rapidly like Nancy. By February 16, Olaf had attained maximum sustained winds of 145 knots (269 km/h) and was thrashing American Samoa. However bad the damage was, it could have been worse as Olaf veered east, its eyewall missing the islands.
Severe Tropical Cyclone Nancy
Category 4 severe tropical cyclone (Australian scale) Category 4 tropical cyclone (SSHS) 

Duration February 10 – February 17 Intensity 175 km/h (110 mph) (10-min), 935 mbar (hPa) Main article: Cyclone NancyCyclone Nancy formed on February 10 as Tropical Disturbance 09F, over the next couple of days. The disturbance gradually developed and was designated as Cyclone Nancy during February 12 due to its outflow improving and a small area of deep convection, developing over the center of circulation, whilst it was located about 485 km (301 mi) east-northeast of Pago Pago, American Samoa. During that day Nancy started to rapidly intensify becoming a Severe Tropical Cyclone late on February 13 as a small, irregularly shaped, eye had begun to develop.
The next day both RSMC Nadi, and the JTWC reported that Cyclone Nancy had attained its peak intensity of 175 km/h (110 mph 10-minute winds) and 230 km/h (145 mph 1-minute winds). Increasing wind shear then caused Nancy to weaken. Early on February 15, the storm passed directly over Manuae. Continued weakening took place as a trough of low pressure approached from the southwest. By February 16, Nancy weakened below hurricane intensity and turned to the southwest as it began to undergo a Fujiwhara interaction with Cyclone Olaf, strong shear associated with the outflow of Cyclone Olaf caused all convection associated with Nancy to be displaced to the southwest on February 16. Early on February 17, Nancy transitioned into an extratropical cyclone as it entered the area of responsibility of TCWC Wellington. Shortly afterwards, the low was absorbed into the larger circulation of Olaf however it was monitored by TCWC Wellington as a separate system until 1200 UTC on February 18.
Already impacted by Cyclone Meena a week earlier, the Cook Islands sustained significant damage from Cyclone Nancy. Several homes were damaged and destroyed throughout the islands. Downed trees and power lines blocked roads and cut power and minor flooding was reported along coastal areas.
Severe Tropical Cyclone Percy
Category 5 severe tropical cyclone (Australian scale) Category 5 tropical cyclone (SSHS) 

Duration February 24 – March 5 Intensity 230 km/h (145 mph) (10-min), 900 mbar (hPa) Main article: Cyclone PercyPercy quickly formed from an area of low pressure on February 24 and reached Category 1 status north of American Samoa. The cyclone then moved eastward, peaking at Category 5 status before turning southward. Percy then passed through the southwestern Cook Islands causing severe damage before dissipating. [20]
Tropical Depression 11F
Tropical depression (Australian scale) Duration February 26 – February 27 Intensity 55 km/h (35 mph) (10-min), 998 mbar (hPa) Late on February 26, RSMC Nadi reported that Tropical Depression 11F had formed about 1,200 km (750 mi), to the northwest of Henderson Island.[21] The depression was located east of an 250hPa outflow channel and was poorly organised with major convection located to the northeast of the low level circulation center.[21] During the next morning RSMC Nadi downgraded the depression to a tropical disturbance as they issued their final advisory on the depression.[22]
Tropical Cyclone Rae
Category 1 tropical cyclone (Australian scale) Tropical storm (SSHS) 

Duration February 28 – March 6 Intensity 75 km/h (45 mph) (10-min), 990 mbar (hPa) Tropical Depression 13F
Tropical depression (Australian scale) Duration March 2 – March 4 Intensity Winds unknown, 1001 mbar (hPa) Late on February 27, RSMC Nadi reported that a suspect tropical disturbance was developing near to the north of Rennel Island, in the Solomon Islands.[22] Over the next couple of days the system gradually developed and before it was declared as a tropical disturbance early on March 1. At this time convection detached from the disturbance's low level circulation center, whilst vertical wind shear around the system remained weak.[22][23][24] Early the next day, the Disturbance was then relocated to the northwest of Viti Levu in Fiji, before it was designated as Tropical Depression 13F later that day.[25][26] The Depression remained weak reaching an estimated central pressure of 1001 hPa (mbar) early on March 3, however there were no winds reported by RSMC Nadi whilst they were monitoring it.[26][27] RSMC Nadi then issued their last advisory on 13F early on March 4 after no persistent convection reported around the system since the depression reached its peak pressure.[26][28]
Tropical Depression 14F
Tropical depression (Australian scale) Duration April 14 – May 1 Intensity 55 km/h (35 mph) (10-min), 1000 mbar (hPa) Tropical Cyclone Sheila
Category 1 tropical cyclone (Australian scale) Duration April 22 – April 22 Intensity 75 km/h (45 mph) (10-min), 990 mbar (hPa) Tropical Disturbance 16F
Tropical disturbance (Australian scale) Duration April 20 – April 22 Intensity 35 km/h (25 mph) (10-min), 1002 mbar (hPa) Late on April 20, RSMC Nadi reported that Tropical Disturbance 16F had formed to the east of Fiji.[29] Over the next couple of days the disturbance remained weak in an area of moderate vertical wind shear and poorly organised before the final advisory was issued early on April 22.[30][31]
Tropical Depression 17F
Tropical depression (Australian scale) Duration April 26 – May 1 Intensity 45 km/h (30 mph) (10-min), 1007 mbar (hPa) Early on April 26, RSMC Nadi reported that Tropical depression 17F had formed to the east of Tokelau and was located within an area of low to moderate vertical wind shear.[32][33] Convection around the system was also poorly orgainsed.[33] The depression moved slowly towards the west before early on April 29 the low level circulation center was relocated to the northeast of Vanautu with deep convection detached from the low level circulation center and located to the southeast of the center with the system not showing much improvement over the last 24 hours.[34] Late the next day it was redesignated as a weak Tropical Depression by RSMC Nadi as there was now no organised convection in the vicinity of the low level circulation center.[35] The final advisory was issued by RSMC Nadi late on May 1.[36]
Tropical Depression 18F
Tropical depression (Australian scale) Duration April 29 – May 1 Intensity Winds unknown, 1006 mbar (hPa) Late on April 29, RSMC Nadi reported that Tropical Depression 18F, had formed to the northwest of Wallis and Futuna. Deep Convection was located to the south of the low level circulation center and was in an area of low to mid vertical windshear.[34] However it failed to develop any further and was redesignated as a weak tropical depression late the next day as there was not any orgainsed convection near the center.[35] RSMC Nadi then issued their final advisory late on May 1.[36]
Season effects
This table lists all the storms that developed in the South Pacific to the east of longitude 160°E during the 2004–2005 season. It includes their intensity on the Australian Tropical cyclone intensity scale, duration, name, landfalls, deaths, and damages. All data is taken from RSMC Nadi and or TCWC Wellington. The Damage figures are all 2005 USD.
2004–05 South Pacific Cyclone statistics Storm name Active dates Storm category at peak intensity
Max wind
(mph)
Min. press.
(mbar)
Landfall(s) Damage (millions
USD)
Deaths Where When Wind (mph)
01F October 28 – October 30 Tropical depression 30 1001 none none 0 02F December 3 – December 14 Tropical depression 35 1000 none none 0 03F December 5 – December 10 Tropical depression 30 1000 none none 0 Judy December 21 – December 27 Category 1 cyclone 50 989 none none 0 Kerry January 5 – January 14 Category 3 cyclone 85 970 none none 0 Lola January 27 – February 2 Category 1 cyclone 45 990 none none 0 Meena February 1 – February 8 Category 5 cyclone 130 915 Cook Islands (direct hit, no landfall) February 6 130 20 0 Olaf February 13 – February 20 Category 5 cyclone 130 915 American Samoa (direct hit, no landfall) February 16 130 10 0 Cook Islands (direct hit, no landfall) February 17 115 Nancy February 10 – February 17 Category 4 cyclone 110 935 Cook Islands (direct hit, no landfall) February 14 110 unknown 0 Percy February 24 – March 5 Category 5 cyclone 145 900 Northern American Samoa (direct hit, no landfall) February 27 115 25 0 Northern Cook Islands (direct hit, no landfall) February 28 100 11F February 26 – February 27 Tropical depression 35 998 none none 0 Rae March 5 – March 6 Category 1 cyclone 45 990 none minimal 0 13F February 27 – March 4 Tropical depression unk. 1001 none none 0 14F April 14 – May 1 Tropical depression 35 1000 none none 0 Sheila April 20 – April 22 Category 1 cyclone 45 990 none none 0 16F April 20 – April 22 Tropical disturbance 25 1002 none none 0 17F April 26 – May 1 Tropical depression 30 1007 none none 0 18F April 29 – May 1 Tropical depression unk. 1006 none none 0 Season Aggregates 18 Disturbances October 28 – May 1 145 900 0 landfalls 55 0 See also
- List of Southern Hemisphere tropical cyclone seasons
- Atlantic hurricane seasons: 2004, 2005
- Pacific hurricane seasons: 2004, 2005
- Pacific typhoon seasons: 2004, 2005
- North Indian Ocean cyclone seasons: 2004, 2005
References
- ^ a b http://www.wmo.ch/web/www/TCP/OperationPlans/TCP24-English2004.pdf[dead link]
- ^ "Tropical Disturbance Summary 2004-10-28 21z". MT Archive. 2004-10-28. Archived from the original on 2009-05-16. http://mtarchive.geol.iastate.edu/2004/10/28/text/Severe/Severe.28. Retrieved 2009-04-06.
- ^ a b c Padgett, Gary (2004). "Monthly Global Tropical Cyclone Summary October 2004". Australian Severe Weather. Archived from the original on 2009-05-16. http://www.australiasevereweather.com/cyclones/2005/summ0410.htm. Retrieved 2009-04-06.
- ^ "Tropical Disturbance Summary 2004-10-28 21z". MT Archive. 2004-10-28. http://mtarchive.geol.iastate.edu/2004/10/28/text/Severe/Severe.28. Retrieved 2009-04-06.
- ^ "Tropical Disturbance Summary 2004-10-29". Fiji Meteorological Service. MT Archive. 2004-10-29. http://mtarchive.geol.iastate.edu/2004/10/29/text/Severe/Severe.29. Retrieved 2009-04-06.
- ^ "Tropical Disturbance Summary 2004-10-30". Fiji Meteorological Service. MT Archive. 2004-10-30. http://mtarchive.geol.iastate.edu/2004/10/30/text/Severe/Severe.30. Retrieved 2009-04-06.
- ^ a b c d e f g Gary Padgett (2004). "Gary Padgetts Monthly Global Tropical Cyclone Summary December 2004". Australian Severe Weather. Archived from the original on 2009-05-16. http://www.australiasevereweather.com/cyclones/2005/summ0412.htm. Retrieved 2009-04-06.
- ^ "Tropical Disturbance Summary 2004-12-05". Fiji Meteorological Service. MT Archive. 2004-12-05. Archived from the original on 2009-05-16. http://mtarchive.geol.iastate.edu/2004/12/02/text/Severe/Severe.02. Retrieved 2009-04-06.
- ^ Gary Padgett (2005). "Gary Padgett’s Monthly Global Tropical Cyclone Tracks December 2004". Australian Severe Weather. Archived from the original on 2009-05-16. http://www.australiasevereweather.com/cyclones/2005/trak0412.htm. Retrieved 2009-04-06.
- ^ a b "Tropical Cyclone Advisories issued on December 05, 2004". Fiji Meteorological Service. MT Archive. 2004-12-05. Archived from the original on 2009-05-16. http://mtarchive.geol.iastate.edu/2004/12/05/text/Severe/Severe.05. Retrieved 2009-04-06.
- ^ "Tropical Cyclone Advisories issued on December 7, 2004". Fiji Meteorological Service. MT Archive. 2004-12-06. http://mtarchive.geol.iastate.edu/2004/12/06/text/Severe/Severe.06. Retrieved 2009-04-06.
- ^ "Tropical Cyclone Advisories issued on December 7, 2004". Fiji Meteorological Service. MT Archive. 2004-12-07. http://mtarchive.geol.iastate.edu/2004/12/07/text/Severe/Severe.07. Retrieved 2009-04-06.
- ^ "Tropical Cyclone Advisories issued on December 8, 2004". Fiji Meteorological Service. MT Archive. 2004-12-08. http://mtarchive.geol.iastate.edu/2004/12/08/text/Severe/Severe.08. Retrieved 2009-04-06.
- ^ "Tropical Cyclone Advisories issued on December 09, 2004". Fiji Meteorological Service. MT Archive. 2004-12-09. http://mtarchive.geol.iastate.edu/2004/12/09/text/Severe/Severe.09. Retrieved 2009-04-06.
- ^ "Tropical Cyclone Advisories issued on December 10, 2004". Fiji Meteorological Service. MT Archive. 2004-12-10. http://mtarchive.geol.iastate.edu/2004/12/10/text/Severe/Severe.10. Retrieved 2009-04-06.
- ^ a b Waqaicelua, Alipate (2007-08-29). "Tropical Cyclone Summary 2004–2005 Season" (PDF). Fiji Meteorological Service. http://www.met.gov.fj/documents/TC_Seasonal_Summary_04-051190690498.pdf. Retrieved 2009-02-12.
- ^ "Summary of South Pacific and South Indian Ocean Tropical Cyclones". 2005 Annual Tropical Cyclone Report. Joint Typhoon Warning Center. http://www.usno.navy.mil/NOOC/nmfc-ph/RSS/jtwc/atcr/2005atcr/. Retrieved 2007-12-02.
- ^ Gary Padgett (2005-01-19). "Global Tropical Cyclone Tracks — January 2005". Typhoon2000.ph. http://www.typhoon2000.ph/garyp_mgtcs/jan05tks.txt. Retrieved 2007-12-02.
- ^ Gary Padgett (April 25, 2005). "Monthly Tropical Cyclone Summary for February 2005". Typhoon 2000. http://www.typhoon2000.ph/garyp_mgtcs/feb05sum.txt. Retrieved February 12, 2009.
- ^ Monthly Global Tropical Cyclone Summary February 2005
- ^ a b "Tropical Cyclone Advisories issued on on February 26, 2005". Fiji Meteorological Service. MT Archive. 2005-02-26. http://mtarchive.geol.iastate.edu/2005/02/26/text/Severe/Severe.26. Retrieved 2010-01-14.
- ^ a b c "Tropical cyclone Advisories issued on February 27, 2005". Fiji Meteorological Service. MT Archive. 2005-02-27. http://mtarchive.geol.iastate.edu/2005/02/27/text/Severe/Severe.27. Retrieved 2009-07-09.
- ^ "Tropical cyclone Advisories issued on February 28, 2005". Fiji Meteorological Service. MT Archive. 2005-02-28. http://mtarchive.geol.iastate.edu/2005/02/28/text/Severe/Severe.27. Retrieved 2009-07-09.[dead link]
- ^ "Tropical cyclone Advisories issued on March 01, 2005". Fiji Meteorological Service. MT Archive. 2005-03-01. http://mtarchive.geol.iastate.edu/2005/03/01/text/Severe/Severe.01. Retrieved 2009-07-09.
- ^ "Tropical cyclone Advisories issued on March 2, 2005". Fiji Meteorological Service. MT Archive. 2005-03-02. http://mtarchive.geol.iastate.edu/2005/03/02/text/Severe/Severe.02. Retrieved 2009-07-09.
- ^ a b c "Tropical cyclone Advisories issued on March 3, 2005". Fiji Meteorological Service. MT Archive. 2005-03-03. http://mtarchive.geol.iastate.edu/2005/03/03/text/Severe/Severe.03. Retrieved 2009-07-09.
- ^ "Gary Padgetts Monthly Global Tropical Cyclone Tracks March 2005". Australian Severe Weather. 2005. http://australiasevereweather.com/cyclones/2005/trak0503.htm. Retrieved 2009-07-09.
- ^ "Tropical cyclone Advisories issued on March 4, 2005". Fiji Meteorological Service. MT Archive. 2005-03-04. http://mtarchive.geol.iastate.edu/2005/03/04/text/Severe/Severe.04. Retrieved 2009-07-09.
- ^ "Tropical Cyclone Advisorys issued on 20-04-05". Fiji Meteorological Service. MT Archive. 2005-04-20. http://mtarchive.geol.iastate.edu/2005/04/20/text/Severe/Severe.20. Retrieved 2009-06-17.
- ^ "Tropical Cyclone Advisorys issued on 21-04-05". Fiji Meteorological Service. MT Archive. 2005-04-21. http://mtarchive.geol.iastate.edu/2005/04/21/text/Severe/Severe.21. Retrieved 2009-06-17.
- ^ "Tropical Cyclone Advisorys issued on 22-04-05". Fiji Meteorological Service. MT Archive. 2005-04-22. http://mtarchive.geol.iastate.edu/2005/04/22/text/Severe/Severe.20. Retrieved 2009-06-17.[dead link]
- ^ "Tropical Cyclone Advisories issued on April 26, 2005". Fiji Meteorological Service. MT Archive. 2005-04-26. http://mtarchive.geol.iastate.edu/2005/04/26/text/Severe/Severe.26. Retrieved 2009-06-17.
- ^ a b "Tropical Cyclone Advisories issued on April 27, 2005". Fiji Meteorological Service. MT Archive. 2005-04-27. http://mtarchive.geol.iastate.edu/2005/04/27/text/Severe/Severe.27. Retrieved 2009-06-17.
- ^ a b "Tropical cyclone advisories issued on April 29, 2005". Fiji Meteorological Service. 2005-04-29. http://mtarchive.geol.iastate.edu/2005/04/29/text/Severe/Severe.29. Retrieved 2009-06-17.
- ^ a b "Tropical Cyclone Advisories issued on April 30, 2005". Fiji Meteorological Service. 2005-04-30. http://mtarchive.geol.iastate.edu/2005/04/30/text/Severe/Severe.30. Retrieved 2009-06-17.
- ^ a b "Tropical Cyclone Advisories issued on May 1, 2005". Fiji Meteorological Service. 2005-05-01. http://mtarchive.geol.iastate.edu/2005/05/01/text/Severe/Severe.01. Retrieved 2009-06-17.
External links
- World Meteorological Organization
- Fiji Meteorological Service
- Meteorological Service of New Zealand
- Joint Typhoon Warning Center
Tropical cyclones of the 2004–05 South Pacific cyclone season
South Pacific Tropical Cyclone Scale TDI TDE 1 2 3 4 5  Book ·
  Category ·
  Portal ·
  WikiProject ·
  Commons
2000–09 South Pacific cyclone seasons


Wikimedia Foundation. 2010.