- Don Valley West (provincial electoral district)
-
Don Valley West  Ontario electoral district
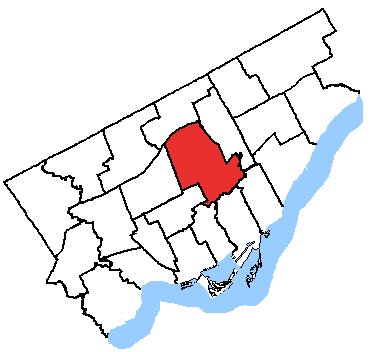
Don Valley West in relation to other Toronto electoral districts Provincial electoral district Legislature Legislative Assembly of Ontario MPP
Kathleen Wynne
LiberalDistrict created 1999 First contested 1999 Last contested 2011 Demographics Population (2006) 117,083 Electors (2007) 77,977 Area (km²) 37 Pop. density (per km²) 3,164.4 Census divisions Toronto Census subdivisions Toronto Don Valley West is a provincial electoral district in Toronto, Ontario, Canada. It elects one member to the Legislative Assembly of Ontario.
It was created in 1999 from parts of Don Mills, York Mills, York East and Eglinton.
When the riding was created, it included all of Metro Toronto within the following line: Highway 401 to Leslie Street to the CN Railway to Don Mills Road to the CP Railway to the East Branch of the Don River to East York/North York border the Don Valley Parkway to the Don River to Millwood Road to the CP Railway to the East York/North York border to the Old Toronto city limits to Broadway Avenue to Yonge Street.
Starting with the 2007 election, the southern border was altered so that it continues to follow the East Branch of the Don River to the main branch until Pottery Road to Bayview Avenue until the CP railway.
The riding was particularly notable in the 2007 election because John Tory, who at the time was leader of the Progressive Conservative Party of Ontario, was defeated by his Liberal opponent Kathleen Wynne.
Contents
Members of Provincial Parliament
Parliament Years Member Party 37th 1999–2003 David Turnbull Progressive Conservative 38th 2003–2007 Kathleen Wynne Liberal 39th 2007–2011 40th 2011- Election results
Ontario general election, 2011 Party Candidate Votes % ±% Liberal Kathleen Wynne 24,524 58.3 +7.9 Progressive Conservative Andrea Mandel-Campbell 12,828 30.6 -9.0 New Democrat Khalid Ahmed 3,611 8.6 +3.8 Green Louis Fliss 718 1.7 -3.1 Communist Dimitris Kabitsis 125 0.3 - Independent Rosemary Waigh 108 0.3 - Independent Soumen Deb 74 0.2 - Total valid votes 41,918 100.00 Note: the 2011 election was held on October 6, 2011.
Ontario general election, 2007 Party Candidate Votes % ±% Liberal Kathleen Wynne 23,059 50.44 -2.15 Progressive Conservative John Tory 18,136 39.67 +0.72 Green Adrian Walker 2,202 4.82 +2.05 New Democrat Mike Kenny 2,135 4.67 -1.02 Family Coalition Daniel Kidd 183 0.40 - Total valid votes 45,715 100.00 Ontario general election, 2003 Party Candidate Votes % ±% Liberal Kathleen Wynne 23,488 52.59 +8.97 Progressive Conservative David Turnbull 17,394 38.95 -11.57 New Democrat Ali Naqvi 2,540 5.69 +1.00 Green Philip Hawkins 1,239 2.77 - Total valid votes 44,661 100.00 Ontario general election, 1999 Party Candidate Votes % ±% Progressive Conservative David Turnbull 23,177 50.52 - Liberal Paul Davidson 20,008 43.62 - New Democrat Geoffrey Allen 2,152 4.69 - Independent Judith A. Snow 312 0.68 - Natural Law Debbie Weberg 224 0.49 - Total valid votes 45,873 100.00 2007 electoral reform referendum
Ontario electoral reform referendum, 2007 Side Votes % First Past the Post 27,967 62.9 Mixed member proportional 16,488 37.2 Total valid votes 44,455 100.0 Sources
Provincial ridings in Ontario Northern Eastern Glengarry—Prescott—Russell • Kingston and the Islands • Lanark—Frontenac—Lennox and Addington • Leeds—Grenville • Prince Edward—Hastings • Renfrew—Nipissing—Pembroke • Stormont—Dundas—South GlengarryCentral Barrie • Bruce—Grey—Owen Sound • Dufferin—Caledon • Durham • Haliburton—Kawartha Lakes—Brock • Newmarket—Aurora • Northumberland—Quinte West • Peterborough • Simcoe—Grey • Simcoe North • York—SimcoeMidwestern Brant • Cambridge • Guelph • Haldimand—Norfolk • Huron—Bruce • Kitchener Centre • Kitchener—Conestoga • Kitchener—Waterloo • Oxford • Perth—Wellington • Wellington—Halton HillsSouthwestern Chatham-Kent—Essex • Elgin—Middlesex—London • Essex • Lambton—Kent—Middlesex • London North Centre • London—Fanshawe • London West • Sarnia—Lambton • Windsor—Tecumseh • Windsor WestBrampton, Mississauga
& OakvilleHamilton, Burlington
& NiagaraAncaster—Dundas—Flamborough—Westdale • Burlington • Halton • Hamilton Centre • Hamilton East—Stoney Creek • Hamilton Mountain • Niagara Falls • Niagara West—Glanbrook • St. Catharines • WellandOttawa Carleton—Mississippi Mills • Nepean—Carleton • Ottawa Centre • Ottawa—Orléans • Ottawa South • Ottawa—Vanier • Ottawa West—NepeanSouth Durham, York Ajax—Pickering • Markham—Unionville • Oak Ridges—Markham • Oshawa • Pickering—Scarborough East • Richmond Hill • Thornhill • Vaughan • Whitby—OshawaToronto Beaches—East York • Davenport • Don Valley East • Don Valley West • Eglinton—Lawrence • Etobicoke Centre • Etobicoke—Lakeshore • Etobicoke North • Parkdale—High Park • Scarborough—Agincourt • Scarborough Centre • Scarborough—Guildwood • Scarborough—Rouge River • Scarborough Southwest • St. Paul's • Toronto Centre • Toronto—Danforth • Trinity—Spadina • Willowdale • York Centre • York South—Weston • York WestCategories:- Ontario provincial electoral districts
- Provincial electoral districts of Toronto
Wikimedia Foundation. 2010.