- Climate of Brazil
-
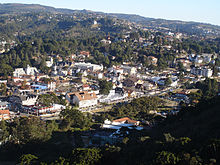 Subtropical highland climate in Campos do Jordão.
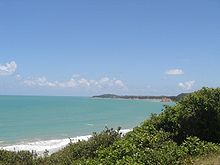
 Tropical climate in João Pessoa.
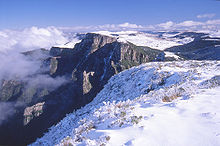 Subtropical climate in Santa Catarina.
The climate of Brazil varies considerably mostly from tropical North (the equator traverses the mouth of the Amazon) to temperate zones below the Tropic of Capricorn (23°27' S latitude), which crosses the country at the latitude of the city of São Paulo. Brazil has six climatic regions: tropical rainforest, tropical wet and dry, tropical monsoon, semiarid, humid subtropical and subtropical highland.
Temperatures along the equator are high, averaging above 25 °C (77 °F), but not reaching the summer extremes of up to 40°C (104°F) in the temperate zones. There is little seasonal variation near the equator, although at times it can get cool enough for wearing a jacket, especially in the rain.
At the country's other extreme, there are frosts south of the Tropic of Capricorn during the winter (June–August), and in some years there are snowfalls on the high plateau and mountainous areas of some regions. Snow falls more frequently in the states of Rio Grande do Sul, Santa Catarina, and Paraná and less frequently in the states of São Paulo, Rio de Janeiro, Minas Gerais, and Espírito Santo. Temperatures in the cities of Belo Horizonte and Brasília are moderate, usually between 15ºC (59°F) and 30°C (86°F), because of their elevation of approximately 1,000 meters (3,281 ft). Rio de Janeiro, Recife, and Salvador on the coast have warm climates, with average temperatures of each month ranging from 23 to 27 °C (73.4 to 80.6 °F), but enjoy constant trade winds. The cities of São Paulo, Curitiba, Florianópolis and Porto Alegre have a subtropical climate similar to that of southern United States, and temperatures can fall below freezing in winter.[1]
Precipitation levels vary widely. Most of Brazil has moderate rainfall of between 1,000 and 1,500 mm (39.4 and 59.1 in) a year, with most of the rain falling in the summer (between December and April) south of the Equator. The Amazon region is notoriously humid, with rainfall generally more than 2,000 mm (78.7 in) per year and reaching as high as 3,000 mm (118.1 in) in parts of the western Amazon and near Belém. It is less widely known that, despite high annual precipitation, the Amazon rain forest has a three- to five-month dry season, the timing of which varies according to location north or south of the equator.
High and relatively regular levels of precipitation in the Amazon contrast sharply with the dryness of the semiarid Northeast, where rainfall is scarce and there are severe droughts in cycles averaging seven years. The Northeast is the driest part of the country. The region also constitutes the hottest part of Brazil, where during the dry season between May and November, temperatures of more than 38 °C (100.4 °F) have been recorded. However, the sertão, a region of semidesert vegetation used primarily for low-density ranching, turns green when there is rain. Most of the Center-West has 1,500 to 2,000 mm (59.1 to 78.7 in) of rain per year, with a pronounced dry season in the middle of the year, while the South and most of the East is without a distinct dry season.
Contents
General Climate
Although most of Brazil lies in the tropics, more than 60 percent of the population live in areas which are cooled either by altitude, sea winds or polar fronts. While the coastal cities of Rio de Janeiro, Recife and Salvador can get extremely hot, plateau cities such as São Paulo, Brasília and Belo Horizonte have mild climates, and the southern cities of Porto Alegre and Curitiba have mild winters, but while Curitiba has a warm summer, Porto Alegre has a hot summer.
Despite the popular image of the Amazon as a region of blistering heat, temperatures of more than 32°C (90°F) are in fact rare. The annual average temperature in the region is 22-26°C (72-79°F), with not much variation between the warmest and the coldest months. The hottest part of Brazil is the northeast, where temperatures of more than 38°C (100°F) are frequently recorded during the dry season between May and November. Along the Atlantic coast from Recife to Rio de Janeiro, average temperatures range from 23 to 27°C (73-81°F). Inland, on higher ground, temperatures are lower, ranging from 18 to 21°C (64-70°F). South of Rio the seasons are more defined and the range of temperatures significantly wider, with the annual average falling between 17 and 19°C (63-66°F).
Brazil's most intense rain falls around the mouth of the Amazon near the city of Belém, and also in the upper regions of Amazonia where more than 2,000 millimetres (78 inches) of rain fall every year. Most of Brazil has moderate rainfall of between 1,000 and 1,500 millimetres (39 to 59 inches) a year, most of it coming between December and April. The driest part of the country is the northeast, where rainfall is irregular and the evaporation rate very high, making it difficult to grow crops.
Climate by region
Southeast Region
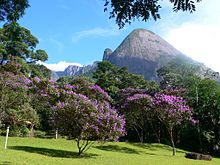 Southeast Region.
The latitudinal position around the Tropic of Capricorn, the very uneven topography and disturbed circulation systems greatly influence the climatology of the Southeast and it is quite diverse in temperature. The annual medium temperature ranges from 20 °C (68 °F) as seen on the border between São Paulo and Paraná to 24 °C (75 °F) in the north of Minas Gerais, while in the elevated areas of the Serra do Espinhaço, Serra da Mantiqueira and Serra do Mar the average medium temperature can be below 18 °C (64 °F) due to the combined effect of the latitude with the frequency of the polar currents.
In the summer, mainly in the month of January, the normal average temperatures range from 30 to 32 °C (86 to 90 °F) in the valleys of the rivers São Francisco and Jequitinhonha, in the Zona da Mata (Forest Zone) of Minas Gerais, in the coastal lowlands and to the west of the state of São Paulo.
In the winter, the normal average temperatures range from 6 to 20 °C (43 to 68 °F) with minimum absolute from -4 to 8 °C (25 to 46 °F), the lowest temperatures being at the highest elevations. Vast areas of Minas Gerais and São Paulo register occurrences of frosts, after the passage of the polar fronts.
As far as the incidence of rain is concerned, there are two areas with heavy precipitation: one following the coast and the Serra do Mar, where the rains are precipitated by the southerly currents; and the other from the west of Minas Gerais to the Municipal district of Rio de Janeiro, where the rains are brought by the Westerly system. The annual precipitation total in these areas is in excess of 1,500 mm (59.1 in). In the Serra da Mantiqueira these indexes surpass 1,750 mm (68.9 in), and at the summit of Itatiaia, 2,340 mm (92.1 in).
In the Serra do Mar, in São Paulo, it rains on the average more than 3,600 mm (141.7 in). Near Paranapiacaba and Itapanhaú maximum rainfall was measured at 4,457.8 mm (175.50 in) in one year. In the valleys of the rivers Jequitinhonha and Doce the smallest annual pluviometric indexes are recorded at around 900 mm (35.4 in).
The maximum pluviometric index of the Southeast area usually occurs in January and the minimum in July, while the dry period is usually concentrated in the winter, lasting six months in the case of the valleys of the rivers Jequitinhonha and São Francisco, to as little as two months in the Serra do Mar and Serra da Mantiqueira.
Charts of selected cities
São Paulo Climate chart (explanation) J F M A M J J A S O N D 239271821828181602718762516742313562212432212382313812414124241514526162012617Average max. and min. temperatures in °C Precipitation totals in mm Source: [1] Imperial conversion J F M A M J J A S O N D 9.481648.682646.38164377612.973552.272541.772541.573553.275574.975595.779617.97963Average max. and min. temperatures in °F Precipitation totals in inches Rio de Janeiro Climate chart (explanation) J F M A M J J A S O N D 11429231043023104292313728228627218125195626185126198625198926209727221702922Average max. and min. temperatures in °C Precipitation totals in mm Source: [2] Imperial conversion J F M A M J J A S O N D 4.584734.186734.184735.482723.481703.277662.27964279663.477663.579683.881726.78472Average max. and min. temperatures in °F Precipitation totals in inches Belo Horizonte Climate chart (explanation) J F M A M J J A S O N D 296281818828191632818612717282615152513152413132614412716124271722927183202718Average max. and min. temperatures in °C Precipitation totals in mm Source: [3] Imperial conversion J F M A M J J A S O N D 1282647.482666.482642.481631.179590.677550.675550.579571.681614.9816398164138164Average max. and min. temperatures in °F Precipitation totals in inches Vitória Climate chart (explanation) J F M A M J J A S O N D 14231238131231123123892922812821662719792618562619792619127272117028211962922Average max. and min. temperatures in °C Precipitation totals in mm Source: [4] Imperial conversion J F M A M J J A S O N D 5.688733.288734.488733.584723.282702.681663.179642.279663.17966581706.782707.78472Average max. and min. temperatures in °F Precipitation totals in inches Santos Climate chart (explanation) J F M A M J J A S O N D 28434222403422277312217732181512916112281410628139330151373017178321816233192263321Average max. and min. temperatures in °C Precipitation totals in mm Imperial conversion J F M A M J J A S O N D 1193729.49372118872790645.984614.482574.282553.786595.48663790646.491668.99170Average max. and min. temperatures in °F Precipitation totals in inches Northeast Region
 Northeast Region.
The climatic characterization of the Northeast area is a little complex, and the four systems of circulation that influence the region are denominated Systems of Disturbed Currents of South, North, East and West. The System of disturbed currents of South is represented by the polar masses that reach the area in the spring-summer, acts in the coastal areas until the south of Bahia, bringing frontal and back-frontals rains. In the winter the polar masses reach even the coast of Pernambuco, while the hinterlands regions remain under the influence of the tropical mass.
The system of disturbed currents of North, represented by Convergence Intertropical (CIT), produces rain from the summer to the autumn even in Pernambuco, in the vicinity of the Raso da Catarina. On the other hand, the currents of the East are more frequent in the winter and they usually produce abundant rains in the coastal regions, rarely reaching the scarps of the Plateau of Borborema (800 m/2,625 ft) and of Chapada Diamantina (1,200 m/3,937 ft).
Finally, the system of currents of the West, brought by the lines of Tropical Instability (IT), occur from the end of spring to the beginning of autumn, rarely reaching the states of Piauí and Maranhão.
Temperatures are high, with annual averages between 20 and 28 °C (68 and 82.4 °F), maximums of around 40 °C (104 °F) having been observed in the south of Maranhão and Piauí. The months of winter, mainly June and July, produce minimum temperatures between 12 and 16 °C (53.6 and 60.8 °F) in the coastal regions, much lower in the plateau regions where temperatures of 1 °C (33.8 °F) have been recorded in Chapada Diamantina after the passage of a polar front.
The pluviosity of the area is complex and is source of concern: its annual totals vary from 2,000 mm (78.7 in) to values even lower than 500 mm (19.7 in), as verified in the Raso da Catarina, between Bahia and Pernambuco, and in the depression of Patos in Paraíba. In a general way, the annual medium precipitation in the northeast area is lower than 1,000 mm (39.4 in) - in the city of Cabaceiras, interior of Paraíba, was observed the smallest annual pluviometric index registered in Brazil, 278 mm (10.9 in)/year. Besides it in the interior of this area the rainy period is usually of just two months in the year, sometimes not coming in some years, causing then the denominated regional droughts.
Charts of selected cities
Salvador Climate chart (explanation) J F M A M J J A S O N D 112292312230241453024220282323127232512622203262113726211122722122282211929231322923Average max. and min. temperatures in °C Precipitation totals in mm Source: [5] Imperial conversion J F M A M J J A S O N D 4.484734.886755.786758.782739.181739.97972879705.479704.481724.882724.784735.28473Average max. and min. temperatures in °F Precipitation totals in inches Fortaleza Climate chart (explanation) J F M A M J J A S O N D 130302421630233192923356292322629231602922912922302922232923153024133124513124Average max. and min. temperatures in °C Precipitation totals in mm Source: [6] Imperial conversion J F M A M J J A S O N D 5.186758.586731384731484738.984736.384723.684721.284720.984730.686750.5887528875Average max. and min. temperatures in °F Precipitation totals in inches Recife Climate chart (explanation) J F M A M J J A S O N D 104302214530222593022312292239029223922821304272121327211222821682921483022663022Average max. and min. temperatures in °C Precipitation totals in mm Source: [7] Imperial conversion J F M A M J J A S O N D 4.186725.786721086721284721584721582701281708.481704.882702.784701.986722.68672Average max. and min. temperatures in °F Precipitation totals in inches South Region
 South Region.
The South region is located below the Tropic of Capricorn, in a temperate zone. It is influenced by the system of disturbed circulation of the South, which produces the rains, mainly in the summer. It is also influenced by the system of disturbed circulation of the West, that brings rains and storms, sometimes hail, producing winds with bursts of 60 to 90 km/h (37.3 to 55.9 mph). Regarding temperatures: the winter is mild and the summer is hot. The annual medium temperatures range from 14 to 22 °C (57.2 to 71.6 °F), and in places with altitudes above 1,100 m (3,609 ft), drops to approximately 10 °C (50 °F). Some parts of the southern region also have an oceanic climate.
In the summer, mainly in January, in the valleys of the rivers Paranapanema, Paraná and Ibicuí-Jacuí, the medium temperature is in excess of 24 °C (75.2 °F), and the medium temperature of the river Uruguay surpasses 26 °C (78.8 °F). The average maximum temperature stays around 24 to 27 °C (75.2 to 80.6 °F) on the elevated surfaces of the plateau and, in the lowest areas, between 30 and 32 °C (86 and 89.6 °F).
In the winter, mainly in July, the medium temperature stays relatively low, oscillating between 10 and 15 °C (50 and 59 °F), except for the valleys of the rivers Paranapanema and Paraná, besides the coast of Paraná and Santa Catarina, where the averages are approximately 15 to 18 °C (59 to 64.4 °F). The average maximum temperature is also low, around 20 to 24 °C (68 to 75.2 °F), in the big valleys and in the coast, and 16 to 20 °C (60.8 to 68 °F) in the plateau region. The average minimum temperature varies from 6 to 12 °C (42.8 to 53.6 °F) , and the thermometer frequently registers temperatures near 0|ºC, sometimes even reaching negative indexes, accompanied by frost and snow, in consequence of the invasion of polar masses.
The annual medium pluviosity oscillates from 1,250 to 2,000 mm (49.2 to 78.7 in), except along the coast of Paraná and west of Santa Catarina, where the values are in excess of 2,000 mm (78.7 in), and in the north of Paraná and in a small coastal area of Santa Catarina, which have lower recordings down to 1,250 mm (49.2 in). The maximum pluviometric indexes occur in the winter and the minimum in the summer throughout almost the whole area.
Charts of selected cities
Porto Alegre Climate chart (explanation) J F M A M J J A S O N D 993020109302110428198625169422131321911122191114020111402213114241510427171022919Average max. and min. temperatures in °C Precipitation totals in mm Source: [8] Imperial conversion J F M A M J J A S O N D 3.986684.386704.182663.477613.772555.266524.866525.568525.572554.575594.1816348466Average max. and min. temperatures in °F Precipitation totals in inches Florianópolis Climate chart (explanation) J F M A M J J A S O N D 1752821198282218527219725189723167621139420129121141272115127231713024181472620Average max. and min. temperatures in °C Precipitation totals in mm Source: [9] Imperial conversion J F M A M J J A S O N D 6.982707.882727.381703.877643.87361370553.768543.6705757059573635.175645.87968Average max. and min. temperatures in °F Precipitation totals in inches Curitiba Climate chart (explanation) J F M A M J J A S O N D 1652616142261612724158922139921109918889198742191142111135221212424141502515Average max. and min. temperatures in °C Precipitation totals in mm Source: [10] Imperial conversion J F M A M J J A S O N D 6.579615.67961575593.572553.970503.964463.566462.970484.570525.372544.975575.97759Average max. and min. temperatures in °F Precipitation totals in inches Vacaria Climate chart (explanation) J F M A M J J A S O N D 1702414170241514023141142011130178132167142167165177165188145201012422111302313Average max. and min. temperatures in °C Precipitation totals in mm Source: [11] Imperial conversion J F M A M J J A S O N D 6.775576.775595.573574.568525.163465.261455.661456.563456.564465.768504.972525.17355Average max. and min. temperatures in °F Precipitation totals in inches São Joaquim Climate chart (explanation) J F M A M J J A S O N D 16823131602313132221210718911216711914614014617016617017715219813521101302212Average max. and min. temperatures in °C Precipitation totals in mm Source: [12] Imperial conversion J F M A M J J A S O N D 6.673556.373555.272544.264484.461454.757435.557436.761436.76345666465.370505.17254Average max. and min. temperatures in °F Precipitation totals in inches Caxias do Sul Climate chart (explanation) J F M A M J J A S O N D 145261715226172062416132221210919111521781551781781892031910173211214023131702615Average max. and min. temperatures in °C Precipitation totals in mm Source: [13] Imperial conversion J F M A M J J A S O N D 5.77963679638.175615.272544.36652663466.1634676448866506.870545.573556.77959Average max. and min. temperatures in °F Precipitation totals in inches North Region
 North Region.
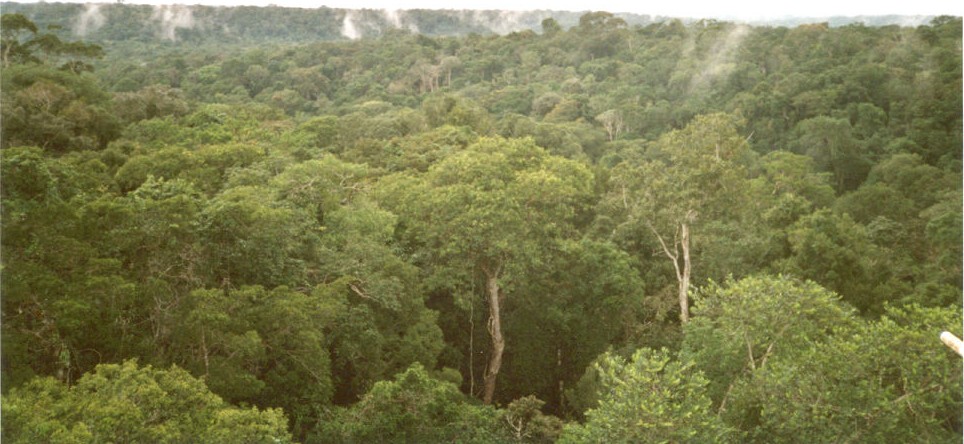
The north area of Brazil embraces a great part of the Amazon Basin, representing the largest extension of hot and humid forest on the planet. The area is cut, of an end to the other, by Ecuador and is characterized by low altitudes (0 to 200 m/0 to 656 ft). There are four main systems of atmospheric circulation that act in the area, they are: system of winds of Northeast (NE) to East (E) of the Atlantic South and Azores, subtropical anticyclones, generally stable in nature; system of winds of West (W) of the mass equatorial continental (mEc); system of winds of North (N) of the Convergence Intertropical (CIT); and system of winds of South (S) of the Polar anticyclone. These last three systems are responsible for variability of the climate and for the rains in the area. With regard to temperatures, the climate is hot, with annual medium temperatures ranging from
24 to 26 °C (75.2 to 78.8 °F).Regarding the pluviosity, there is not a homogeneity as it occur with the temperature. In the mouth of the river Amazonas, in the coast of Pará and in the western section of the area, the total annual pluviometric index exceeds 3,000 mm (118.1 in) in general. In the direction NO-SE, of Roraima to east of Pará there is less rain, with annual totals in the order of 1,500 to 1,700 mm (59.1 to 66.9 in).
The rainy period of the area occurs in summer & autumn, the exception being Roraima and of the north part of Amazonas, where the maximum pluviometric indexes occurs in winter, due to influence of the climatic conditions of the Northern Hemisphere.
Middle-West Region
Three systems of circulation occur in the Middle-West region: the system of disturbed currents of the West, represented by unstable events during the summer; system of disturbed currents of the North, represented by Convergence Intertropical (CIT), that produces rains in the summer, autumn and winter in the north of the region; and the system of disturbed currents of the South, represented by the polar fronts, invading the area in the winter with great frequency, producing rains of one to three days duration. In the north and south extremes of the region, the annual medium temperature is 22 °C (71.6 °F) and in the Chapadas it varies from 20 to 22 °C (68 to 71.6 °F). In the spring and summer, temperatures are commonly high, the average of the hottest month varying from 24 to 26 °C (75.2 to 78.8 °F). The average of the maximum temperatures of September (hotter month) oscillates between 30 and 36 °C (86 and 96.8 °F).
The people of the westwinter is an interesting season, low temperatures occurring quite frequently. This is caused by the polar invasion, that produces the cold weather which is very common at this time of the year. The medium temperature of the coldest month oscillates between 15 and 24 °C (59 and 75.2 °F), and the average of the minimum temperatures ranges from 8 to 18 °C (46.4 to 64.4 °F). Minimum temperatures are sometimes negative.
The characterization of the pluviosity of the region is almost exclusively due to the system of atmospheric circulation. The annual medium pluviosity varies from 2,000 to 3,000 mm (78.7 to 118.1 in) in the north of Mato Grosso, to 1,250 mm (49.2 in) in the Pantanal mato-grossense.
In spite of this inequality, the region is well provided with rain. Its seasonality is typically tropical, with maximum in the summer and minimum in the winter. More than 70% of the total rain that is accumulated during the year falls from November to March. The winter is excessively dry, because the rains are very rare.
References
2. http://www.brazil.org.uk/brazilinbrief/climate.html
See also
 Brazil
History First inhabitants · Colonization · Empire · Old Republic · Vargas Era · Second Republic · Military rule · ContemporaryGeography Regions · States · Mesoregions · Microregions · Municipalities · Islands · Coastline · Climate · Environment · Extreme points · Protected areas · CapitalsGovernment Constitution · Federal government · President · National Congress · Foreign relations · Law · Law enforcement · MilitaryPolitics Economy Society Demographics · People · Languages · Religion · Immigration · Education · Health · Crime · Social issues · Largest cities · ApartheidCulture  Category ·
  Portal ·
  WikiProject
Climate of South America Sovereign states Dependencies and
other territories- Aruba
- Bonaire
- Curaçao
- Falkland Islands
- French Guiana
- South Georgia and the South Sandwich Islands
Categories:


Wikimedia Foundation. 2010.