- Color rendering index
-
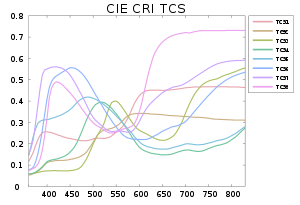
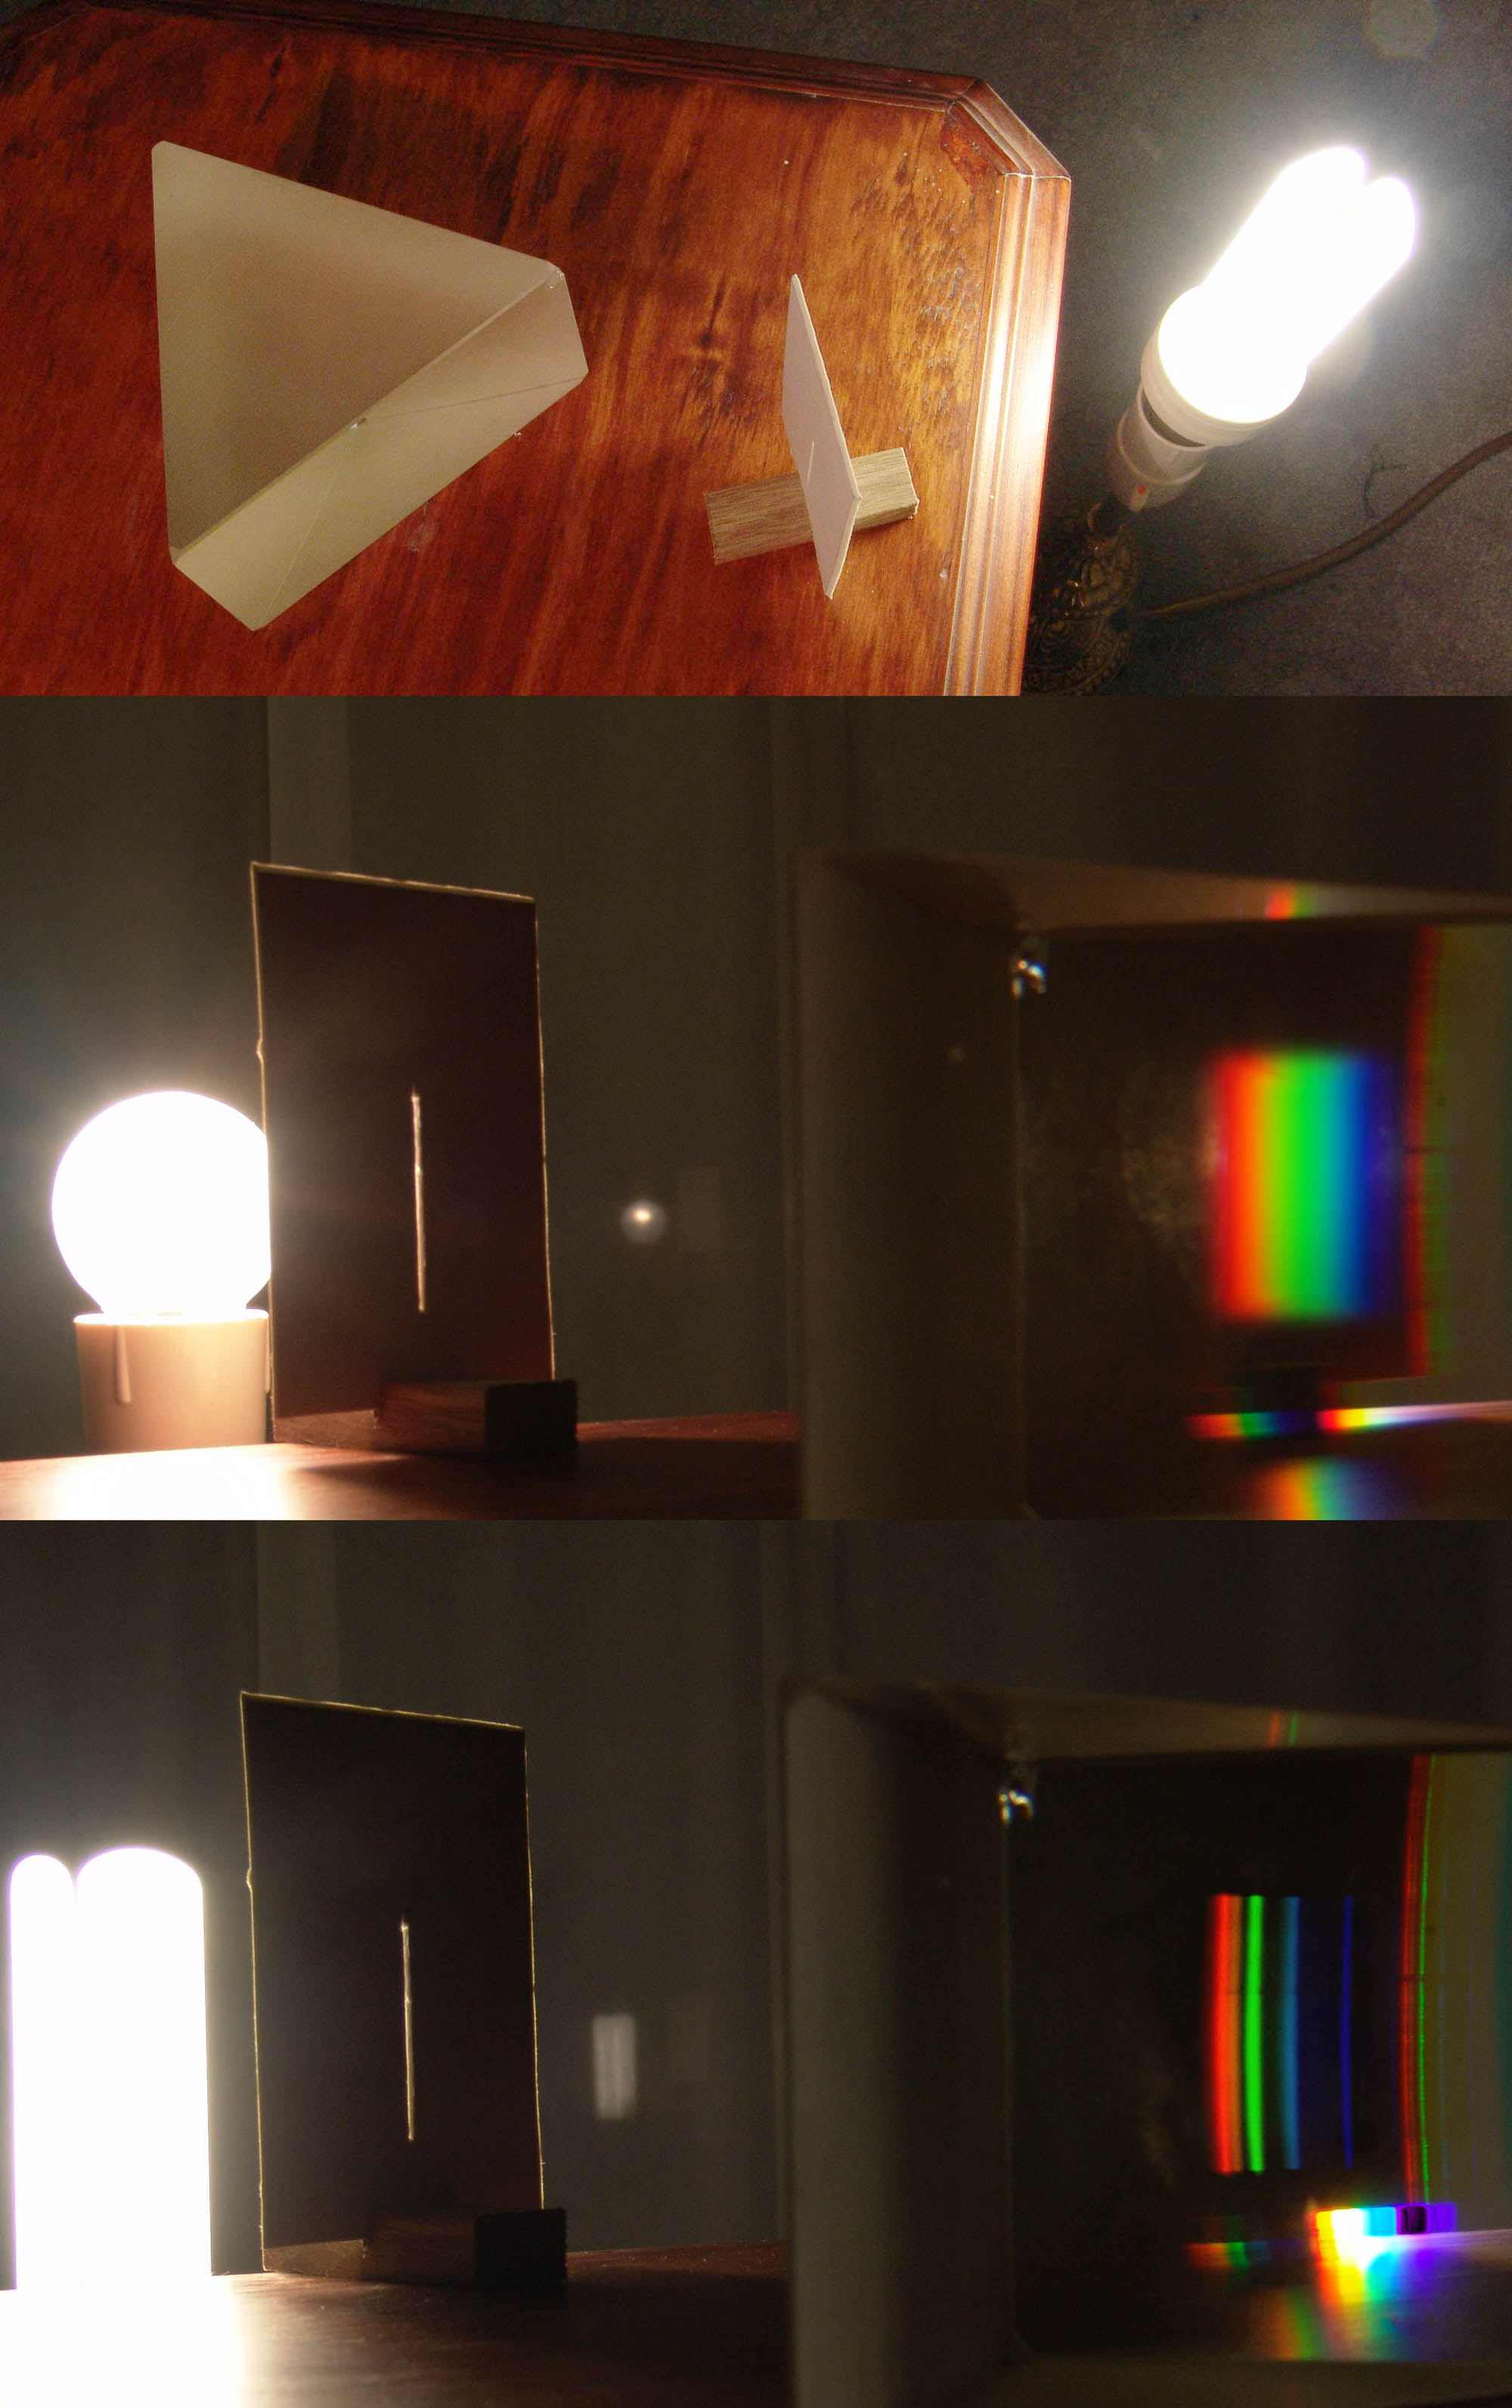
 Emitted light spectrum determines the color rendering index of the lamp.
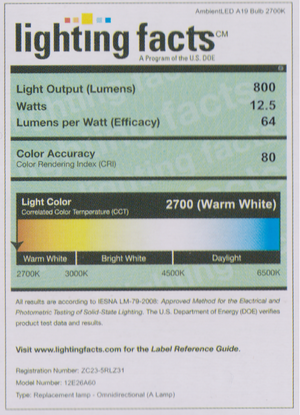 Color rendering index shown as Color Accuracy.
The color rendering index (CRI) (sometimes called color rendition index), is a quantitative measure of the ability of a light source to reproduce the colors of various objects faithfully in comparison with an ideal or natural light source. Light sources with a high CRI are desirable in color-critical applications such as photography and cinematography.[1] It is defined by the International Commission on Illumination as follows:[2]
Color rendering: Effect of an illuminant on the color appearance of objects by conscious or subconscious comparison with their color appearance under a reference illuminant
The CRI of a light source does not indicate the apparent color of the light source; that information is under the rubric of the correlated color temperature (CCT).
CRI's ability to predict color appearance has been criticized in favor of measures based on color appearance models, such as CIECAM02 and, for daylight simulators, the CIE Metamerism Index.[3] CRI is not a good indicator for use in visual assessment, especially for sources below 5000 Kelvin (K).[4][5]
A newer version of the CRI, R96a, has been developed, but it has not replaced the better-known Ra general color rendering index.[citation needed]
Contents
History
Researchers use daylight as the benchmark to which to compare color rendering of electric lights. In 1948, Bouma described daylight as the ideal source of illumination for good color rendering because "it (daylight) displays (1) a great variety of colours, (2) makes it easy to distinguish slight shades of colour, and (3) the colours of objects around us obviously look natural."[6]
Around the middle of the 20th century, color scientists took an interest in assessing the ability of artificial lights to accurately reproduce colors. European researchers attempted to describe illuminants by measuring the spectral power distribution (SPD) in "representative" spectral bands, whereas their North American counterparts studied the colorimetric effect of the illuminants on reference objects.[7]
The CIE assembled a committee to study the matter and accepted the proposal to use the latter approach, which has the virtue of not needing spectrophotometry, with a set of Munsell samples. Eight samples of varying hue would be alternately lit with two illuminants, and the color appearance compared. Since no color appearance model existed at the time, it was decided to base the evaluation on color differences in a suitable color space, CIEUVW. In 1931, the CIE adopted the first formal system of colorimetry, which is based the tri-chromatic nature of the human visual system.[8][9] CRI is based upon this system of colorimetry.[10]
To deal with the problem of having to compare light sources of different correlated color temperatures (CCT), the CIE settled on using a reference black body with the same color temperature for lamps with a CCT of under 5000 K, or a phase of CIE standard illuminant D (daylight) otherwise. This presented a continuous range of color temperatures to choose a reference from. Any chromaticity difference between the source and reference illuminants were to be abridged with a von Kries-type chromatic adaptation transform.
Test method
The CRI is calculated by comparing the color rendering of the test source to that of a "perfect" source which is a black body radiator for sources with correlated color temperatures under 5000 K, and a phase of daylight otherwise (e.g. D65). Chromatic adaptation should be performed so that like quantities are compared. The Test Method (also called Test Sample Method or Test Color Method) needs only colorimetric, rather than spectrophotometric, information.[5][11]
 CIE 1960 UCS. Planckian locus and co-ordinates of several illuminants shown in illustration below.
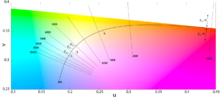 (u,v) chromaticity diagram with several CIE illuminants.
- Using the 2° standard observer, find the chromaticity co-ordinates of the test source in the CIE 1960 color space.[12]
- Determine the correlated color temperature (CCT) of the test source by finding the closest point to the Planckian locus on the (u,v) chromaticity diagram.
- If the test source has a CCT<5000 K, use a black body for reference, otherwise use CIE standard illuminant D. Both sources should have the same CCT.
- Ensure that the chromaticity distance (DC) of the test source to the Planckian locus is under 5.4×10⁻³ in the CIE 1960 UCS. This ensures the meaningfulness of the result, as the CRI is only defined for light sources that are approximately white.[13]

- Illuminate the first eight standard samples, from the fifteen listed below, alternately using both sources.
- Using the 2° standard observer, find the chromaticity co-ordinates of the light reflected by each sample in the CIE 1964 color space.
- Chromatically adapt each sample by a von Kries transform.
- For each sample, calculate the Euclidean distance ΔEi between the pair of co-ordinates.
- Calculate the special (i.e., particular) CRI using the formula Ri = 100 − 4.6ΔEi[14][15]
- Find the general CRI (Ra) by calculating the arithmetic mean of the special CRIs.
Note that the last three steps are equivalent to finding the mean color difference,
 and using that to calculate Ra:
Chromatic adaptation
 Chromatic adaptation of TCSs lit by CIE FL4 (short, black vectors, to indicate before and after) to a black body of 2940 K (cyan circles).
CIE (1995) uses this von Kries chromatic transform equation to find the corresponding color (uc,i,vc,i) for sample i:


where subscripts r and t refer to reference and test light sources, respectively.
Test color samples
Name Appr. Munsell Appearance under daylight Swatch TCS01 7,5 R 6/4 Light greyish red TCS02 5 Y 6/4 Dark greyish yellow TCS03 5 GY 6/8 Strong yellow green TCS04 2,5 G 6/6 Moderate yellowish green TCS05 10 BG 6/4 Light bluish green TCS06 5 PB 6/8 Light blue TCS07 2,5 P 6/8 Light violet TCS08 10 P 6/8 Light reddish purple TCS09 4,5 R 4/13 Strong red TCS10 5 Y 8/10 Strong yellow TCS11 4,5 G 5/8 Strong green TCS12 3 PB 3/11 Strong blue TCS13 5 YR 8/4 Light yellowish pink TCS14 5 GY 4/4 Moderate olive green (leaf) As specified in CIE (1995), the original test color samples (TCS) are taken from an early edition of the Munsell Atlas. The first eight samples, a subset of the eighteen proposed in Nickerson (1960), are relatively low saturated colors and are evenly distributed over the complete range of hues.[16] These eight samples are employed to calculate the general color rendering index Ra. The last six samples provide supplementary information about the color rendering properties of the light source; the first four for high saturation, and the last two as representatives of well-known objects. The reflectance spectra of these samples may be found in CIE (2004),[17] and their approximate Munsell notations are listed aside.[18]
R96a method
In the CIE's 1991 Quadrennial Meeting, Technical Committee 1-33 (Color Rendering) was assembled to work on updating the color rendering method, as a result of which the R96a method was developed. The committee was dissolved in 1999, releasing CIE (1999), but no firm recommendations, partly due to disagreements between researchers and manufacturers.[19]
The R96a method has a few distinguishing features:[20]
- A new set of test color samples
- Six reference illuminants: D65, D50, black bodies of 4200 K, 3450 K, 2950 K, and 2700 K.
- A new chromatic adaptation transform: CIECAT94.
- Color difference evaluation in CIELAB.
- Adaptation of all colors to D65 (since CIELAB is well-tested under D65).
It is conventional to use the original method; R96a should be explicitly mentioned if used.
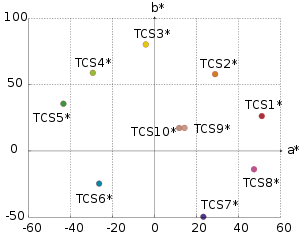
New test color samples
TCS01* TCS02* TCS03* TCS04* TCS05* TCS06* TCS07* TCS08* TCS09* TCS10* L* 40.9 61.1 81.6 72.0 55.7 51.7 30.0 51.0 68.7 63.9 a* 51.0 28.8 −4.2 −29.4 −43.4 −26.4 23.2 47.3 14.2 11.7 b* 26.3 57.9 80.3 58.9 35.6 −24.6 −49.6 −13.8 17.4 17.3 As discussed in Schanda & Sándor (2005), CIE (1999) recommends the use of a ColorChecker chart owing to the obsolescence of the original samples, of which only metameric matches remain.[21] In addition to the eight ColorChart samples, two skin tone samples are defined (TCS09* and TCS10*). Accordingly, the updated general CRI is averaged over ten samples, not eight as before. Nevertheless, Hung (2002) has determined that the patches in CIE (1995) give better correlations for any color difference than the ColorChecker chart, whose samples are not equally distributed in a uniform color space.
Example
The CRI can also be theoretically derived from the SPD of the illuminant and samples since physical copies of the original color samples are difficult to find. In this method, care should be taken to use a sampling resolution fine enough to capture spikes in the SPD. The SPDs of the standard test colors are tabulated in 5 nm increments CIE (2004), so it is suggested to use interpolation up to the resolution of the illuminant's spectrophotometry.
Starting with the SPD, let us verify that the CRI of reference illuminant F4 is 51. The first step is to determine the tristimulus values using the 1931 standard observer. Calculation of the inner product of the SPD with the standard observer's color matching functions (CMFs) yields (X,Y,Z)=(109.2,100.0,38.9) (after normalizing for Y=100). From this follow the xy chromaticity values:
 The tight isotherms are from 2935K–2945K. FL4 marked with a cross.

The next step is to convert these chromaticities to the CIE 1960 UCS in order to be able to determine the CCT:


 Relative SPD of FL4 and a black body of equal CCT. Not normalized.
Examining the CIE 1960 UCS reveals this point to be closest to 2938 K on the Planckian locus, which has a co-ordinate of (0.2528, 0.3484). The distance of the test point to the locus is under the limit (5.4×10⁻³), so we can continue the procedure, assured of a meaningful result:

We can verify the CCT by using McCamy's approximation algorithm to estimate the CCT from the xy chromaticities:
CCTest. = − 449n3 + 3525n2 − 6823.3n + 5520.33, where
 .
.Substituting (x,y) = (0.4402,0.4031) yields n=0.4979 and CCTest. = 2941 K, which is close enough. (Robertson's method can be used for greater precision, but we will be content with 2940 K in order to replicate published results.) Since 2940 < 5000, we select a Planckian radiator of 2940 K as the reference illuminant.
The next step is to determine the values of the test color samples under each illuminant in the CIEUVW color space. This is done by integrating the product of the CMF with the SPDs of the illuminant and the sample, then converting from CIEXYZ to CIEUVW:
Illuminant TCS1 TCS2 TCS3 TCS4 TCS5 TCS6 TCS7 TCS8 Reference U 39.22 17.06 −13.94 −40.83 −35.55 −23.37 16.43 44.64 V 2.65 9.00 14.97 7.88 −2.86 −13.94 −12.17 −8.01 W 62.84 61.08 61.10 58.11 59.16 58.29 60.47 63.77 CIE FL4 U 26.56 10.71 −14.06 −27.45 −22.74 −13.99 9.61 25.52 V 3.91 11.14 17.06 9.42 −3.40 −17.40 −15.71 10.23 W 63.10 61.78 62.30 57.54 58.46 56.45 59.11 61.69 CIE FL4
(CAT)U 26.34 10.45 −14.36 −27.78 −23.10 −14.33 9.37 25.33 V 4.34 11.42 17.26 9.81 −2.70 −16.44 −14.82 −9.47 W 63.10 61.78 62.30 57.54 58.46 56.45 59.11 61.69 From this we can calculate the color difference between the chromatically adapted samples (labeled "CAT") and those illuminated by the reference. (The Euclidean metric is used to calculate the color difference in CIEUVW.) The special CRI is simply Ri = 100 − 4.6ΔEUVW.
TCS1 TCS2 TCS3 TCS4 TCS5 TCS6 TCS7 TCS8 ΔEUVW 12.99 7.07 2.63 13.20 12.47 9.56 7.66 19.48 Ri 40.2 67.5 87.9 39.3 42.6 56.0 64.8 10.4 Finally, the general color rendering index is mean of the special CRI's: 51.
 The cyan circles indicate the TCS under the reference illuminant. The short, black, vectors indicate the TCS under the test illuminant, before and after chromatic adaptation transformation (CAT). (The vectors are short because the white points are close.) The post-CAT end of the vector lies NW, mirroring the chromaticity vector between the reference and test illuminants.
The special CRIs are reflected in the length of the dotted lines linking the chromaticities of the samples under the reference and chromatically adapted test illuminants, respectively. Short distances, as in the case of TCS3, result in a high special CRI (87.9), whereas long distances, as in the case of TCS8, result in a low special CRI (10.4). In simpler terms, TCS3 reproduces better under FL4 than does TCS8 (relative to a black body).Typical values
Light source CCT (K) CRI Low-pressure sodium (LPS/SOX) 1800 ~5 Clear mercury-vapor 6410 17 High-pressure sodium (HPS/SON) 2100 24 Coated mercury-vapor 3600 49 Halophosphate warm-white fluorescent 2940 51 Halophosphate cool-white fluorescent 4230 64 Tri-phosphor warm-white fluorescent 2940 73 Halophosphate cool-daylight fluorescent 6430 76 "White" SON 2700 82 Quartz metal halide 4200 85 Tri-phosphor cool-white fluorescent 4080 89 Ceramic metal halide 5400 96 Incandescent/halogen bulb 3200 100 A reference source, such as blackbody radiation, is defined as having a CRI of 100. This is why incandescent lamps have that rating, as they are, in effect, almost blackbody radiators. The best possible faithfulness to a reference is specified by a CRI of one hundred, while the very poorest is specified by a CRI of zero. A high CRI by itself does not imply a good rendition of color, because the reference itself may have an imbalanced SPD if it has an extreme color temperature.
Criticism and resolution
Ohno (2006) and others have criticized CRI for not always correlating well with subjective color rendering quality in practice, particularly for light sources with spiky emission spectra such as fluorescent lamps or white LEDs. Another problem is that the CRI is discontinuous at 5000 K,[22] because the chromaticity of the reference moves from the Planckian locus to the CIE daylight locus. Davis & Ohno (2006) identify several other issues, which they address in their Color Quality Scale (CQS):
- The color space in which the color distance is calculated (CIEUVW) is obsolete and nonuniform. Use CIELAB or CIELUV instead.
- The chromatic adaptation transform used (Von Kries transform) is inadequate. Use CMCCAT2000 or CIECAT02 instead.
- Calculating the arithmetic mean of the errors diminishes the contribution of any single large deviation. Two light sources with similar CRI may perform significantly differently if one has a particularly low special CRI in a spectral band that is important for the application. Use the root mean square deviation instead.
- The metric is not perceptual; all errors are equally weighted, whereas humans favor certain errors over others. A color can be more saturated or less saturated without a change in the numerical value of ∆Ei, while in general a saturated color is experienced as being more attractive.
- A negative CRI is difficult to interpret. Normalize the scale from 0 to 100 using the formula
![R_{out}=10 \ln \left[\exp(R_{in}/10)+1\right]](b/6fb35d41213612384ef81dcf0d0ebfaa.png)
- The CRI can not be calculated for light sources that do not have a CCT (non-white light).
- Eight samples are not enough since manufacturers can optimize the emission spectra of their lamps to reproduce them faithfully, but otherwise perform poorly. Use more samples (they suggest fifteen for CQS).
- The samples are not saturated enough to pose difficulty for reproduction.
- CRI merely measures the faithfulness of any illuminant to an ideal source with the same CCT, but the ideal source itself may not render colors well if it has an extreme color temperature, due to a lack of energy at either short or long wavelengths (i.e., it may be excessively blue or red). Weight the result by the ratio of the gamut area of the polygon formed by the fifteen samples in CIELAB for 6500 K to the gamut area for the test source. 6500 K is chosen for reference since it has a relatively even distribution of energy over the visible spectrum and hence high gamut area. This normalizes the multiplication factor.
Another notable attempt to improve the flaws found in CRI has been in the development in the Gamut Area Index.[23] Rea and Freyssinier have shown that GAI is better than CRI at predicting color discrimination on standardized Farnsworth-Munsell 100 Hue Tests and that GAI is predictive of color saturation.[24] Proponents of using GAI claim that, when used in conjunction with CRI, this method of evaluating color rendering is preferred by test subjects over light sources that have high values of only one measure. Researchers recommend a lower and an upper limit to GAI. Use of LED technology has called for a new way to evaluate color rendering because of the unique spectrum of light created by these technologies. Preliminary tests have shown that the combination of GAI and CRI used together is a preferred method for evaluating color rendering.[25][26]
Pousset, Obein & Razet (2010) developed a psychophysical experiment in order to evaluate light quality of LED lightings. It is based on colored samples used in the "Color Quality Scale". Predictions of the CQS and results from visual measurements were compared.
CIE (2007) "reviews the applicability of the CIE color rendering index to white LED light sources based on the results of visual experiments." Chaired by Davis, CIE TC 1-69(C) is currently investigating "new methods for assessing the color rendition properties of white-light sources used for illumination, including solid-state light sources, with the goal of recommending new assessment procedures ... by March, 2010."[27]
For a comprehensive review of alternative color rendering indexes see Guo & Houser (2004).
Smet (2011) reviewed several alternative quality metrics and compared their performance based on visual data obtained in 9 psychophysical experiments. It was found that a geometric mean of the GAI index and the CIE Ra correlated best with naturalness (r=0.85), while a color quality metric based on memory colors (MCRI[28]) correlated best for preference (r=0.89). The differences in performance of these metrics with the other tested metrics (CIE Ra; CRI-CAM02UCS; CQS; RCRI; GAI; geomean(GAI, CIE Ra); CSA; Judd Flattery; Thornton CPI; MCRI) were found to be statistically significant with p<0.0001. [29].
Film and video high-CRI LED lighting incompatibility
Problems have been encountered attempting to use otherwise high CRI LED lighting on film and video sets. The color spectra of LED lighting primary colors does not match the expected color wavelength bandpasses of film emulsions and digital sensors. As a result, color rendition can be completely unpredictable in optical prints, transfers to digital media from film (DI's), and video camera recordings. This phenomenon with respect to motion picture film has been documented in an LED lighting evaluation series of tests produced by the Academy of Motion Picture Arts and Sciences scientific staff.[30]
References
- ^ "Compare these images of a color chart taken under one light source with CRI 70 and another with CRI 85". Lightingdesignlab.com. http://www.lightingdesignlab.com/articles/cri/cribig.htm. Retrieved 2009-04-16.
- ^ "CIE 17.4-1987 International Lighting Vocabulary". http://www.cie.co.at/publ/abst/17-4-89.html.
- ^ Schanda, János; Sándor, Norbert (2005), "Visual colour rendering based on colour difference evaluations", Lighting Research and Technology 38 (3): 225–239, doi:10.1191/1365782806lrt168oa. A conference version of this article can be accessed for free: Schanda, János; Sándor, Norbert (2005), "Visual colour-rendering experiments", AIC Colour '05: 10th Congress of the International Colour Association, pp. 511–514, http://www.knt.vein.hu/staff/schandaj/SJCV-Publ-2005/521.pdf
- ^ Guo, Xin; Houser, Kevin W. (2004), "A review of colour rendering indices and their application to commercial light sources", Lighting Research and Technology 36 (3): 183–199, doi:10.1191/1365782804li112oa
- ^ a b CIE (1995), Method of Measuring and Specifying Colour Rendering Properties of Light Sources, Publication 13.3, Vienna: Commission Internationale de l'Eclairage, ISBN 978-3900734572, http://www.cie.co.at/publ/abst/13-3-95.html (A verbatim re-publication of the 1974, second edition. Accompanying disk D008: Computer Program to Calculate CRIs)
- ^ {{cite book|author=P. J. Bouma|year=1948|title=Physical aspects of colour; an introduction to the scientific study of colour stimuli and colour sensations|publisher=(Eindhoven: Philips Gloeilampenfabrieken (Philips Industries) Technical and Scientific Literature Dept.)
- ^ American approach is expounded in Nickerson (1960), and the European approach in Barnes (1957), and Crawford (1959). See Schanda & Sándor (2003) for a historical overview.
- ^ Rea, M.S., and Freyssinier, J.P. "Color rendering: Beyond pride and prejudice." Color Research and Application, (2010). Epub January 7, 2010 online at: < http://www3.interscience.wiley.com/cgi-bin/fulltext/123234510/HTMLSTART >. [doi: 10.1002/col.20562].
- ^ http://www.lrc.rpi.edu/programs/solidstate/assist/pdf/AR-ColorGuideforRetailLighting-March2010.pdf
- ^ Rea M., L. Deng, and R. Wolsey. 2004. NLPIP Lighting Answers: Light Sources and Color. Troy, NY: Rensselaer Polytechnic Institute; National Lighting Product Information Program. Available online at: http://www.lrc.rpi.edu/nlpip/publicationDetails.asp?id=901&type=2
- ^ Nickerson, Dorothy; Jerome, Charles W. (April 1965), "Color rendering of light sources: CIE method of specification and its application", Illuminating Engineering (IESNA) 60 (4): 262–271
- ^ Note that when CRI was designed in 1965, the most perceptually uniform chromaticity space was the CIE 1960 UCS, the CIE 1976 UCS not yet having been invented.
- ^ (CIE 1995), Section 5.3: Tolerance for reference illuminant
- ^ Per Schanda & Sándor (2003), Schanda (2002) and, as demonstrated in the Example section, the coefficient was chosen as 4.6 so that the CRI of the CIE standard illuminant F4, an obsolete "warm white" calcium halophosphate fluorescent lamp would be 51. Today's fluorescent "full-spectrum lights" boast CRIs approaching 100; e.g, Philips TL950 or EP 1184893. Thornton (1972) compares older products; Guo & Houser (2004) compares newer ones.
- ^ It appeared that Ri could be negative (ΔEi ≥ 22), and this was indeed calculated for some lamp test colors, especially TCS9 (strong red).
- ^ See the CIE 1960 UCS diagram towards the end of the Example section.
- ^ TCS spectra in CSV form, Korea Research Institute of Standards and Science.
- ^ Munsell Renotation Data, Munsell Color Science Laboratory, Rochester Institute of Technology
- ^ "Authors’ response to SA Fotios and JA Lynes" in Schanda & Sándor (2005): The main message of our investigations is an answer to the lamp industry, who still use the colour rendering index and the lamp efficacy as parameters for optimizing their lamp spectra, and have turned down the work of CIE TC 1-33 by stating that there are not enough visual experiments showing the shortcomings of the CIE colour rendering calculation method.
- ^ See "Past research to improve the CRI" in Bodrogi (2004)
- ^ X-Rite ColorChecker Chart.
- ^ "Authors’ response to SA Fotios and JA Lynes" in Schanda & Sándor (2005): It is quite obvious that just at 5000 K, where the reference illuminant has to be changed, the present system shows discontinuity.'
- ^ Rea, M.S. and Freysinnier-Nova, JP. "Color rendering: A tale of two metrics," Color Research and Application, 33(3), 192-202 (2008). [doi: 10.1002/col.20399]
- ^ Rea, M.S., and Freyssinier, J.P. "Color rendering: Beyond pride and prejudice." Color Research and Application, (2010). Epub January 7, 2010 online at: < http://www3.interscience.wiley.com/cgi-bin/fulltext/123234510/HTMLSTART >. [doi: 10.1002/col.20562].
- ^ Alliance for Solid-State Illumination Systems and Technologies. "ASSIST recommends…Guide to Light and Color in Retail Merchandising," 8(1), (2010). Online at: < http://www.lrc.rpi.edu/programs/solidstate/assist/recommends/lightcolor.asp > (28 May 2010)
- ^ Alliance for Solid-State Illumination Systems and Technologies. "ASSIST recommends…Recommendations for Specifying Color Properties of Light Sources for Retail Merchandising." 8(2), (2010). Online at: < http://www.lrc.rpi.edu/programs/solidstate/assist/recommends/lightcolor.asp > (28 May 2010)
- ^ CIE Activity Report. Division 1: Vision and Color, pg.21, January 2008.
- ^ Smet KAG, Ryckaert WR, Pointer MR, Deconinck G, Hanselaer P. Colour Appearance Rating of Familiar Real Objects. Colour Research and Application 2011;36(3):192–200.
- ^ Smet KAG, Ryckaert WR, Pointer MR, Deconinck G, Hanselaer P. Correlation between color quality metric predictions and visual appreciation of light sources.Optics Express 2011;19(9):8151-8166
- ^ "Solid State Lighting Project". http://www.oscars.org/science-technology/council/projects/ssl/index.html.
Sources
- CIE (1999), Colour rendering (TC 1-33 closing remarks), Publication 135/2, Vienna: CIE Central Bureau, ISBN 3-900-734-97-6, http://cie.kee.hu/newcie/publ/abst/135-99.html
- CIE (2004), CIE Colorimetric and Colour Rendering Tables, Disk D002, Rel 1.3, http://www.cie.co.at/publ/abst/d002.html
- CIE (2007), Colour rendering of white LED light sources, Publication 177:2007, Vienna: CIE Central Bureau, ISBN 978-3901906572, http://www.slg.ch/pdf/publikation177.pdf. Carried out by TC 1-69: Colour Rendering of White Light Sources.
- Barnes, Bentley T. (December 1957), "Band Systems for Appraisal of Color Rendition", JOSA 47 (12): 1124–1129, doi:10.1364/JOSA.47.001124, http://www.opticsinfobase.org/abstract.cfm?id=51703
- Bodrogi, Peter (2004), "Colour rendering: past, present(2004), and future", CIE Expert Symposium on LED Light Sources, pp. 10–12, http://cie2.nist.gov/LED_Sympo_2004/CIE_LED_symp04_prog_abstr.pdf
- Crawford, Brian Hewson (December 1959), "Measurement of color rendering tolerances", JOSA 49 (12): 1147–1156, doi:10.1364/JOSA.49.001147, http://www.opticsinfobase.org/abstract.cfm?URI=josa-49-12-1147
- Davis, Wendy; Ohno, Yoshi (December 2006), Color Rendering of Light Sources, NIST, http://web.archive.org/web/20090825230627/http://physics.nist.gov/Divisions/Div844/facilities/vision/color.html
- Hung, Po-Chieh (September 2002), "Sensitivity metamerism index digital still camera", in Dazun Zhao, Ming R. Luo, Kiyoharu Aizawa, Color Science and Imaging Technologies, Proceedings of SPIE, 4922, pp. 1–14, doi:10.1117/12.483116
- Nickerson, Dorothy (January 1960), "Light sources and color rendering", JOSA 50 (1): 57–69, doi:10.1364/JOSA.50.000057, http://www.opticsinfobase.org/abstract.cfm?URI=josa-50-1-57
- Ohno, Yoshi (2006), "Optical metrology for LEDs and solid state lighting", in E. Rosas, R. Cardoso, J.C. Bermudez, O. Barbosa-Garcia, Fifth Symposium "Optics in Industry", 6046, pp. 604625–1–604625–8, doi:10.1117/12.674617, http://physics.nist.gov/Divisions/Div844/facilities/photo/Publications/OhnoOptInd2005.pdf
- Pousset, Nicolas; Obein, Gael; Razet, Annick (2010), "Visual experiment on LED lighting quality with color quality scale colored samples", Proceedings of CIE 2010 : Lighting quality and energy efficiency, Vienna, Austria: 722–729, http://nicolas_pousset.perso.neuf.fr/Recherche/Article/CQS.pdf
- Schanda, János (April, 2-5 2002), "The concept of colour rendering revisited", First European Conference on Color in Graphics Imaging and Vision, Univ. Poitiers, France, http://www.knt.vein.hu/staff/schandaj/SJCV-Publ-2005/462.pdf
- Thornton, William A. (1972), "Color-Rendering Capability of Commercial Lamps", Applied Optics 11 (5): 1078–1086, doi:10.1364/AO.11.001078, http://www.opticsinfobase.org/abstract.cfm?URI=ao-11-5-1078
- Smet, K.A.G. (2011), "Correlation between color quality metric predictions and visual appreciation of light sources", Optics Express 19 (9): 8151–8166, http://www.opticsinfobase.org/view_article.cfm?gotourl=http%3A%2F%2Fwww.opticsinfobase.org%2FDirectPDFAccess%2F385D19F1-0E62-C5F9-DA3D27D7D6829EBC_212731.pdf%3Fda%3D1%26id%3D212731%26seq%3D0%26mobile%3Dno&org=
External links
- MATLAB script for calculating measures of light source color, Rensselaer Polytechnic Institute, 2004.
- Excel spreadsheet with a cornucopia of data, Lighting Laboratory of the Helsinki University of Technology, updated link excel sheet to calculate the CRIs
- Philips Fluorescent Light Source Color Charts (reproduced with permission from Fluorescent Cross Reference Guide, pg. 136.)
- Uncertainty evaluation for measurement of LED colour, Metrologia
- Color Rendering Index of Common Light Source
- Color Rendering Index and LEDs, United States Department of Energy, Office of Energy Efficiency and Renewable Energy (EERE)
- Alliance for Solid State Illumination Systems and Technologies, Color Rendering


Wikimedia Foundation. 2010.