- Demographic history of Vojvodina
-
Vojvodina's demographic history reflects its rich history and its former location at the border of the Ottoman and Habsburg empires and at the confluence of various peoples, making it a hotbed of invasion, colonization, and assimilation processes. Currently there are more than 25 ethnic groups living in Vojvodina and six official languages.
Demographic history
The area of Vojvodina had been inhabited since the Paleolithic period. Indo-European peoples moved into this area during three migration waves, which are dated in 4200 BC, 3300 BC, and 2800 BC respectively. Before the Roman conquest in the 1st century BC, Indo-European peoples of Illyrian, Thracian and Celtic origin inhabited the region.
During the Roman administration (which extended to Syrmia and Banat), original inhabitants were heavily Romanized, later to become known by the name of Vlachs. Region of Bačka, which did not belonged to the Roman Empire, was populated by Iranian Sarmatians (Iazyges). After the end of the Roman rule, the Romanized inhabitants of the area escaped to Balkanic mountains (where they mixed with South Slavic Serbs and Croats) as well as to the Transylvanian mountains (where they later were known as Romanians).[1]
Vojvodina was invaded by the Turanic nomads such as the Huns and Avars, as well as by the Germanic Goths, Gepids and Lombards, but after their military defeat, they were quickly absorbed by the local (Slavic) population, without leaving much ethnic traces in population of the region.
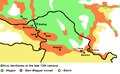
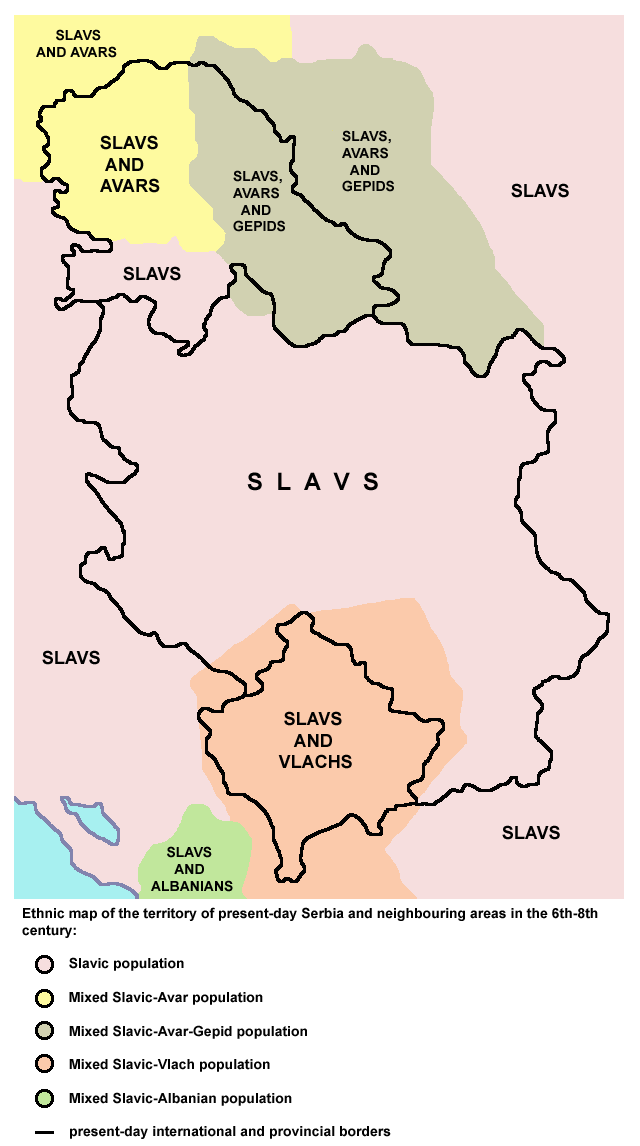
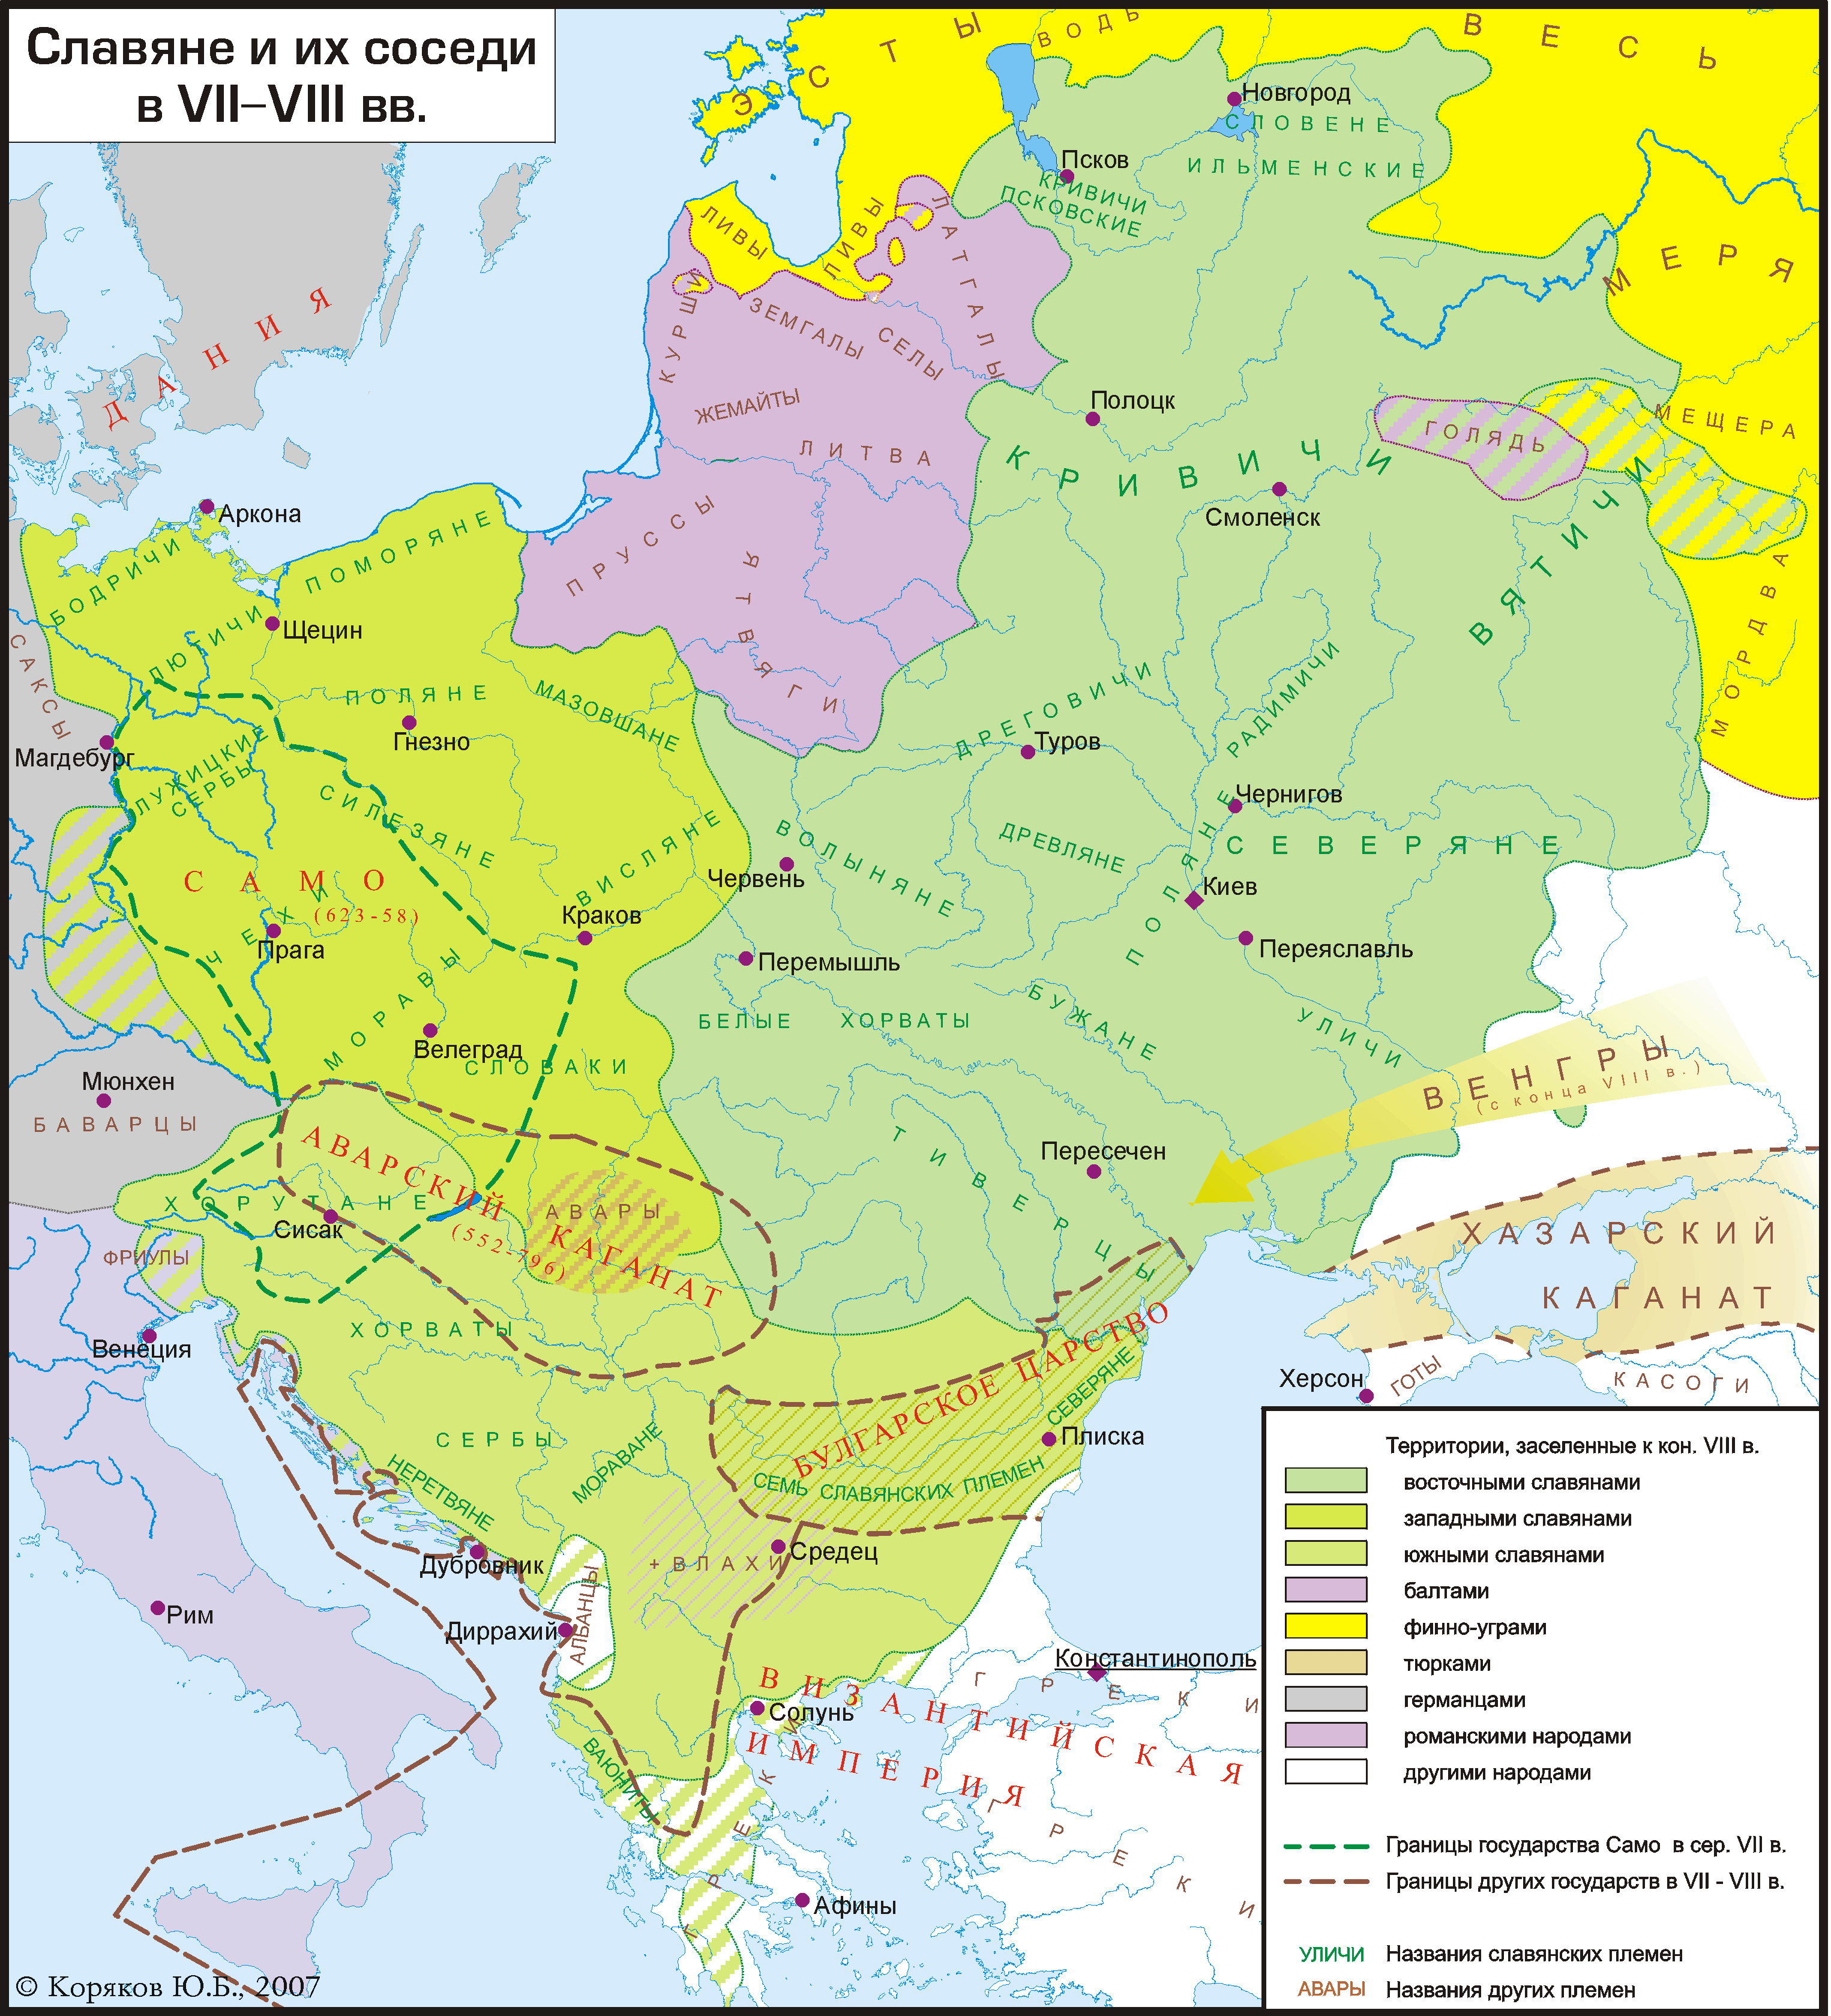
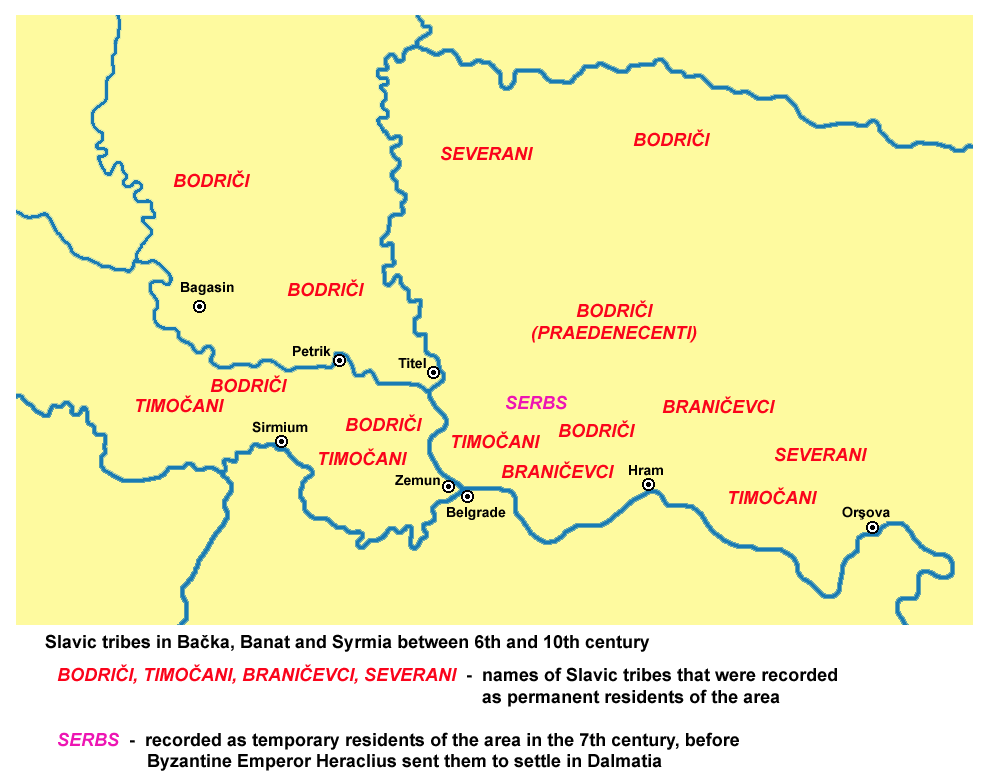
During the early medieval migrations, Slavs (Severans, Abodrites, Braničevci, Timočani and Serbs) settled today's Vojvodina in the 6th and 7th centuries.[2] According to some sources, pockets of Romanised population remained in the area.[citation needed] Until the Hungarian conquest in the 10th century, the region had dominant Slavic population.[3]
-

Indo-European peoples in Vojvodina in ancient times.
-

Slavs in Vojvodina in the 6th century.
-

Slavs in Vojvodina in the 6th–7th century.
-

Ethnic map of Vojvodina (6th–8th century).
-

Slavs in Vojvodina in the 7th–8th century.
-

Slavs in Vojvodina in the 9th century, before the Hungarian conquest.
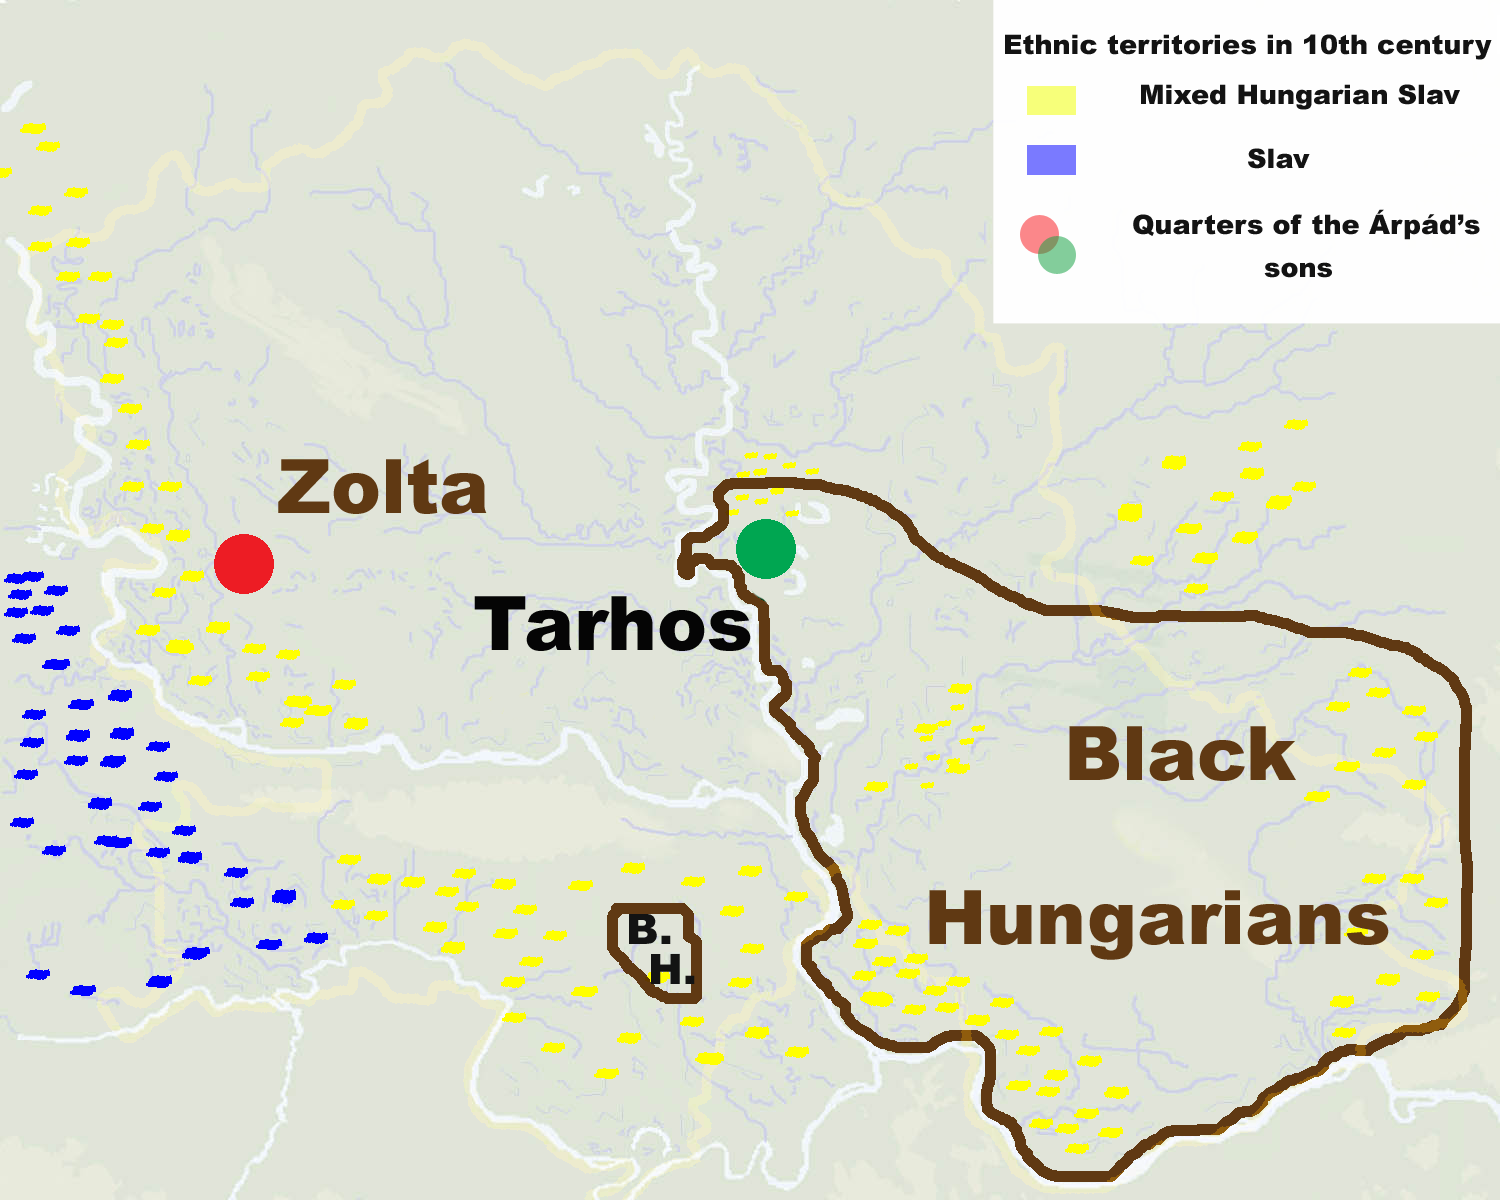
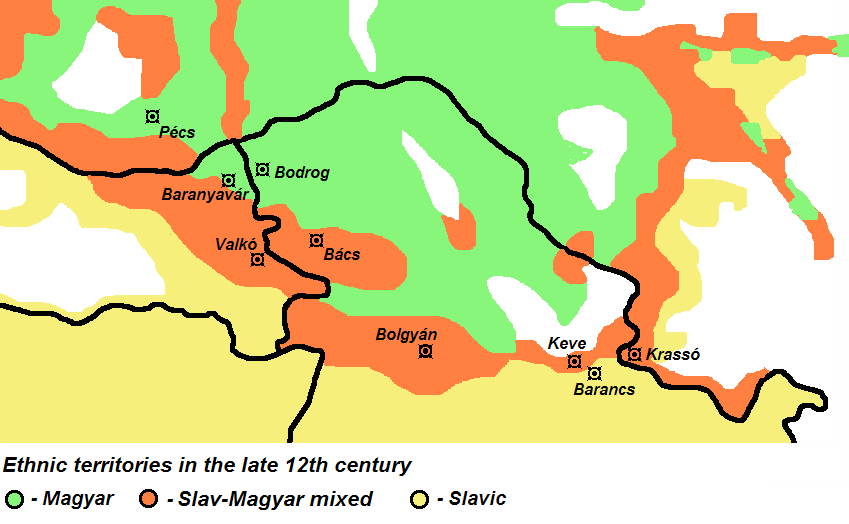
The region was conquered by the Principality of Hungary (later Kingdom of Hungary) in the 10th century, and Hungarians started to settle in the area. Hungarians mainly settled in northern part of the region, where they lived mixed with Slavs. Until the late 12th and early 13th century, the region was mainly populated by Slavs, after which the ethnic relations changed in favor of Hungarians. The larger number of Hungarians settled in the region since the 13th century. The presence of Slavs in the area increased again in the 14th century with the arrival of many Serbs from the south. During the Hungarian administration, much of the native local Slavs were Hungarized.[4] Initially, the Hungarian language was spoken only by the knights and nobility of the Kingdom of Hungary, but it was later adopted also by the rest of the population.[5] By the opinion of some researchers, the non-Hungarized descendants of these local Slavs are present-day Šokci.[6]
Though Serbs were part of the aboriginal Slavic population in the territory of Vojvodina (especially in Syrmia), an increasing number of Serbs began settling from the 14th century onward. Because of the presence of the large Serb population, in many historical records and maps, which were written and drawn between 15th and 18th centuries, territory of present day Vojvodina was named Rascia (Raška, Serbia) and Little Raška (Little Serbia).
The Ottoman Empire took control of Vojvodina in the 16th century, and this caused a massive depopulation of the region. Most of the Hungarians and many local Slavs fled from the region and escaped to the north. The majority of those who left in the region were Serbs, mainly now engaging either in farming either in Ottoman military service.
Under Ottoman policy, many Serbs were newly settled in the region. During the Ottoman administration, Serbs comprised an absolute majority of population of Vojvodina.[7] In that time, villages were populated exclusively by Serbs, while cities were populated by various ethnic and religious groups, including mainly Muslims and Serbs, but also some Cincars, Greeks, Jews and Roma.[8]
The Habsburg Monarchy took control of Vojvodina among other lands by the treaties of Karlovci (1699) and Požarevac (1718). Following the establishment of the Habsburg administration, the Muslim population fled from the region. Some of these Muslim refugees were resettled in Bosnia and Herzegovina. During the Habsburg administration, many new Serb settlers from the Ottoman Empire immigrated to the region. In 1687, the northern parts of the region were settled by ethnic Bunjevci.
Many other non-Serb colonists also settled in the territory of present day Vojvodina during the 18th and 19th century. They were mainly Germans and Hungarians, but also Rusyns, Slovaks, Romanians, and others. Because of this colonization, Serbs lost the absolute ethnic majority in the region, and Vojvodina became one of the most ethnically diverse regions of Europe.
Still, Serbs remained the largest ethnic group in the region. According to 1910 census, Serbs comprised 33.8% of the population in the territory of present day Vojvodina. After Serbs, the most numerous ethnic groups were Hungarians (28.1%) and Germans (21.4%).
In 1918, Vojvodina became part of the Kingdom of Serbs, Croats and Slovenes and new Serb settlers came to the region. As the consequence of the Second World War events, most of Vojvodina Germans (about 200,000) left from Vojvodina together with defeated German army.[9] Those who remained in the region were sent to local communist prison camps. After prison camps were dissolved (in 1948) and Yugoslav citizenship was returned to the Germans, the remaining German population left Yugoslavia because of economic reasons.[10] Instead of them, new South Slavic (Serb, Montenegrin, Macedonian, Croat, etc) colonists settled in the region. According to the 1948 census, Serbs were absolute majority in Vojvodina again (51%), and this percent rose to 65% in 2002 census. The multiethnic character of the region is also preserved.
-

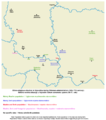
Slavs and Hungarians in the 10th century, after the Hungarian conquest, according to Hungarian author Dr. György Györffy
-
Slavs and Hungarians in the 13th century according to some Hungarian sources. Note that other authors claim that presence of Slavs in the area was larger in this time.
-
Ethno-religious situation in some main cities of Vojvodina during Ottoman administration (16th–17th century)
-

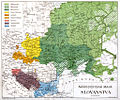
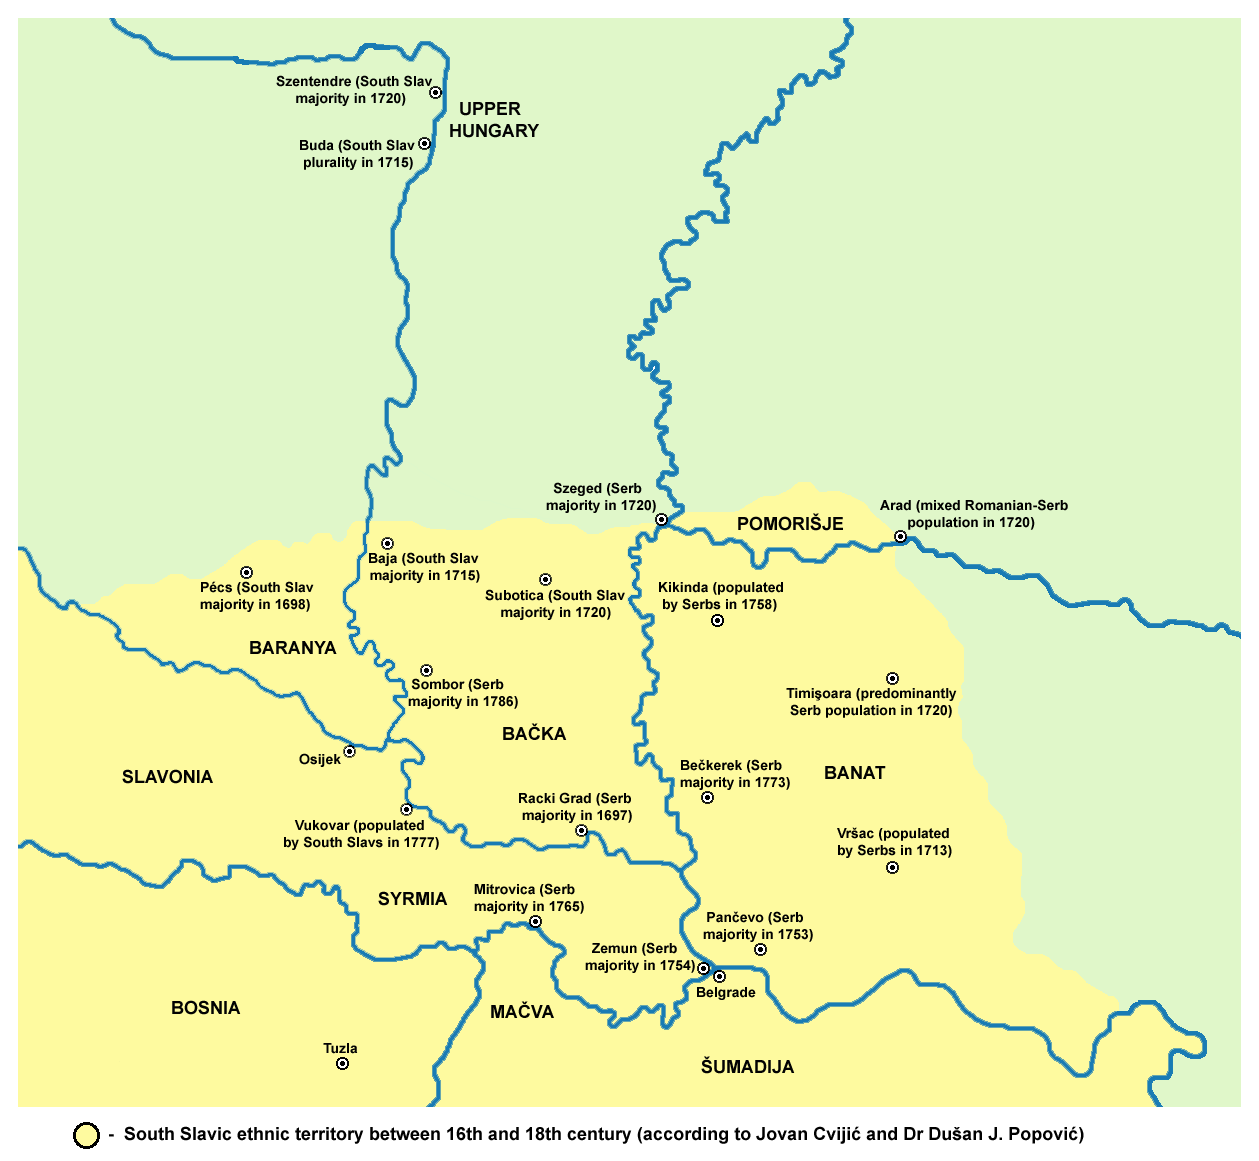
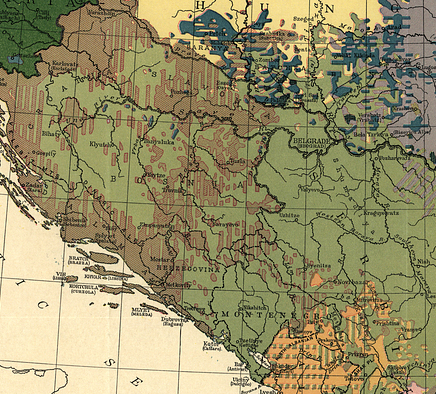
Territory with South Slavic majority between 16th and 18th century (according to Jovan Cvijić and Dr Dušan J. Popović)
-

Ethnic map of Bačka (1715 census)
-

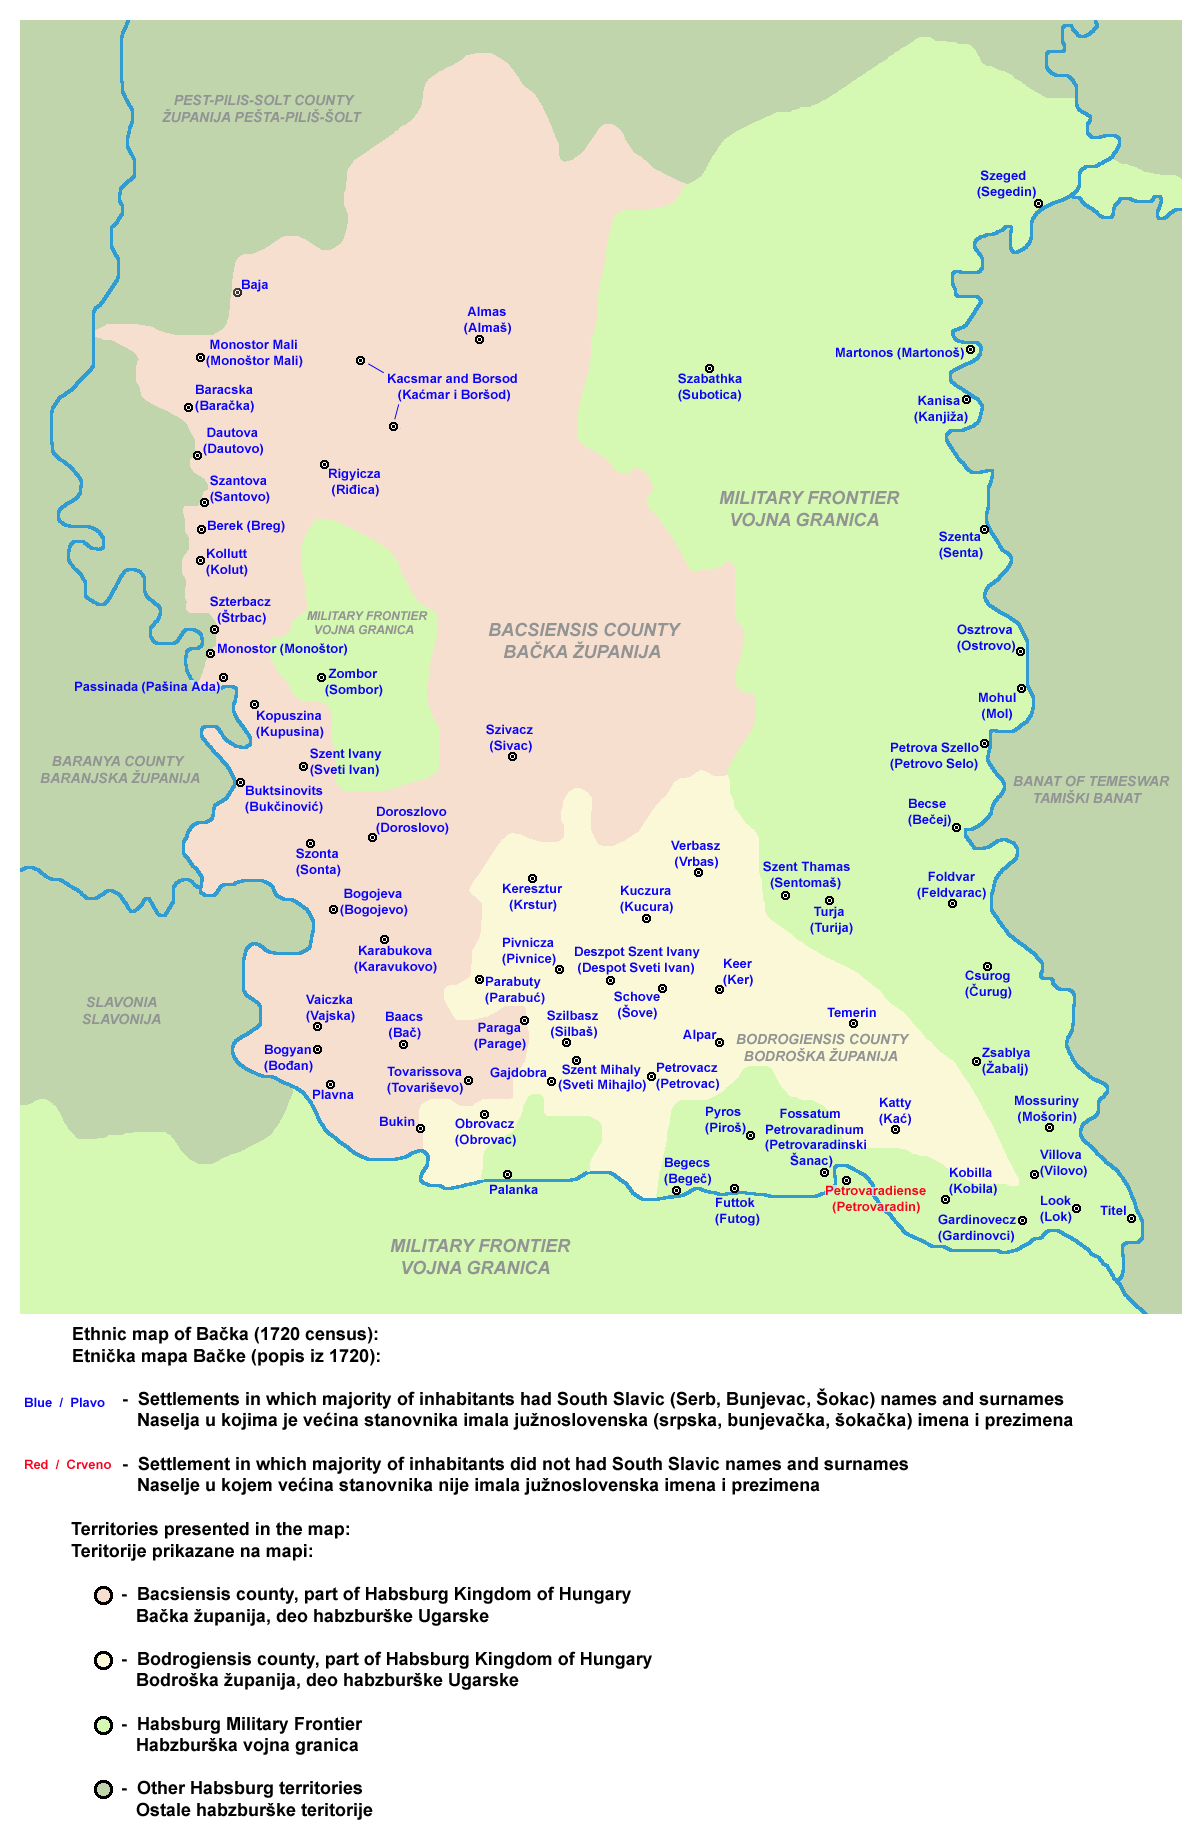
Ethnic map of Bačka (1720 census)
-
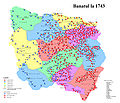
Ethnic map of Banat in 1743
-

Ethnic map of Banat in 1774
Population data from the Hungarian administration period
9th century
When Hungarians arrived to Central Europe (in 896), this region was populated exclusively by Slavs.[11]
Population data from the Ottoman administration period
During Ottoman administration (16th-18th century), the region of Vojvodina had an absolute Serb majority.[12]
Population data from the Habsburg administration period
1690
In 1690, about 210,000 Serbs lived in Vojvodina (excluding Srem).[13] In this time, almost entire population of the region was composed of Serbs, also including some Šokci.[14]
1715
According to the Austrian census in Bačka from 1715, Serbs, Bunjevci, and Šokci comprised 97.6% of population.[15]
1718-1720
The 1720 census in Bačka recorded 72% Serbs and 22% Bunjevci and Šokci.[16] After the Treaty of Passarowitz (1718), the first Habsburg census recorded in Banat about 20,000 citizens, mostly Serbs.[17]
1787
Ethnicity Number % Serbs 281,690 59.2 Germans 58,866 12.4 Hungarians 50,316 10.6 Croats 38,161 8 Romanians 27,436 5.8 Slovaks 9,704 2 Rusyns 3,836 0.8 Albanians 1,600 Bulgarians 400 TOTAL 476,018 100 1828
Ethnicity Number % Serbs 442,923 51.1 Germans 142,653 16.4 Hungarians 130,918 15.1 Croats 67,692 7.8 Romanians 46,645 5.4 Slovaks 19,464 2.2 Rusyns 6,068 0.7 Albanians 1,700 Bulgarians 1,264 TOTAL 864,281 100 1840
Ethnicity Number % Serbs 448,341 49.1 Germans 154,047 16.9 Hungarians 145,930 16 Croats 66,362 7.3 Romanians 55,984 6.1 Slovaks 22,924 2.5 Rusyns 7,373 0.8 Albanians 1,900 Bulgarians 686 TOTAL 912,754 100 1857
Ethnicity Number % Serbs 417,838 40.5 Germans 217,510 21.1 Hungarians 202,188 19.6 Romanians 65,387 6.3 Croats 60,690 5.9 Slovaks 35,328 3.4 Rusyns 8,452 0.8 Bulgarians 2,160 Albanians 1,297 TOTAL 1,030,545 100 1880 census
Ethnicity Number % Serbs 416,116 35.5 Germans 285,920 24.4 Hungarians 265,287 22.6 Croats, Bunjevci & Šokci 72,486 6.2 Romanians 69,668 5.9 Slovaks 43,318 3.7 Rusyns & Ukrainians 9,299 0.8 Others 10,635 0.9 TOTAL 1,172,729 100 -

Linguistic structure of Vojvodina by settlements 1880-1884 (territorial organization from 2002.)
-

Religious structure of Vojvodina by settlements 1880-1884 (territorial organization from 2002.)
1890 census
Ethnicity Number % Serbs 457,873 34.4 Hungarians 324,430 24.4 Germans 321,563 24.2 Croats, Bunjevci & Šokci 80,404 6 Romanians 73,492 5.5 Slovaks 49,834 3.7 Rusyns & Ukrainians 11,022 0.8 Others 12,525 1 TOTAL 1,331,143 100 -

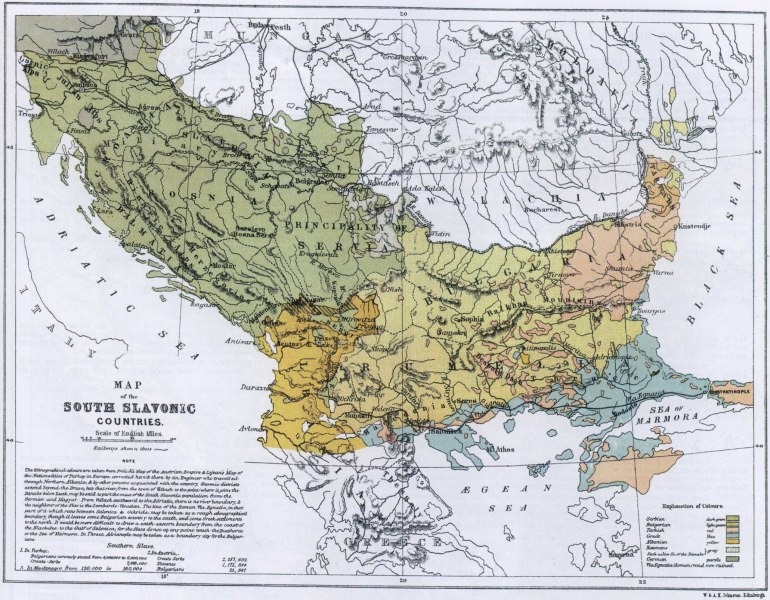
Ethnic map of Vojvodina in 1867
-

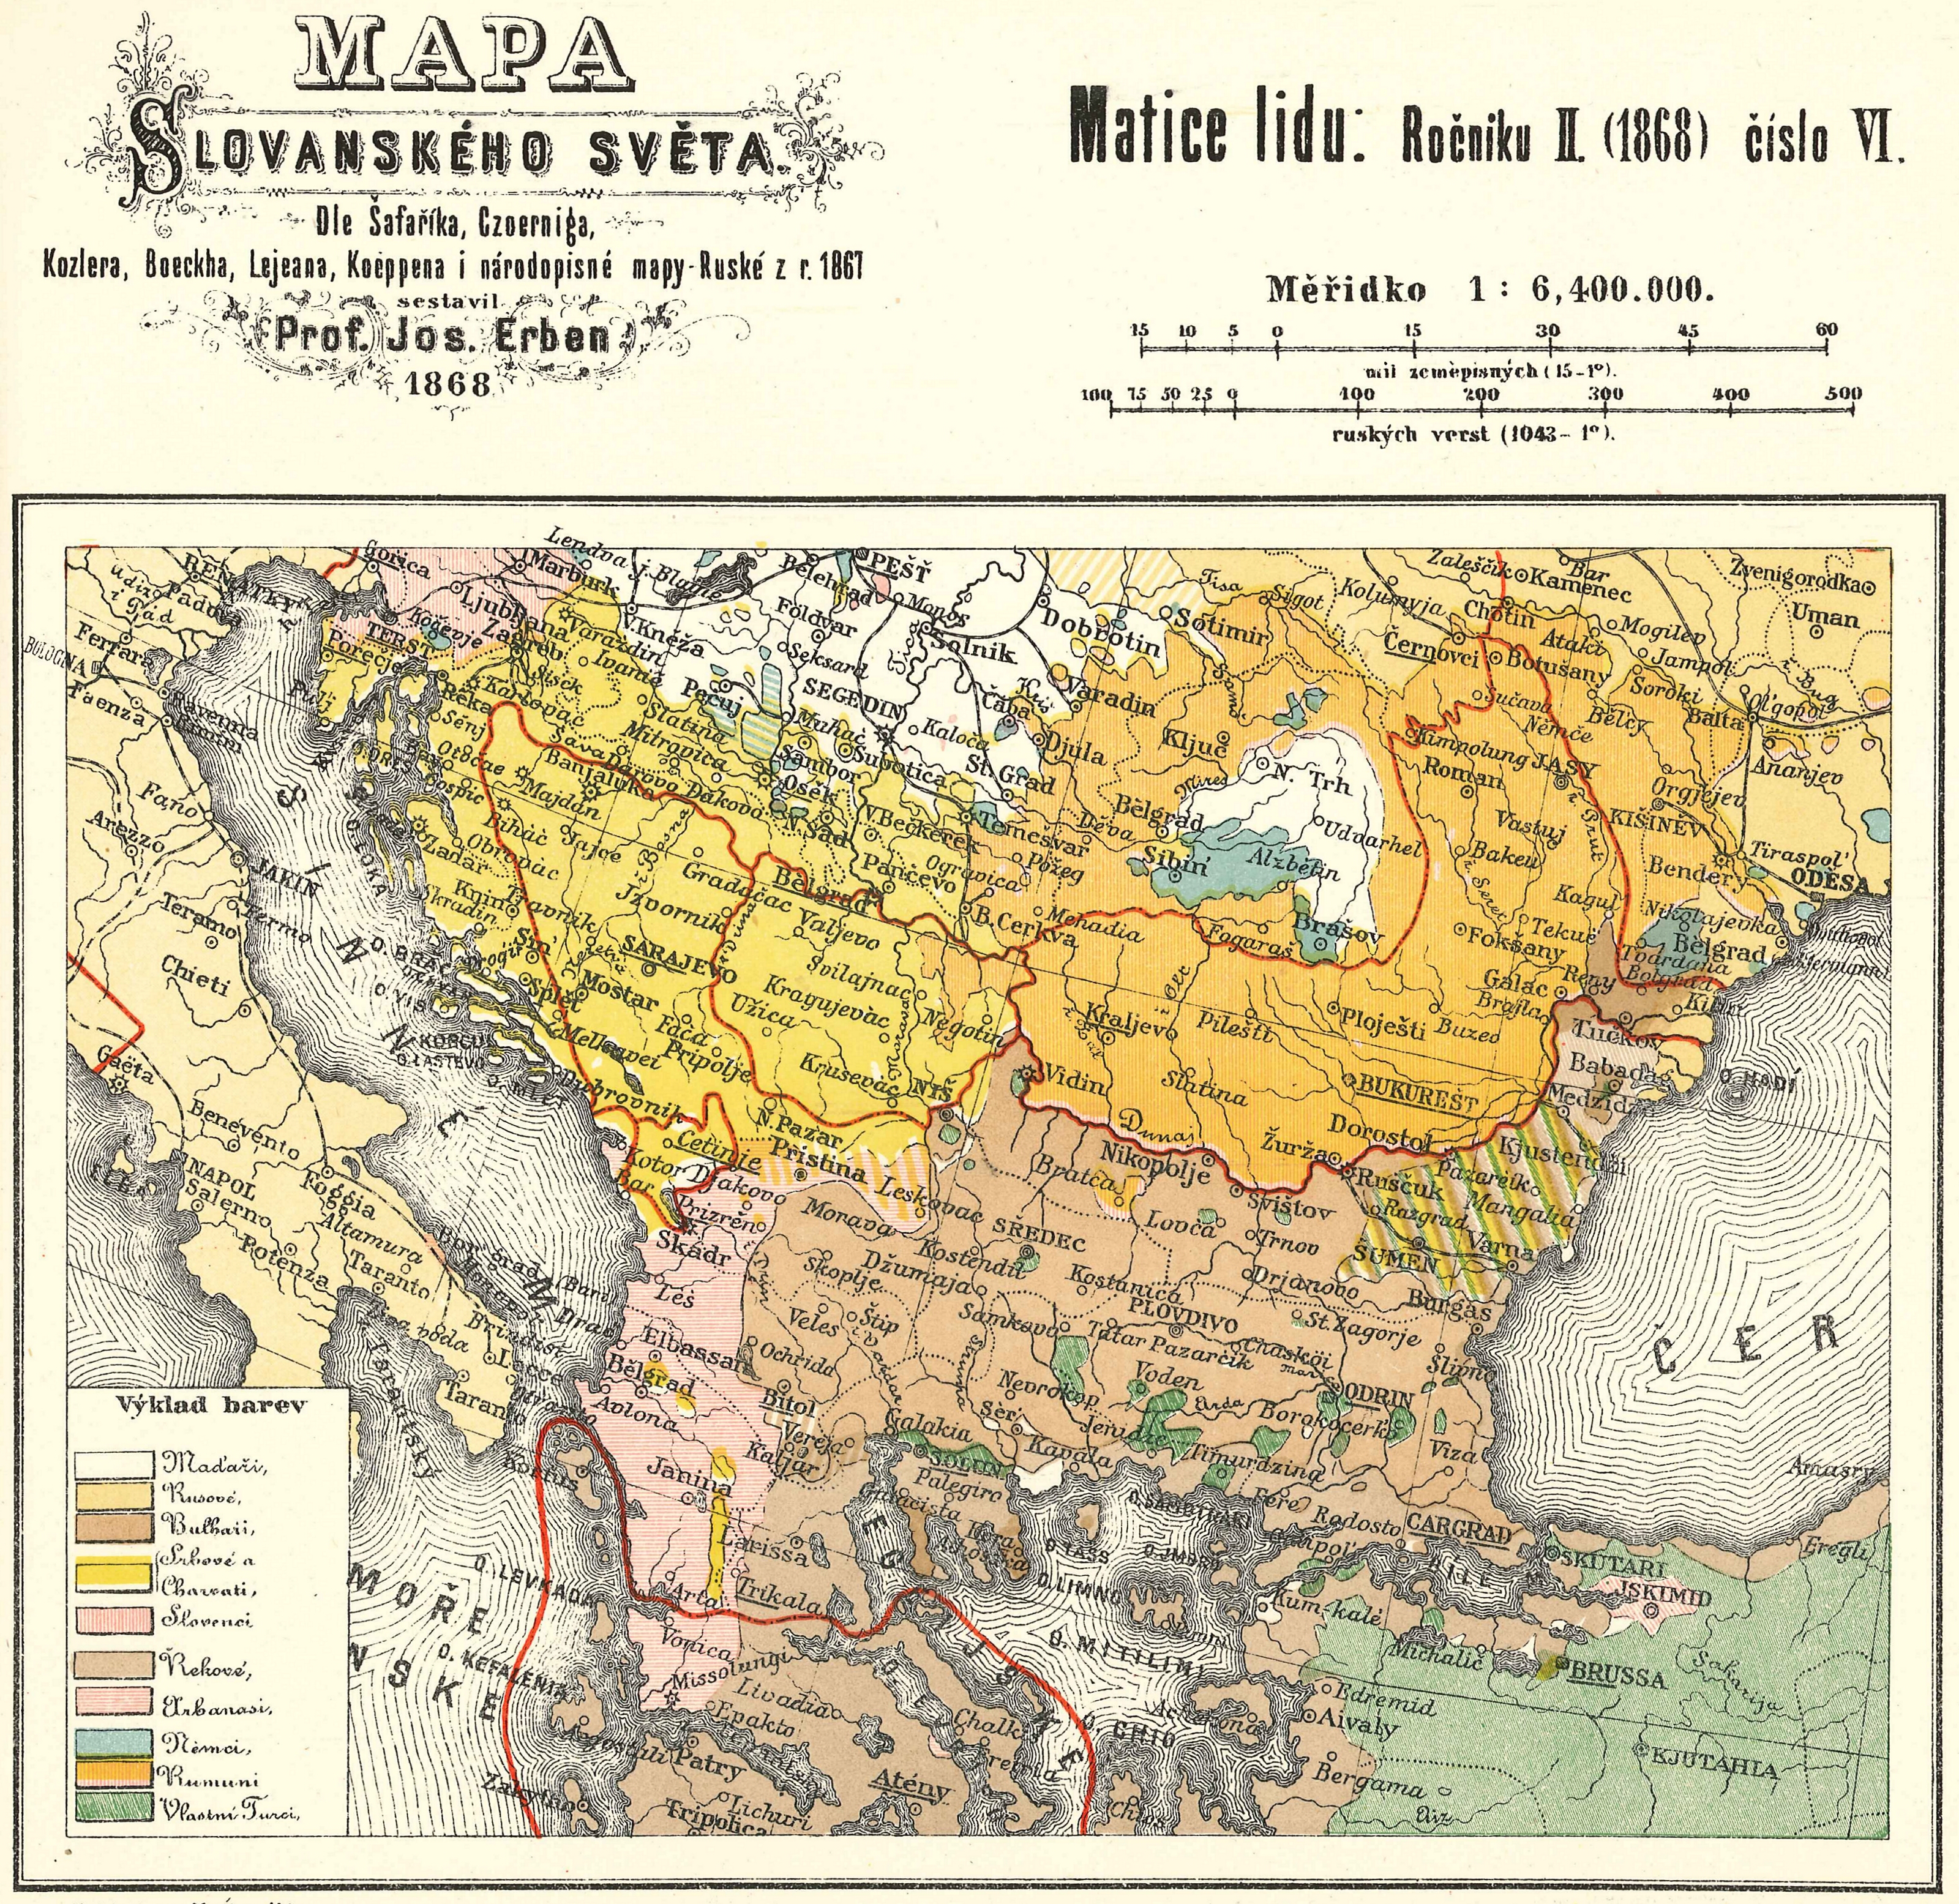
Ethnic map of Vojvodina in 1868
-

Ethnic map of Vojvodina in 1876
-

Ethnic map of Vojvodina in 1880
-

Ethnic map of Vojvodina in 1892
-

Slavs in Vojvodina in 1900
-
Slavs in Vojvodina in 1902–24
1900 census
Ethnicity Number % Serbs 483,176 33.7 Hungarians 378,634 26.4 Germans 336,430 23.5 Croats, Bunjevci & Šokci 80,901 5.6 Romanians 74,718 5.2 Slovaks 53,832 3.8 Rusyns & Ukrainians 12,663 0.9 Others 12,394 0.9 TOTAL 1,432,748 100 1910 census
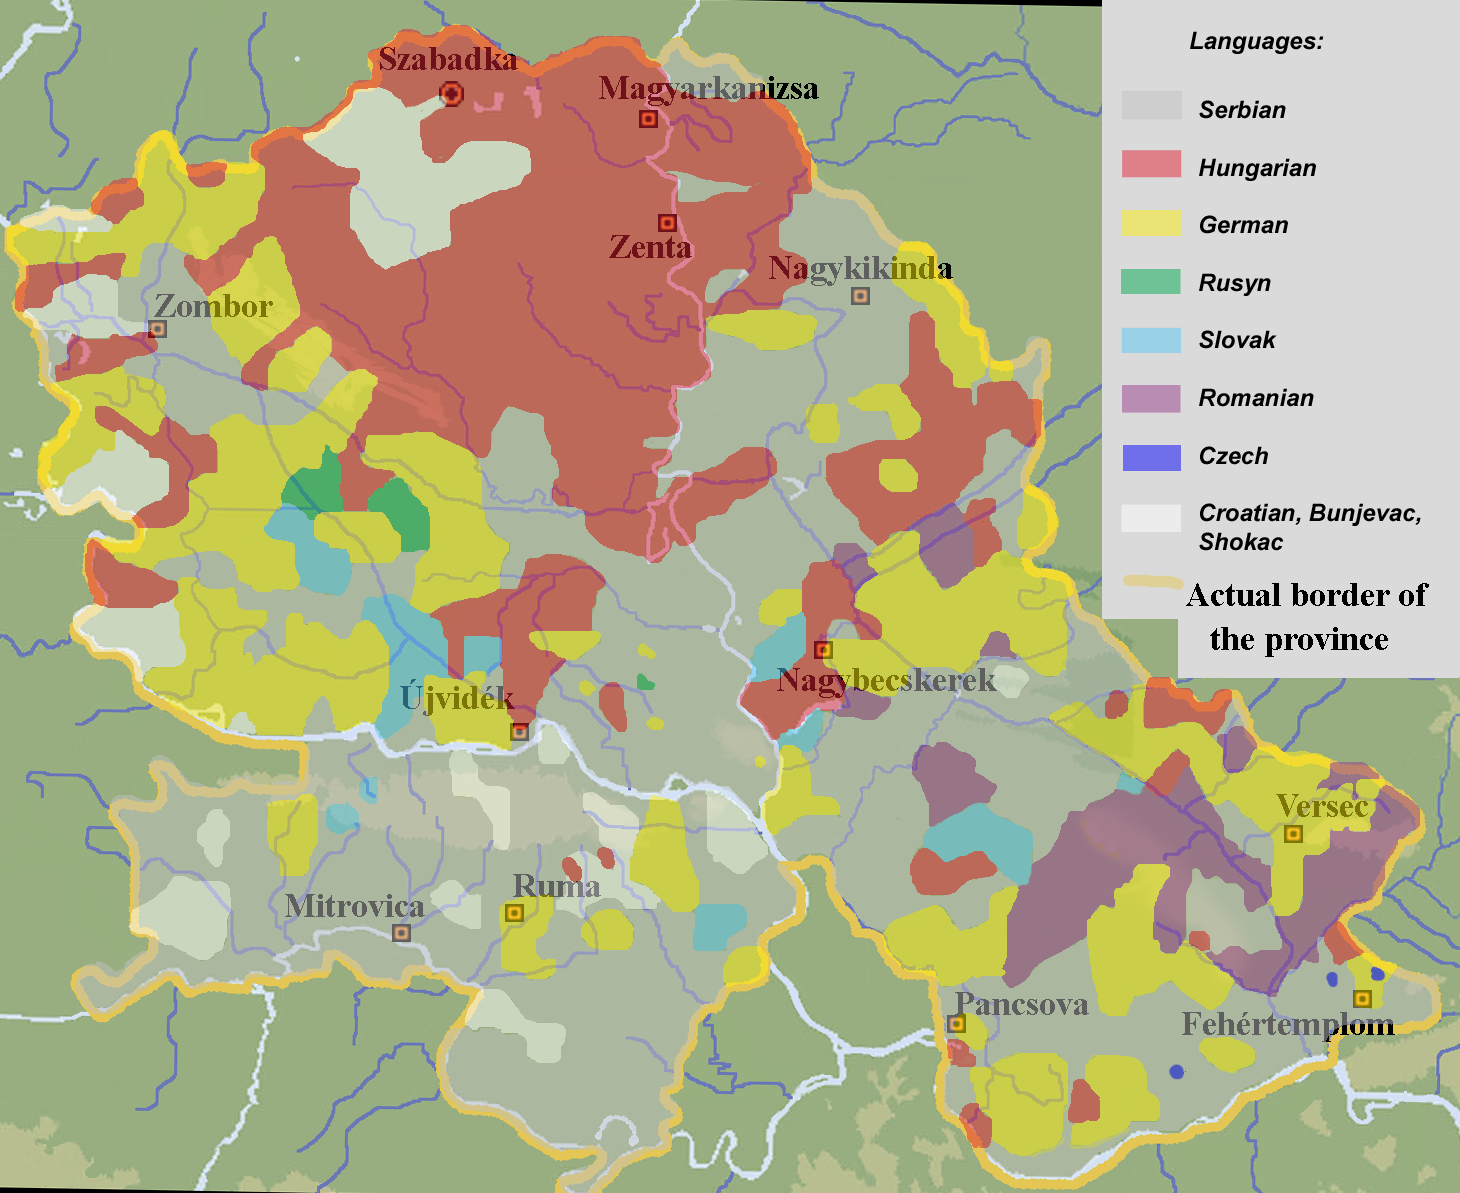
Ethnicity Number % Serbs 510,186 33.8 Hungarians 424,555 28.1 Germans 323,779 21.4 Romanians 75,223 5 Slovaks 56,689 3.7 Croats 34,089 2.3 Rusyns 13,479 0.9 Others 72,804 4.8 Note that linguistic data from this census might not correspond with ethnic structure in some settlements (Novi Sad, Subotica, Zrenjanin, etc), due to the fact that Hungarian language was spoken by several ethnicities (Hungarians, Jews, Bunjevci, etc).
-

Linguistic structure of Vojvodina by settlements 1910. (territorial organization from 2002.)
-

Religious structure of Vojvodina by settlements 1910. (territorial organization from 2002.)
-

Linguistic structure of Vojvodina by settlements 1910.
-

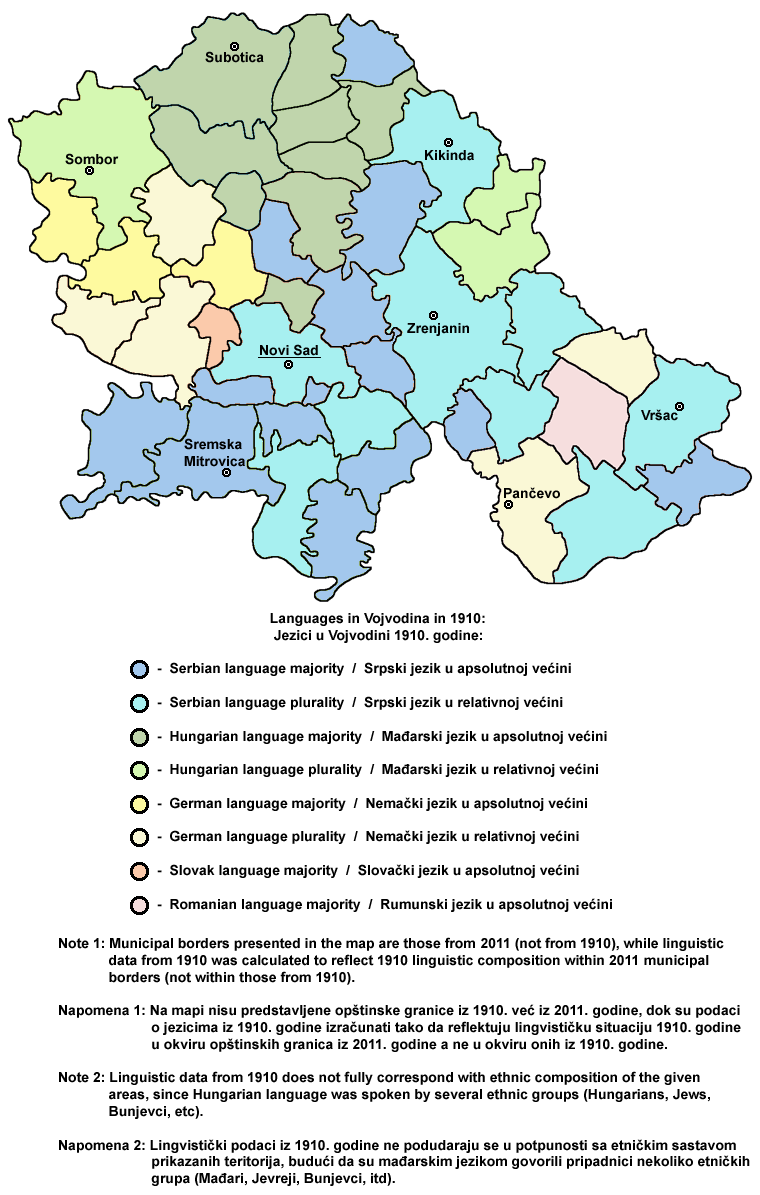
Linguistic structure of Vojvodina by municipalities 1910. (territorial organization from 2011.)
-

Linguistic map of Vojvodina in 1910
-

Linguistic map of Vojvodina in 1911
-

Ethnic map of Vojvodina in 1914
-

Ethnic map of Vojvodina in 1917
-

Ethnic map of Vojvodina in 1918, according to the Serbian geographer Jovan Cvijić
Population data from the Yugoslav administration period
1921 census
Ethnicity Number % Serbs 526,134 34.7 Hungarians 370,040 24.4 Germans 333,272 22 Croats 122,684 8.1 Romanians 65,197 4.3 Slovaks 58,273 3.8 Rusyns 13,664 0.9 Others 25,182 1.7 -

Language map of Vojvodina (1921 census)
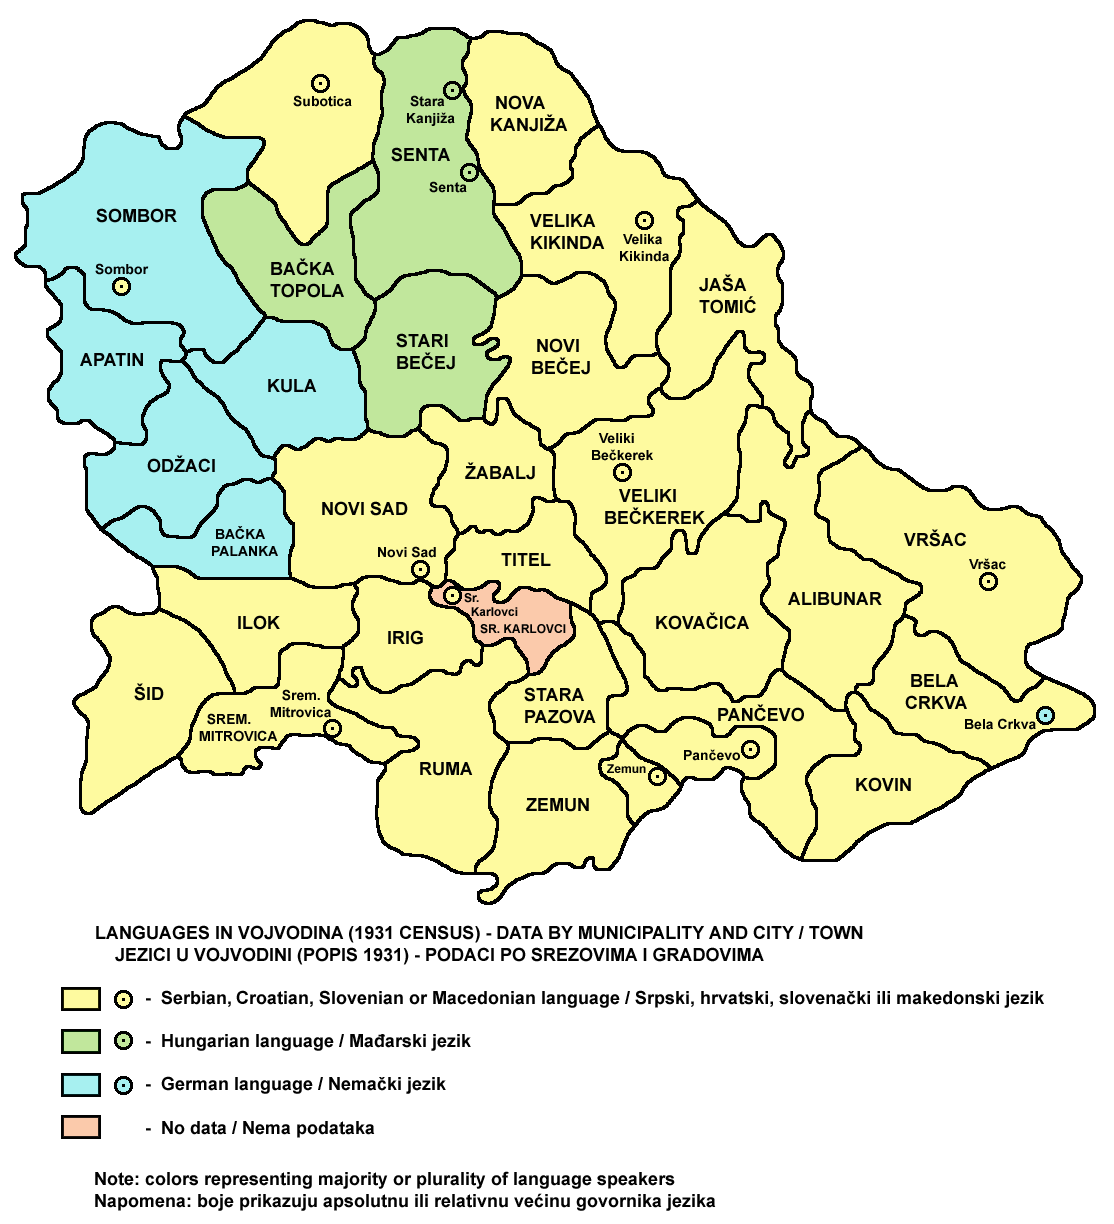
1931 census
Ethnicity Number % Serbs 528,000 33 Hungarians 413,000 26 Germans 343,000 21 Croats 120,000 7 Romanians 78,000 5 Slovaks & Czechs 67,000 4 Rusyns 21,000 1 Jews 21,000 1 Others 37,000 2 -

Language map of Vojvodina (1931 census)
1941 census
Note: 1941 census data for Bačka was combined with 1931 census data for Banat and Srem.
Ethnicity Number % Serbs 577,067 35.3 Hungarians 465,920 28.5 Germans 318,259 19.4 Croats 105,810 6.5 Others 169,311 10.3 1948 census
Ethnicity Number % Serbs 841,246 50.6 Hungarians 428,932 25.8 Croats 134,232 8.1 Slovaks 72,032 4.3 Romanians 59,263 3.6 Germans 31,821 1.9 Montenegrins 30,589 1.9 Rusyns and Ukrainians 22,083 1.3 Macedonians 9,090 0.5 Roma 7,585 0.4 Slovenes 7,223 0.4 Russians 5,148 0.3 Czechs 3,976 0.3 Bulgarians 3,501 0.2 Yugoslavs 1,050 0.1 Others 5,441 0.3 1953 census
Ethnicity Number % Serbs 865,538 50.9 Hungarians 435,179 25.6 Croats 127,027 7.5 Slovaks 71,153 4.2 Romanians 57,218 3.4 Montenegrins 30,516 1.8 Rusyns 23,038 1.4 Macedonians 11,622 0.7 Others 78,254 4.6 -

Ethnic structure of Vojvodina by municipalities 1953.
1961 census
Ethnicity Number % Serbs 1,017,713 54.9 Hungarians 442,560 23.9 Croats 145,341 7.8 Slovaks 73,830 4 Romanians 57,259 3.1 Montenegrins 34,782 1.9 Rusyns 23,038 1.4 Macedonians 11,622 0.7 Others 83,480 4.4 -

Ethnic structure of Vojvodina by settlements 1961.
-

Share of Serbs in Vojvodina by settlements 1961.
-
Share of Hungarians in Vojvodina by settlements 1961.
-

Share of Croats in Vojvodina by settlements 1961.
1971 census
TOTAL 1,952,533 100 Serbs 1,089,132 55.8 Hungarians 423,866 21.7 Croats 138,561 7.1 Slovaks 72,795 3.7 Romanians 52,987 2.7 Montenegrins 36,416 1.9 Rusyns 20,109 1 Macedonians 16,527 0.8 Germans 7,243 0.4 Others 94,897 4.9 -

Ethnic structure of Vojvodina by settlements 1971.
1981 census
Ethnicity Number % Serbs 1,107,375 54.4 Hungarians 385,356 18.9 Croats 119,157 5.9 Slovaks 69,549 3.4 Romanians 47,289 2.3 Montenegrins 43,304 2.1 Rusyns & Ukrainians 24,306 1.2 Germans 3,808 0.2 Others 234,628 11.6 -

Ethnic structure of Vojvodina by settlements 1981.
-

Share of Montenegrins in Vojvodina by settlements 1981.
1991 census
TOTAL 2,012,517 100 Serbs 1,151,353 57.2 Hungarians 340,946 16.9 Yugoslavs 168,859 8.4 Croats 74,226 3.7 Slovaks 63,941 3.2 Montenegrins 44,721 2.2 Romanians 38,832 1.9 Roma 24,895 1.2 Bunjevci 21,552 1.1 Rusyns 17,889 0.9 Macedonians 16,641 0.8 Muslims 6,079 0.3 Albanians 2,959 0.2 Slovenes 2,563 0.1 Ukrainians 2,057 0.1 Šokci 1,866 0.1 Others 33,140 1.7 -

Ethnic structure of Vojvodina by settlements 1991.
-

Religious structure of Vojvodina by settlements 1991.
-

Share of Orthodox in Vojvodina by settlements 1991.
-

Share of Catholics in Vojvodina by settlements 1991.
-

Share of Protestants in Vojvodina by settlements 1991.
2002 census
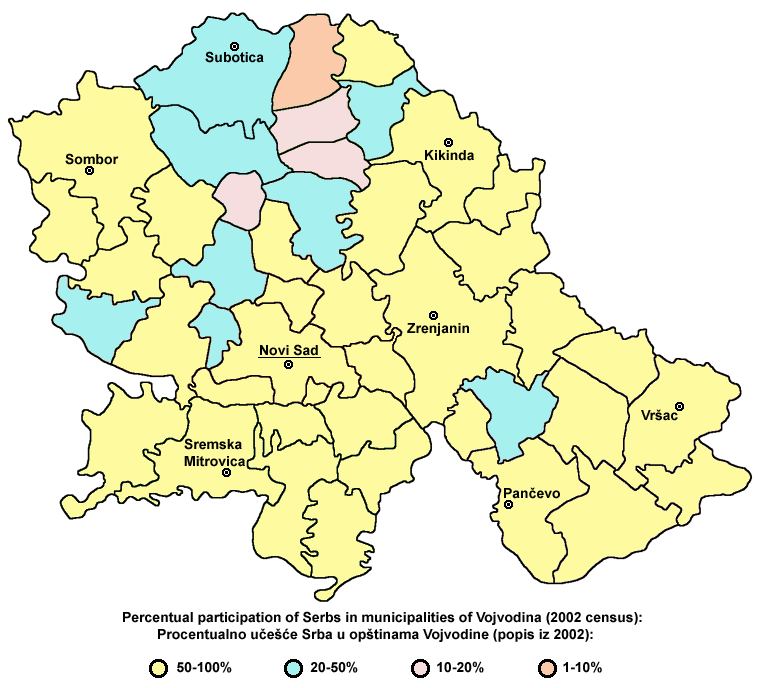
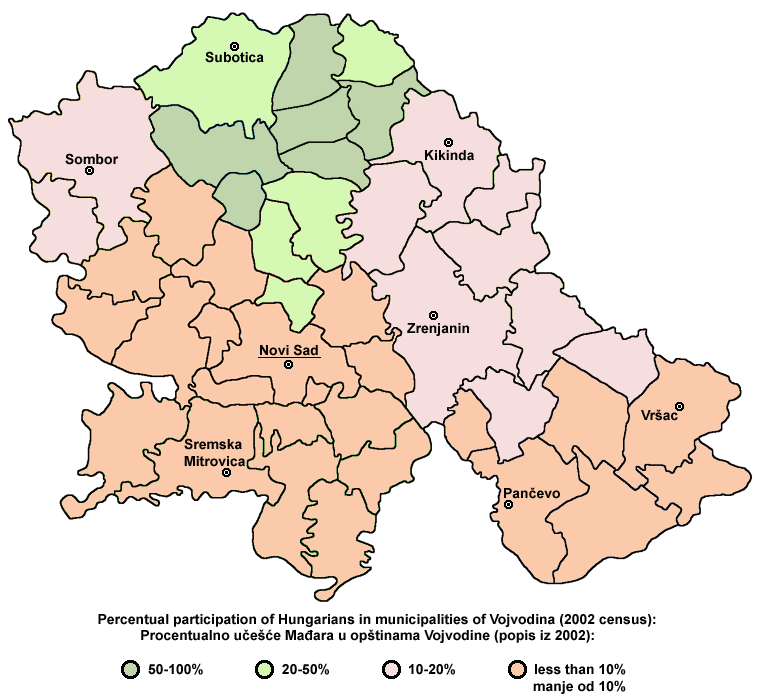
Number % TOTAL 2,031,992 100 Serbs 1,321,807 65.05 Hungarians 290,207 14.28 Slovaks 56,637 2.79 Croats 56,546 2.78 Yugoslavs 49,881 2.45 Montenegrins 35,513 1.75 Romanians 30,419 1.5 Roma 29,057 1.43 Bunjevci 19,766 0.97 Rusyns 15,626 0.77 Macedonians 11,785 0.58 Ukrainians 4,635 0.23 Muslims (by nationality) 3,634 0.18 Germans 3,154 0.16 Slovenes 2,005 0.1 Albanians 1,695 0.08 Bulgarians 1,658 0.08 Czechs 1,648 0.08 Russians 940 0.05 Gorani 606 0.03 Bosniaks 417 0.02 Vlachs 101 0 Others 5,311 0.26 Regional identity 10,154 0.5 Undeclared 55,016 2.71 Unknown 23,774 1.17 -

Ethnic structure of Vojvodina by settlements 2002.
-

Ethnic structure of Vojvodina by settlements 2002.
-

Ethnic structure of Vojvodina by settlements 2002.
-

Share of Serbs in Vojvodina by settlements 2002.
-

Share of Hungarians in Vojvodina by settlements 2002.
-

Share of Slovaks in Vojvodina by settlements 2002.
-

Share of Roumanians in Vojvodina by settlements 2002.
-

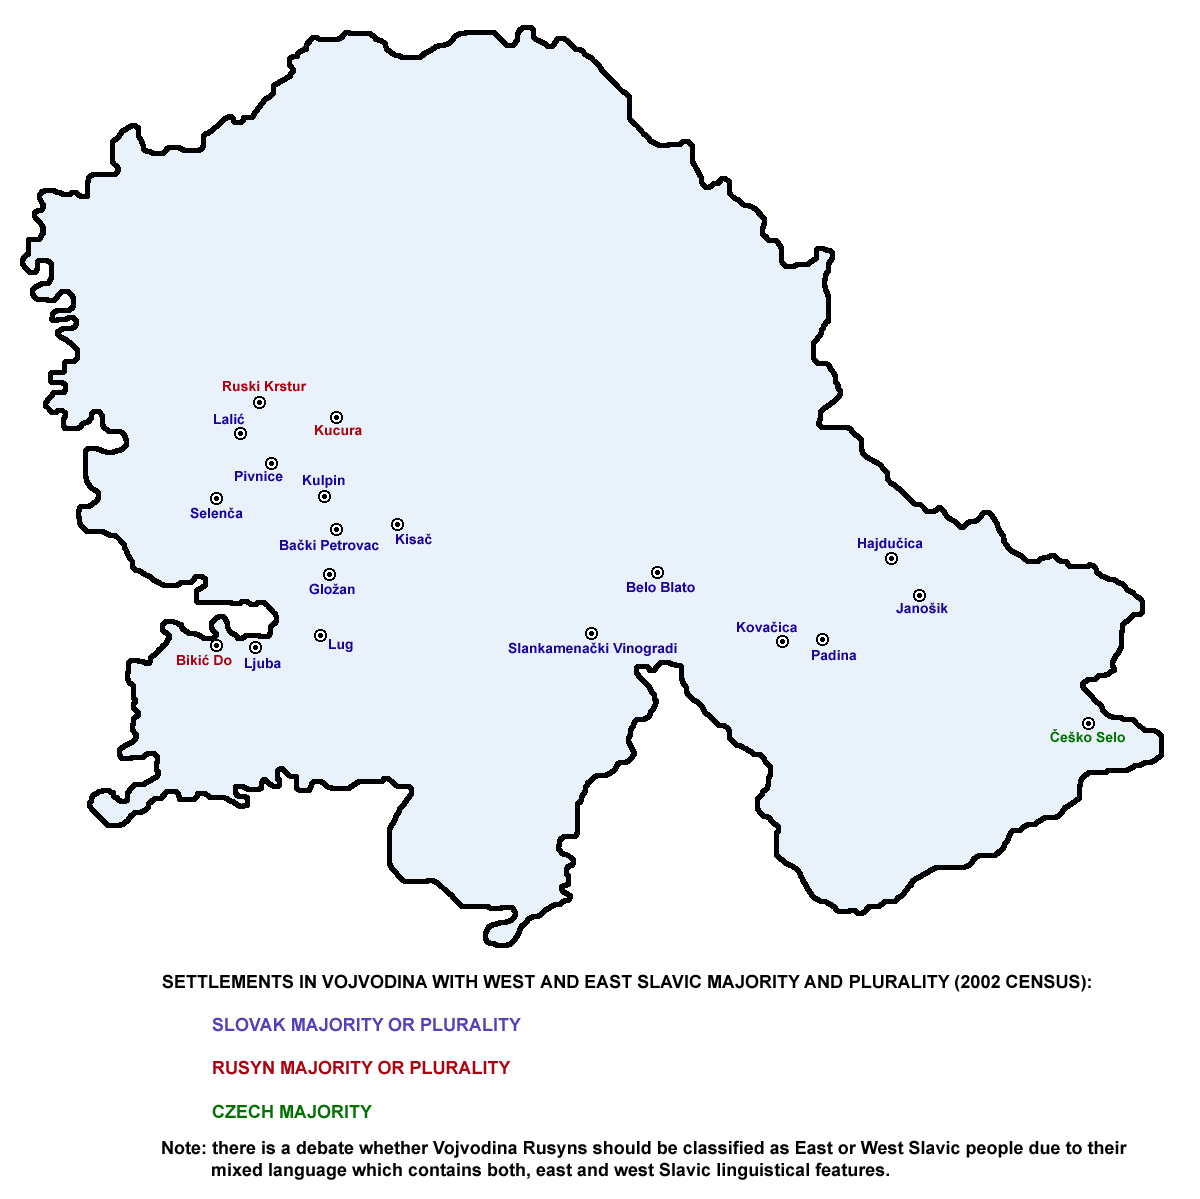
Slovaks, Rusyns and Czechs in Vojvodina 2002.
-

Montenegrins, Bunjevci and Croats in Vojvodina 2002.
-

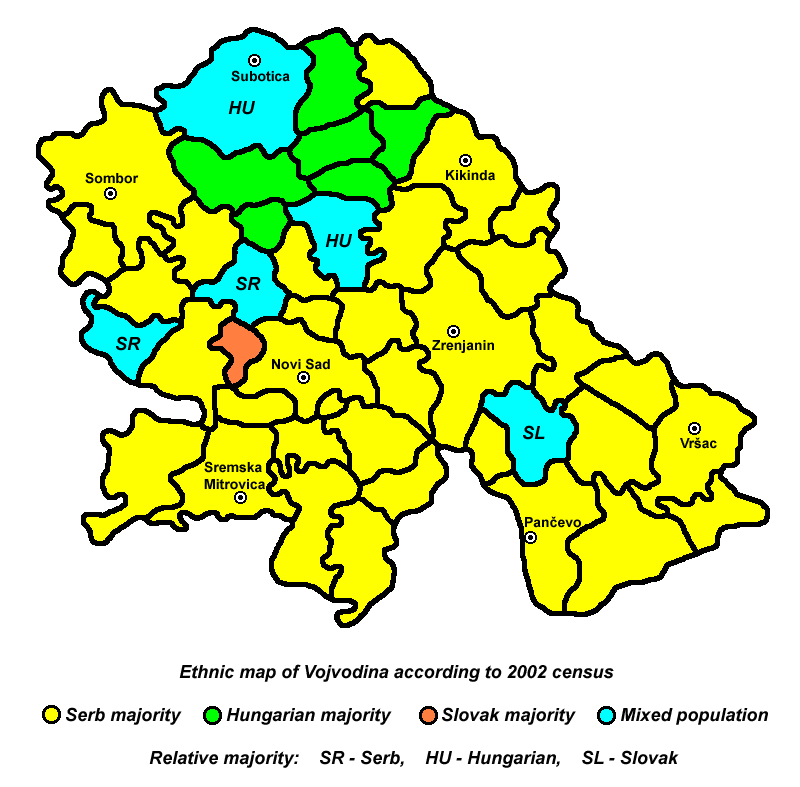
Ethnic structure of Vojvodina by municipalities 2002.
-

Share of Serbs in Vojvodina by by municipalities 2002.
-

Share of Hungarians in Vojvodina by by municipalities 2002.
-

Linguistic structure of Vojvodina by municipalities 2002.
-

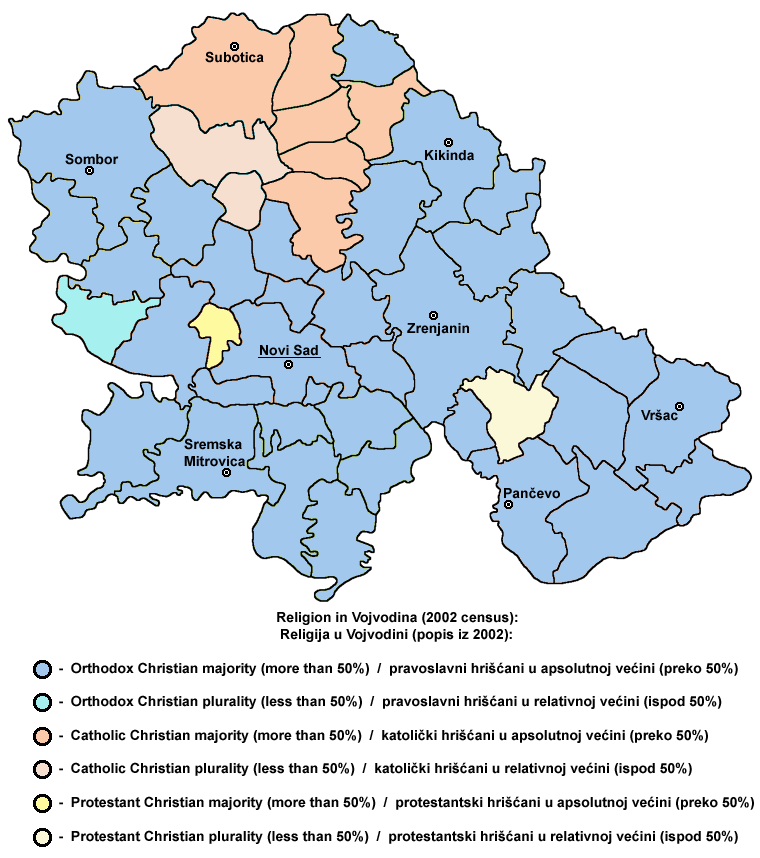
Religious structure of Vojvodina by municipalities 2002.
Future demographic trends
The general demographic trend in Vojvodina is a negative natural increase of population. According to the 1991 census, the average age of the population of the province was 37.7. However, the average age differed among various ethnic groups. The largest ethnic group, Serbs, averaged at 37.4. Other ethnic groups mostly averaged even higher: Romanians 41.9, Hungarians 41.2, Slovaks 40.1, Croats 41, etc. The opposite case were three ethnic groups with younger population: Roma 26, Albanians 29 and Muslims by nationality 29.
According to the 1991 census, the natural increase of Vojvodina's population was −1.8% (up from −4% in 1997). Since the percentage needed for the simple maintenance of the existing population size is 2.3, it is expected that Vojvodina will have to resort to importing labour force in near future (assuming that its economy will improve, since the existing regional economy is not able to employ even all current citizens).
Despite the fact that negative birth rate is common for most ethnic groups in Vojvodina (including Serbs), number of ethnic Serbs in the province is increasing due to the constant immigration of Serbs from other regions (Bosnia and Herzegovina, Montenegro, Central Serbia, etc) to this province. This immigration is triggered by the fact that economic situation in Vojvodina is somewhat better than in the rest of Serbia or in the neighboring countries which are populated by large Serb communities.
See also
- History of Vojvodina
- Ethnic groups of Vojvodina
- Demographic history of Bačka
- Demographic history of Serbian Banat
- Demographic history of Syrmia
- Demographic history of Novi Sad
- Demographic history of Subotica
- Serbs of Vojvodina
- Hungarians in Vojvodina
- Slovaks in Vojvodina
- Croats of Vojvodina
- Montenegrins of Vojvodina
- Romanians in Vojvodina
- Roma people of Vojvodina
- Bunjevci
- Pannonian Rusyns
- Šokci
References
- Dr Dušan J. Popović; Srbi u Vojvodini; knjige 1–3; Novi Sad; 1990.
- Dr Branislav Bukurov; Bačka, Banat i Srem; Novi Sad; 1978.
- Milan Tutorov; Banatska rapsodija – istorika Zrenjanina i Banata; Novi Sad; 2001.
- Borislav Jankulov; Pregled kolonizacije Vojvodine u XVIII i XIX veku; Novi Sad – Pančevo; 2003.
- Lazo M. Kostić; Srpska Vojvodina i njene mannine; Novi Sad; 1999.
- Károly Kocsis (DSc, University of Miskolc) – Zsolt Bottlik (PhD, Budapest University) – Patrik Tátrai: Etnikai térfolyamatok a Kárpát-medence határon túli régióiban + CD (for detailed data), Magyar Tudományos Akadémia (Hungarian Academy of Sciences) – Földrajtudományi Kutatóintézet (Academy of Geographical Studies); Budapest; 2006.; ISBN 963-9545-10-4 (data for 1495–1857)
Notes
- ^ Trajan Stojanović, Balkanska civilizacija, Beograd, 1995, page 103.
- ^ Dr. Drago Njegovan, Prisajedinjenje Vojvodine Srbiji, Novi Sad, 2004.
- ^ Dr Jovan Radonić, Srbija i Ugarska u srednjem veku, zbornik Vojvodina, knjiga I, PROMETEJ, Novi Sad, 2008, page 129.
- ^ Piotr Eberhardt, Ethnic groups and population changes in twentieth-century Central-Eastern Europe: history, data, and analysis, M.E. Sharpe, 2003, page 266.
- ^ Piotr Eberhardt, Ethnic groups and population changes in twentieth-century Central-Eastern Europe: history, data, and analysis, M.E. Sharpe, 2003, page 266.
- ^ Mile Nedeljković, Leksikon naroda sveta, Beograd, 2001.
- ^ Károly Kocsis, Eszter Kocsisné Hodosi, Ethnic Geography of the Hungarian Minorities in the Carpathian Basin, Simon Publications LLC, 1998, page 155.
- ^ Dr Dušan J. Popović, Srbi u Vojvodini, knjiga I, Novi Sad, 1990, page 212.
- ^ Dragomir Jankov, Vojvodina - propadanje jednog regiona, Novi Sad, 2004, page 76.
- ^ Nenad Stefanović, Jedan svet na Dunavu, Beograd, 2003, pages 174-176.
- ^ Dr Jovan Radonić, Srbija i Ugarska u srednjem veku, zbornik Vojvodina, knjiga I, PROMETEJ, Novi Sad, 2008, page 129.
- ^ Károly Kocsis, Eszter Kocsisné Hodosi, Ethnic Geography of the Hungarian Minorities in the Carpathian Basin, Simon Publications LLC, 1998, page 155.
- ^ Dr Dušan J. Popović, Srbi u Vojvodini, knjiga 2, Novi Sad, 1990, page 26.
- ^ Dr Dušan J. Popović, Srbi u Vojvodini, knjiga 2, Novi Sad, 1990, page 27.
- ^ http://hic.hr/books/seeurope/011e-bognar.htm
- ^ Jovan Pejin, Velikomađarski kapric, Zrenjanin, 2007, page 28.
- ^ Milan Tutorov, Banatska rapsodija, Novi Sad, 2001, page 261.
External links
- The Ethnic Structure of the Population in Vojvodina
- Ethnic structure of the population of the present territory of Vojvodina (1880–1991)
- History of Vojvodina (maps)
Ethnic groups in Serbia Central Serbia Serbs · Albanians · Bosniaks · Ethnic Muslims · Bulgarians · Croats · Macedonians · Montenegrins · Roma · Romanians (Vlachs) · YugoslavsVojvodina Banat Bulgarians · Bunjevci · Croats (Šokci) · Germans (Danube Swabians and Banat Swabians) · Hungarians (Szekelys) · Montenegrins · Macedonians · Pannonian Rusyns · Roma · Serbs · Slovaks · Yugoslavs · Romanians · Czechs · Slovenes · Gorani people · Ukrainians · Albanians · RussiansKosovo[a] ^a Kosovo is the subject of a territorial dispute between the Republic of Serbia and the self-proclaimed Republic of Kosovo. The latter declared independence on 17 February 2008, while Serbia claims it as part of its own sovereign territory. Its independence is recognised by 85 UN member states.Demographic history of Europe Sovereign
states- Albania
- Andorra
- Armenia
- Austria
- Azerbaijan
- Belarus
- Belgium
- Bosnia and Herzegovina
- Bulgaria
- Croatia
- Cyprus
- Czech Republic
- Denmark
- Estonia
- Finland
- France
- Georgia
- Germany
- Greece
- Hungary
- Iceland
- Ireland
- Italy
- Kazakhstan
- Latvia
- Liechtenstein
- Lithuania
- Luxembourg
- Macedonia
- Malta
- Moldova
- Monaco
- Montenegro
- Netherlands
- Norway
- Poland
- Portugal
- Romania
- Russia
- San Marino
- Serbia
- Slovakia
- Slovenia
- Spain
- Sweden
- Switzerland
- Turkey
- Ukraine
- United Kingdom
- (England
- Northern Ireland
- Scotland
- Wales)
States with limited
recognition- Abkhazia
- Kosovo
- Nagorno-Karabakh
- Northern Cyprus
- South Ossetia
- Transnistria
Dependencies
and other territories- Åland
- Faroe Islands
- Gibraltar
- Guernsey
- Jan Mayen
- Jersey
- Isle of Man
- Svalbard
Other entities Categories: -


Wikimedia Foundation. 2010.